![]() |
miRBase |
![]() |
![]() |
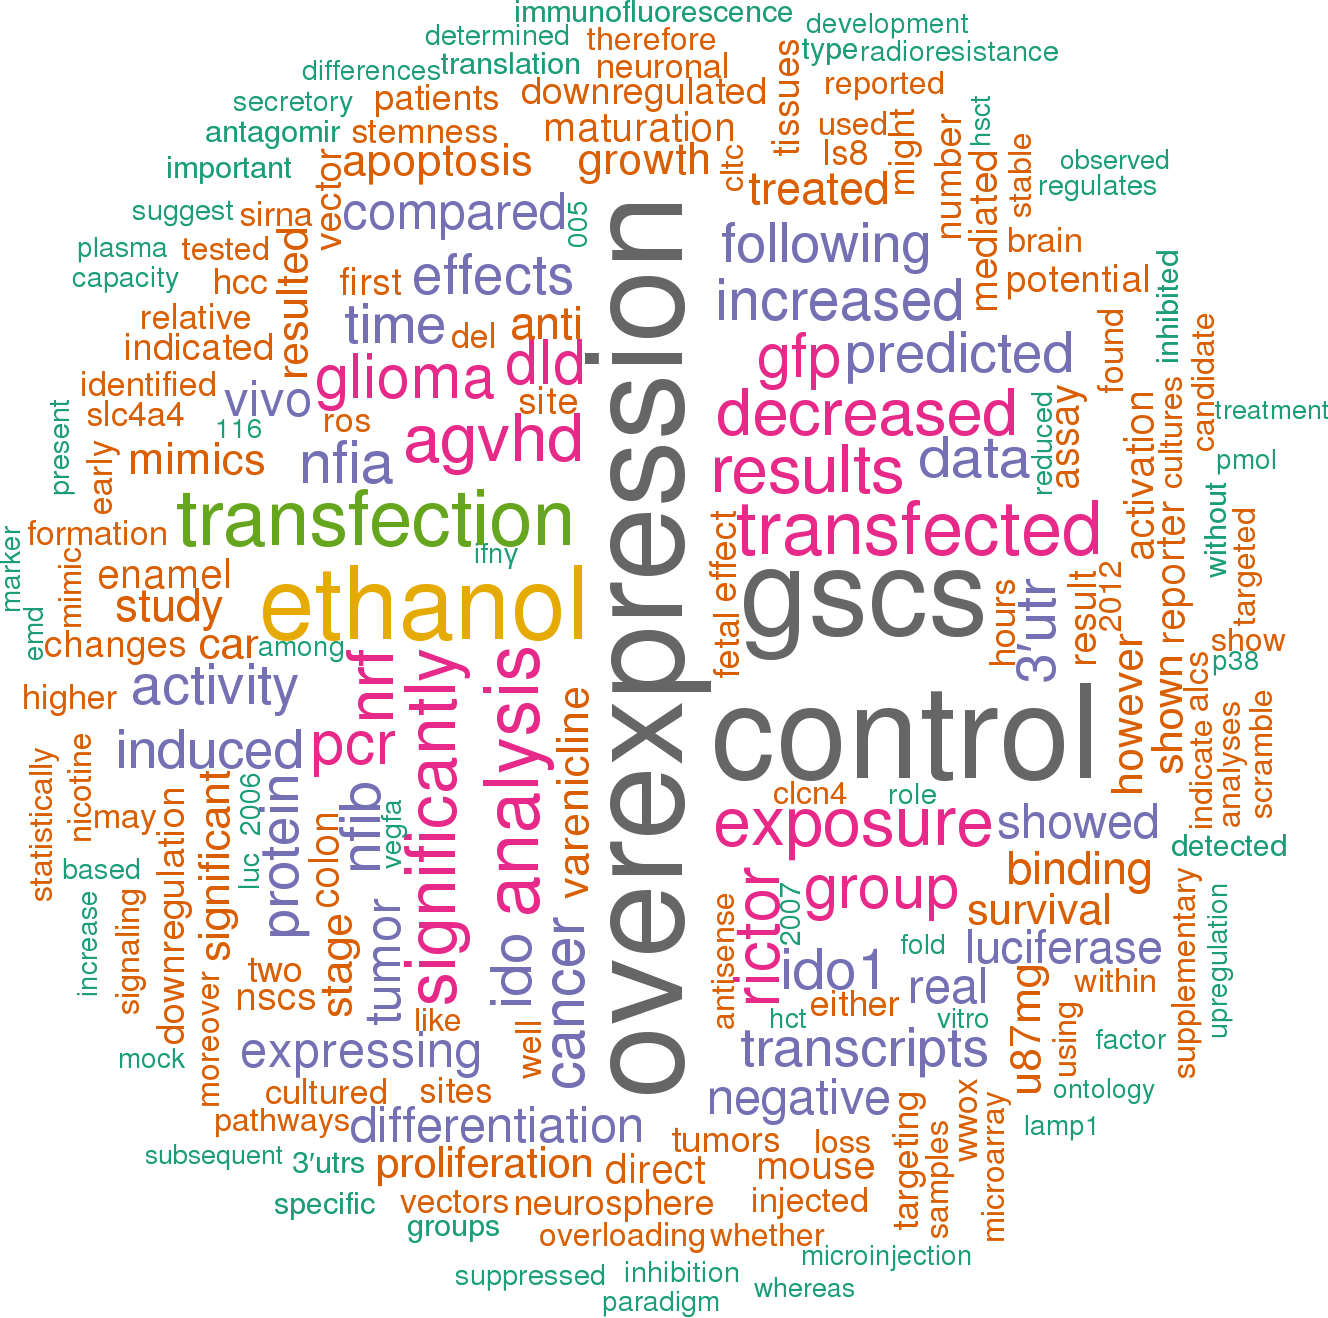
![]() 32 publications mentioning mmu-mir-153Open access articles that are associated with the species Mus musculus and mention the gene name mir-153. Click the [+] symbols to view sentences that include the gene name, or the word cloud on the right for a summary. |
|
1 |
![]()
Other miRNAs from this paper: mmu-let-7g, mmu-let-7i, mmu-mir-9-2, mmu-let-7d, mmu-let-7a-1, mmu-let-7a-2, mmu-let-7b, mmu-let-7c-1, mmu-let-7c-2, mmu-let-7e, mmu-let-7f-1, mmu-let-7f-2, mmu-mir-21a, mmu-mir-9-1, mmu-mir-9-3, mmu-mir-7a-1, mmu-mir-7a-2, mmu-mir-7b, mmu-mir-21b, mmu-let-7j, mmu-mir-21c, mmu-let-7k, mmu-mir-9b-2, mmu-mir-9b-1, mmu-mir-9b-3
mRNAs that were down-regulated following miR-153 over -expression may include both direct and indirect targets.
[score:10]
150 ng of 3′UTR construct (Matn2 (number MmiT031425; GeneCopoeia), Vegfa (number MmiT024368; GeneCopoeia), Nfia (number MmiT054793; GeneCopoeia), Nfib (number MmiT027729; GeneCopoeia), pmiR153-Luc (a positive control for miR-153 translation repression activity, number LR-0064; Signosis, Sunnyvale, CA)), 100 ng of either control or miR-153 mimetic expression plasmids (Cell Biolabs, CA), and 10 µm of control or targeted morpholino antisense, anti-3′UTR oligonucleotides (Gene Tools, Philomath, OR; to protect predicted miR-153 binding sites in 3′UTRs of target mRNA transcripts), were co -transfected into 2×10 [4] cells, using a NEON electroporator according to manufacturer's protocol (as outlined above).
[score:9]
We further identified the Nfia (nuclear factor-1A) and its paralog, Nfib as direct targets of miR-153, and showed that these and other miR-153 target transcripts were also up-regulated following ethanol exposure.
[score:9]
Data analysis showed that miR-153 over -expression resulted in statistically significant down-regulation of 133 genes (at a false discovery rate α = 0.1, of a total of 860 transcripts down-regulated by ≥1.3-fold, Fig. 3a; Table 1).
[score:9]
Residual cytoplasmic labeling in GFP/miR-153 over -expressing cells, represented by yellow immunofluorescence (e. g. c4), may represent incompletely suppressed translation or residual immuno-reactivity due to products of stalled translation.
[score:9]
Although its mRNA transcript was suppressed in neurosphere cultures following miR-153 over -expression (Fig. 3), in vivo expression of HDAC8-immunoreactivity was not altered by miR-153 over -expression (data not shown).
[score:9]
Moreover, in utero over -expression of pre-miR-153 coincided with loss of nuclear Nfia/Nfib immunofluorescence, and miR-153 over -expression in the ventricular zone (VZ) resulted in disrupted Nfia/Nfib expression in the overlying cortical plate, suggesting that miR-153 regulates the Nf1 family in the developing brain.
[score:8]
Since developmental exposure to ethanol suppressed miR-153 expression, we predicted that in utero ethanol exposure would result in increased expression of Nfia and Nfib.
[score:8]
Bar graphs represent real-time RT-PCR analysis for mRNA expression of miR-153 sensitive genes in control neurosphere cultures (untreated or transfection control), ethanol (320 mg/dl) alone, miR-153 over -expression with ethanol exposure (prevention paradigm), or miR-153 over -expression for 48 hours after 5 days of ethanol exposure (reversal paradigm) of NSCs.
[score:7]
Therefore, transfection with the miR-153 expression construct resulted in significant over -expression of miR-153, although within the range of miRNA expression observed in NSCs.
[score:7]
MicroRNA-153 physiologically inhibits expression of amyloid-β precursor protein in cultured human fetal brain cells and is dysregulated in a subset of Alzheimer disease patients.
[score:7]
Evidence for translational regulation by miR-153 acting at 3′UTRs suggested that Nfia and Nfib were direct miR-153 targets.
[score:7]
We therefore asked whether simultaneous over -expression of miR-153 prevented, and sequential over -expression reversed, ethanol's effects on target genes.
[score:7]
These data show that in vivo over -expression of miR-153 results in disrupted translation from target Nfia and Nfib mRNA transcripts.
[score:7]
Data show that baseline miR-153 expression is within the upper 12th percentile of all expressed miRNAs, and that over -expression results in a shift to the 1st percentile.
[score:7]
HDAC8 lacks a predicted miR-153 target site within its 3′UTR, but we examined its expression following miR-153 over -expression because it is the earliest type-1 HDAC to be expressed during neurogenesis in the fetal murine telencephalon (Murko et al., 2010) and is implicated in the etiology of the Wilson–Turner X-linked (Harakalova et al., 2012) and Cornelia de Lange (Deardorff et al., 2012) syndromes, both of which are characterized by cognitive impairment.
[score:7]
Matn2 was not validated as a miR-153 target in our earlier miR-153 over -expression study, scored a lower P [CT] of 0.78, and is predicted to contain a 3′UTR miR-153 target site in primates, but not rodents.
[score:7]
Finally, expression of miR-153/GFP in groups of ventricular zone cells appeared to result in compensatory Nfia and Nfib up-regulation in adjacent GFP -negative cells (e. g. Fig. 9d4,g4, green vs purple arrows), suggesting the presence of adaptive communication mechanisms between adjacent neural progenitors.
[score:6]
Moreover, miR-153 over -expression may block NSC maturation, thereby indirectly uncovering gene expression differences in the microarray analyses.
[score:6]
While varenicline, like nicotine may well regulate the expression of multiple miRNAs, exposure to varenicline along with ethanol in the ex vivo neurosphere mo del did prevent the ethanol induction of miR-153 target mRNAs.
[score:6]
To further assess the role of miR-153 in neural differentiation, we examined the expression of a marker for early migrating and differentiating neurons (des Portes et al., 1998), doublecortin (DCX), which is not predicted to contain a miR-153 binding site in its 3′UTR, and is therefore unlikely to be a direct miR-153 target.
[score:6]
Transcripts that were down-regulated following miR-153 over -expression were significantly overrepresented in ontological categories related to synaptic transmission and G-protein coupled receptor (GPCR) signaling (Table 2).
[score:6]
Analysis of 3′UTRs and in utero over -expression of pre-miR-153 in fetal mouse brain identified Nfia (nuclear factor-1A) and its paralog, Nfib, as direct targets of miR-153.
[score:6]
Identification and gene ontology classification of mRNAs that are down-regulated following miR-153 over -expression.
[score:6]
Transfection with the miR-153 expression construct resulted in a ∼32-fold induction of miR-153 compared to the transfection control (t [(10)] = −8.33, p<8.27e−06, Fig. 1c,d), increasing the relative expression of miR-153 to the upper 1st percentile of all expressed miRNAs (Fig. 1d).
[score:6]
Since Nfia and Nfib were direct targets of miR-153, we hypothesized that exposure to ethanol in an in vivo mo del would result in an increased expression of these factors.
[score:6]
Surprisingly, and contrary to our prediction, miR-153 over -expression following ethanol exposure resulted in significantly increased transcript levels of Nfia and Nfib, even though these transcripts are direct targets of miR-153.
[score:6]
Our data on miR-153 regulation of gene expression and published data on NF-1 suggest that suppressing NF1 will in turn retard NSC maturation, and be predicted to be permissive of continued NSC renewal.
[score:6]
We replicated our previously published observations (Balaraman et al., 2012) that low-dose nicotine exposure (at 1 µM) resulted in increased miR-153, and that as would be predicted, nicotine exposure in vivo, albeit at a relatively high dose, resulted in loss of expression of miR-153's direct targets, Nfia and Nfib, in the fetal cortical plate.
[score:6]
In the case of Ddit4 and Arl2bp, over -expression of miR-153 after ethanol exposure, resulted in the predicted reversal of transcript expression to control levels (p<0.0002 and p<0.027 relative to ethanol exposure, respectively).
[score:5]
We next tested the prediction that because of its suppressive effect on miR-153, ethanol exposure would generally result in increased expression of miR-153-sensitive mRNA transcripts.
[score:5]
Over -expression of miR-153/GFP within the SVZ coincided with loss of expression of DCX-like immunofluorescence (Fig. 10b.
[score:5]
We previously reported that nicotine, acting at nAChRs, induced miR-153 expression and prevented the ethanol -mediated suppression of this miRNA in NSCs (Balaraman et al., 2012).
[score:5]
Filled red and blue circles indicate mRNA transcripts that are suppressed or induced, respectively, by more than 1.3-fold following miR-153 over -expression, at an FDR (Benjamini and Hochberg)-adjusted p<0.1.
[score:5]
Our data indicate that simultaneous over -expression of miR-153 effectively prevents ethanol -mediated induction of miR-153 targets.
[score:5]
Relationship between miR-153 over -expression and the expression of the neuronal differentiation marker DCX, and the neuronal lineage stem cell marker, CD24 and Map2A, in the cerebral cortical VZ and SVZ.
[score:5]
Post-hoc analyses showed that ethanol exposure did result in increased expression of Nfia (p<0.00003), Nfib (p<0.045), Nfic (p<0.0007), Arl2bp (p<0.0002), Ddit4 (p<0.044), and Hdac8 (p<0.0004), and that simultaneous over -expression of miR-153 prevented the inductive effect of ethanol on these mRNA transcripts (cultures administered miR-153 along with ethanol were not significantly different from controls).
[score:5]
Moreover, nicotine also influenced miR-153 expression (Balaraman et al., 2012), suggesting that miR-153 is a target for other teratogenic agents and drugs of abuse.
[score:5]
To assess the differentiation capacity of control or miR-153 over -expressing NSC populations, transfected neurospheres were cultured on laminin-coated (0.5 mg/ml) glass coverslips (number 16004-342; VWR, PA) in 6-well plates for 48 hours, in a mitogen-withdrawal paradigm (+bFGF/−EGF/−LIF) that results in stereotypic transformation of NSCs into early migratory bipolar cells and expression of neuronal markers (Camarillo et al., 2007; Camarillo and Miranda, 2008).
[score:5]
Translation of Luc-Nfib-3′UTR_a (Fig. 6b) or Luc-Nfib-3′UTR_b (Fig. 6c) was not repressed by miR-153 over -expression.
[score:5]
However, miR-153 over -expression did not result in altered expression of CD24-immunofluorescence (Fig. 10d.
[score:5]
The sixth target, EG665934/GM7854, a candidate long noncoding RNA (lncRNA), is predicted (RNAhybrid, (Krüger and Rehmsmeier, 2006)) to contain a miR-153 target site with a 10 nt seed region.
[score:5]
iv) does not alter DCX expression in the SVZ; however, miR-153 over -expression (b. i–b.
[score:5]
To assess the mechanisms underlying miR-153 mediated suppression of differentiation we performed microarray analysis to first identify miR-153 targets in fetal NSCs.
[score:5]
However, translation of Luc-Nfib-3′UTR_c (Fig. 6d) was repressed by miR-153 over -expression (overall ANOVA, F [(4,18)] = 4.6, p<0.01).
[score:5]
It is possible that longer periods of miR-153 over -expression may result in a more profound suppression of differentiation.
[score:5]
However, whereas ethanol exposure resulted in a loss of CD24+ cells both in vivo and in cell culture (Tingling et al., 2013), miR-153 over -expression did not result in loss of CD24 expression, suggesting that miR-153, unlike ethanol, does not interfere with neuronal lineage commitment of VZ and SVZ precursors, but like ethanol, does interfere with subsequent neuronal differentiation.
[score:5]
Consistent with our finding that varenicline induced miR-153, we found that this partial nAChR agonist decreased expression of miR-153-target mRNA transcripts (post hoc fLSD relative to control, p [Nfia]<0.0002, p [Nfib]<0.003, p [Nfic]<0.0001, p [Ddit4]<0.008, p [Hdac8]<0.0002, p [Arl2bp]<0.037, p [Vegfa]<0.02, and p [Ccl2]<0.046, Fig. 14).
[score:5]
Nfic and Hdac8 mRNA expression was not reversed by subsequent miR-153 over -expression.
[score:5]
However, these data, as well as the in vivo effects of nicotine exposure, resulting in suppression of neural Nfia/b expression, provide a rationale for further analysis of the therapeutic potential of varenicline, an agent that provides benefit to the mother by mitigating drug-seeking behavior, and also effectively mimics miR-153 in preventing and reversing the effect of a teratogen on fetal NSCs.
[score:5]
Microarray analysis of gene expression following miR-153 over -expression.
[score:5]
iv), indicating that miR-153 over -expression results in a loss of neuronal differentiation, consistent with gene ontology analyses reported above, which indicated that miR-153 over -expression resulted in repression of differentiation-related mRNAs.
[score:5]
In turn, miR-153 over -expression prevented, and partly reversed, the effects of ethanol exposure on miR-153 target transcripts.
[score:5]
Neither Matn2 nor Vegfa 3′UTRs exhibited evidence for regulation by miR-153 (Fig. 8), indicating that these were not direct miR-153 targets in NSCs.
[score:5]
Comparative analysis of miR-153 (Exiqon miRCURY qPCR arrays, using previously published protocols (Balaraman et al., 2014)) indicates that miR-153 in untransfected control NSCs is expressed at the upper 12th percentile of all expressed miRNAs.
[score:5]
However, both control-GFP and miR-153-GFP over -expressing cells expressed immunofluorescence for MAP2a/b (Fig. 2c.
[score:5]
Varenicline prevents and reverses the effects of ethanol on miR-153 target gene expression.
[score:5]
Conversely, repressed mRNA transcripts like ARL2BP, CCL2 and VEGFA, which did not contain predicted miR-153 binding sites within their 3′UTRs, may be indirect miRNA targets.
[score:4]
To better understand how miRNAs like miR-153 may mediate teratogenesis, we over-expressed miR-153 in fetal NSCs for 24 hours in a transient transfection assay (see Fig. 1a for map of expression construct).
[score:4]
Identification of 3′UTR regulatory motifs in miR-153 targeted transcripts.
[score:4]
Matn2 and Vegfa are not direct targets of miR-153.
[score:4]
Our data collectively show that members of the Nf1 family are specific, direct targets of miR-153.
[score:4]
Nfib is a direct target of miR-153.
[score:4]
Similarly, Nfib was a direct target of miR-153.
[score:4]
Post-transcriptional regulation of alpha-synuclein expression by mir-7 and mir-153.
[score:4]
List of major gene ontologies (GO) and KEGG pathways down-regulated by miR-153 with a Z-score >2.0 (indicating that this ontology is over-represented among the regulated genes compared to 95% of all other possible ontologies and pathways).
[score:4]
However, these data do suggest the possibility that some of the induced transcripts may be direct targets of miR-153 as well.
[score:4]
MiR-153 sequences are shown in black while the matching binding site sequences are illustrated in blue (target_7285) and red (target_9451).
[score:4]
However, another ethanol-sensitive miRNA, miR-9 (indicated with arrow), is expressed at a higher baseline level compared to miR-153 over -expression.
[score:4]
Co-regulation of intragenic microRNA miR-153 and its host gene Ia-2 β: identification of miR-153 target genes with functions related to IA-2β in pancreas and brain.
[score:4]
Fig. 3. (a) Volcano-plot illustrates relationship between log [2](mRNA expression ratio) and log [2](FDR-corrected p-value) in miR-153 over -expressing cultures compared to controls.
[score:4]
The effects of miR-153 are likely to be mediated by a large network of both directly and indirectly regulated genes.
[score:4]
For example, ethanol's effects in neurosphere cultures were mimicked by loss of miRNAs, including miR-153 (Sathyan et al., 2007), and in a zebrafish mo del, developmental miR-153 knockdown was shown to mimic ethanol's effects on both craniofacial development and behavior (Tal et al., 2012).
[score:4]
In the next series of experiments, we exposed neurosphere cultures to either control medium, to varenicline alone, to the ‘prevention paradigm’ (varenicline together with ethanol for 5 days), or to the ‘reversal paradigm’ (varenicline for 48 hours subsequent to a 5-day episode of ethanol exposure), and examined the regulation of miR-153 target gene transcripts.
[score:4]
Identification of Nfia 3′UTR as a direct target of miR-153.
[score:4]
However, sequential exposure to miR-153 following ethanol also unexpectedly resulted in an induction of transcripts (Nfia and Nfib) that are direct miR-153 targets.
[score:4]
Moreover, these data are collectively consistent with recent evidence that miR-153 prevents the development and maturation of motor neurons (Wei et al., 2013), and serves as a translational repressor for synaptic and signaling proteins that are important for neuronal maturation and function (Doxakis, 2010; Long et al., 2012; Wei et al., 2013).
[score:4]
Bar graph depicts real-time RT-PCR analysis of mRNA expression of miR-153-regulated genes in control neurospheres, or neurospheres treated with varenicline (1 µM) alone, varenicline in combination with ethanol (prevention paradigm), and varenicline treatment for 48 hours following 5 days of ethanol exposure (reversal paradigm).
[score:4]
iv) MiR-153 over -expression does not result in a loss of MAP2a/b expression in newly generated neurons of the VZ (white circles).
[score:4]
We next assessed the possibility that pharmacological interventions could prevent the inductive effects of ethanol on miR-153 target genes.
[score:3]
This network includes the nuclear factor-1 family, Nfia, Nfib, and Nfic, which were all suppressed by miR-153 in neurosphere cultures.
[score:3]
Following transfection with control-GFP or miR-153-GFP expression vectors, neurosphere-derived cells were cultured for an additional 48 hours on a laminin substrate, in a mitogen-withdrawal -induced differentiation paradigm that has previously been shown to result in transformation of NSCs into early migratory neurons (Camarillo et al., 2007; Camarillo and Miranda, 2008; Tingling et al., 2013).
[score:3]
We previously showed that ethanol exposure resulted in decreased miR-153 expression in NSCs (Balaraman et al., 2012; Sathyan et al., 2007).
[score:3]
Fig. 1. (a) Schematic structure of the pre-miR-153/GFP-puromycin expression vector (Cell Biolabs, CA).
[score:3]
The question that arises is “Will identifying molecular targets of miR-153 provide us with insights into potential mechanisms for teratogenesis in NSCs?”.
[score:3]
In the following series of experiments, we identified cell-signaling gene networks as important targets of miR-153 in fetal cortical NSCs.
[score:3]
However, over -expression of miR-153 after ethanol exposure resulted in a surprising and significant additional increase in Nfia, Nfib and Vegfa mRNA transcript levels relative to ethanol exposure alone (p<0.0004, p<0.0002, and p<0.1E−09, respectively).
[score:3]
iv) and following miR-153 over -expression (d. i–d.
[score:3]
Data based on analysis of 34 control and 26 miR-153-over -expressing cells.
[score:3]
Bar graph depicts real-time RT-PCR expression of miR-153 in control, nicotine and varenicline-exposed neurosphere cultures.
[score:3]
Some cell aliquots were also co -transfected with pre-miR-153 or control expression vectors.
[score:3]
iv), consistent with the lack of ex vivo effects of miR-153 on MAP2a/b expression in neurosphere cultures (Fig. 2c,d).
[score:3]
In each of these transcripts, experimental analysis showed the presence of specific, active miR-153 binding sites that, based on the predicted folding of the 3′UTRs, are in close proximity to both 5′ and 3′-termini of the 3′UTRs, positioning these sites to influence translation.
[score:3]
The red line is the regression line that indicates a negative linear relationship between ontology classes of miR-153 suppressed and induced mRNA transcripts.
[score:3]
These data show that simultaneous exposure to miR-153 prevents ethanol induction of most miR-153 responsive transcripts, while sequential over -expression of miR-153 after ethanol exposure results in reversal of ethanol effects on some transcripts.
[score:3]
miR-153 over -expression does not result in a loss of CD24 immunofluorescence (white circles).
[score:3]
Nicotine and the nAChR partial agonist varenicline induce miR-153 expression.
[score:3]
Fig. 4. Bar graphs depict the real time RT-PCR quantification of mRNAs in vector control and miR-153 over -expression conditions for candidate mRNA transcripts identified from the microarray experiment that achieved the adjusted p-value cut-off of 0.1 (a) and raw p-value of 0.05 (b), respectively.
[score:3]
We next sought to determine if miR-153 interfered with neuronal lineage commitment by examining the expression of CD24, because previous observations indicated that CD24+ precursors are committed to neuronal lineage (Nieoullon et al., 2005; Pastrana et al., 2009; Pruszak et al., 2009; Tingling et al., 2013; Yuan et al., 2011).
[score:3]
Three genes, Akt1, Foxj2, and Mkln, were chosen as validation controls that were not statistically significantly altered by miR-153 over -expression.
[score:3]
Masking morpholinos, Nfia_mask_ii and Nfia_mask_iii, but not Nfia_mask_i, were able to completely protect against miR-153 -mediated translation repression.
[score:3]
Consistent with the increase in miR-153 expression, in utero exposure to nicotine (1 mg/kg, twice a day) between GD12.5 and 14.5 resulted in a near complete loss of Nfia (white arrows, Fig. 11c.
[score:3]
To understand the role of miR-153 in the etiology of teratology, we first screened fetal cortical NSCs cultured ex vivo, by microarray and quantitative RT-PCR analyses, to identify cell-signaling mRNAs and gene networks as important miR-153 targets.
[score:3]
The partial nicotinic agonist, varenicline, induces expression of miR-153.
[score:3]
Ethanol -targeted miRNAs like miR-153 may mediate and explain some of ethanol's teratogenic effects.
[score:3]
The y-axis indicates normalized miR-153 expression (normalized to U6) relative to control samples.
[score:3]
In the case of Nfia, miR-153 targeting of Luc-Nfia-3′UTR_a did not significantly repress luciferase activity (Fig. 5d).
[score:3]
Both nicotine and varenicline (each at 1.0 µM for 5 days) resulted in a statistically significant induction of miR-153 expression in neurosphere cultures (F [(2,15)] = 5.621, p<0.015, Fig. 13).
[score:3]
Briefly, cell aliquots (4×10 [5] cells) were treated with 1.5 µg of the scrambled control-GFP or pre-miR-153-GFP expression vector for 12 hours.
[score:3]
Sample miR-153 candidate gene targets from microarray analysis.
[score:3]
Moreover, miR-153 over -expression following ethanol exposure did reverse the effect of ethanol on some genes, i. e. Arl2bp and Ddit4.
[score:3]
The Nfib-mask_i morpholino protected the second, more distally located predicted miR-153 binding site (Nfib/NM_008687.5 [6559–6566]), located near the 3′-end of the 3′UTR, and prevented translation repression.
[score:3]
edu (Zuker, 2003)) of the folding of the Nfia 3′UTR indicates that miR-153 target site Nfia/NM_010905.3 [77285–7306] localizes to a complex of branched stem–loop structures, whereas Nfia/NM_010905.3 [9451–9469] localized to a predicted linearized portion of the 3′UTR.
[score:3]
Moreover, low-dose exposure to the partial nAChR agonist, varenicline also induced miR-153 expression.
[score:3]
At this level of expression, miR-153 is 2.5-fold less abundant than miR-9, another ethanol-sensitive miRNA (Balaraman et al., 2012; Pappalardo-Carter et al., 2013; Sathyan et al., 2007).
[score:3]
Transfection with the miR-153 mimetic resulted in a ∼30-fold induction of miR-153 expression relative to control groups, without a statistically significant change in another ethanol-sensitive miRNA, miR-21 (data not shown).
[score:3]
Caspase activity was high in U937 cells treated with camptothecin (4 µg/ml for four hours, positive control) and staurosporine (2 µM for two hours) -treated neurosphere cultured cells and low in neurosphere cultures transfected with control or pre-miR-153 expressing vectors.
[score:3]
Briefly, 4×10 [5] cells were treated with 1.5 µg of the scrambled control-GFP or pre-miR-153-GFP expression vector followed by incubation with 10 µM EdU (5-ethynyl-2′-deoxyuridine) for 16 hours to monitor DNA synthesis.
[score:3]
Recently, developmental ethanol exposure was shown to also result in decreased miR-153 in a zebrafish mo del, and dysregulation of miR-153 in that mo del in turn resulted in neurobehavioral impairment (Tal et al., 2012).
[score:3]
It is possible that the post-ethanol inductive effect of miR-153 on Nfia and Nfib is indirect, i. e. due to repression of an intermediate regulatory factor.
[score:3]
Neurosphere cultures were exposed to control medium or to ethanol, at a concentration (320 mg/dl) that was previously shown to suppress miR-153 (Balaraman et al., 2012; Sathyan et al., 2007), and was within the range of blood alcohol content achievable in alcoholics (Adachi et al., 1991).
[score:3]
In silico analysis (MirWalk, (Dweep et al., 2011)) of the top six statistically significantly induced RNA transcripts, Patl2, Dhrs13, Rps25, Rai14, Foxo3, and EG665934/GM7854 (FDR-corrected α = 0.02), predicted that two, Rai14 and Rps25, each contained a miR-153 target site with a seed region of 9 nt in length (p<0.037) within the presumptive promoter, a 2 kb upstream gene flanking region.
[score:3]
Tissues were incubated with primary antibody overnight at 4°C in appropriate dilution (anti-GFP to visualize co -expression of miR-153 (1:800; number ab13970; Abcam, MA), anti-Nfib (1:100, number HPA003956; Sigma–Aldrich, MO), anti-Nfia (1:100, number AP14133b, Abgent, CA), anti-Hdac8 (1:400; number ab39664, Abcam, MA), anti-DCX (1:800; number ab18723, Abcam, MA) and anti-CD24 (1:300; number ab64065, Abcam, MA) and MAP2 a&b (Ab5622, 1:300; Millipore).
[score:3]
Map2a/b immunolabeling also shows deficient morphological transformation following miR-153/GFP over -expression.
[score:3]
Varenicline, a partial nicotinic acetylcholine receptor agonist that, like nicotine, induces miR-153 expression, also prevented and reversed the effects of ethanol exposure.
[score:3]
These data indicate that miR-153 binding sites within Nfia and Nfib 3′UTRs are positioned to influence translation activity within the open reading frame (ORF).
[score:3]
These implicated ontology categories are consistent with our observations that miR-153-over -expressing cells exhibit deficient morphological transformation when cultured in a mitogen-withdrawal differentiation paradigm.
[score:3]
Pre-miR-153-GFP or control-GFP expression constructs were delivered to the telencephalic wall of GD13.5 fetuses by intrauterine injection under ultrasound guidance (Fig. 9a) followed by electroporation.
[score:3]
Effects of miR-153 over -expression on differentiation, apoptosis and cell proliferation.
[score:3]
Furthermore, we focused on a strategy of miR-153 over -expression rather than repression, as a means to prevent and reverse ethanol's effects on NSCs.
[score:3]
Neural progenitors were exposed to mmu-miR-153 mimetic (miRNASelect™ pEGP-mmu-miR-153 Expression Vector, Cell Biolabs, CA) or control (miRNASelect™ pEGP-miR Null Control Vector, Cell Biolabs, CA), either alone or in combination with ethanol at 320 mg/dl.
[score:3]
MiR-153 regulates Nfia and Nfib expression in fetal brains.
[score:3]
None of the validation control mRNAs were altered following miR-153 over -expression.
[score:3]
Moreover, miR-153 over -expression prevented neuronal differentiation without altering neuroepithelial cell survival or proliferation.
[score:3]
Additionally, because the microarray screen identified Nfic as a candidate target for miR-153, we also assessed other members of the nuclear factor family, Nfia and Nfib.
[score:3]
The y-axis indicates the z-score of ontology analysis of mRNAs suppressed by miR-153.
[score:3]
We previously showed that ethanol decreased, while nicotine increased miR-153 expression in NSCs.
[score:3]
MiRNA expression of control and miR-153 mimetic -treated samples was validated before performing mouse whole genome microarray analysis.
[score:3]
Moreover, varenicline, a partial nicotinic acetyl choline receptor (nAChR) agonist (Mihalak et al., 2006), prevented and reversed the effects of ethanol on miR-153 target transcripts.
[score:3]
Collectively, these data indicate that two out of four predicted miR-153 binding sites localized near the end of the Nfia-3′UTR (Nfia/NM_010905.3 [7285–7306] and Nfia/NM_010905.3 [9451–9469]) mediated miR-153 translation repression in fetal neuroepithelial cells.
[score:3]
Moreover, miR-153 over -expression also did not result in loss of MAP2a/b immunofluorescence in newly differentiating neurons of the VZ (Fig. 10e.
[score:3]
The presence of anti-GFP immunofluorescence was used as a localization marker for cellular over -expression of miR-153.
[score:3]
Finally, in the ‘reversal paradigm’, varenicline exposure subsequent to ethanol exposure prevented the ethanol -induced increase in all miR-153 target transcripts (Nfia, Nfib, Nfic, Hdac8, Arl2bp, and Vegfa, all p = n. s. (not significantly different), or Ddit4, decreased, p<0.0008, relative to controls).
[score:3]
Among the genes that met the adjusted-p<0.1 criteria, Arl2bp (t [(10)] = 3.09, p<0.01), Ccl2 (t [(10)] = 3.14, p<0.01), Ddit4 (t [(10)] = 2.70, p<0.02), Fbxo2 (t [(10)] = 2.48, p<0.03), Hdac8 (t [(10)] = 3.66, p<0.004) and importantly, Nfia, Nfib and Nfic (t [(10)] = 2.67, p<0.024; t [(10)] = 5.49, p<0.001; t [(10)] = 5.28, p<0.001, respectively, Fig. 4a), were significantly decreased following miR-153 over -expression in the validation experiment.
[score:3]
Microarray and gene ontology analysis shows that miR-153 over -expression repressed cell-signaling pathways including GPCR pathways, which are important for NSC maturation (Callihan et al., 2011; Kobayashi et al., 2010).
[score:3]
RT-PCR of mRNA was performed to evaluate expression of candidate miR-153 target transcripts that were identified in the mouse whole genome microarray analysis.
[score:3]
We also observed that miR-153 over -expression in vivo within the SVZ coincided with loss of DCX immuno-labeling providing further evidence that miR-153 is a repressor of neuronal differentiation.
[score:3]
Over -expression of miR-153 after an episode of ethanol exposure (the reversal paradigm), on the other hand, resulted in varied outcomes.
[score:3]
Varenicline decreases expression of miR-153 -dependent mRNAs and prevents and reverses effects of ethanol.
[score:3]
These bioinformatics analyses suggest that in NSCs, miR-153 suppresses pathways that are important for the function of differentiated neurons.
[score:3]
In each row, panel ‘i’ depicts miR-153-GFP or control GFP expression, panel ‘ii’ depicts immunofluorescence for DCX, CD24 or Map2A, panel ‘iii’ depicts combined immunofluorescence and panel ‘iv’ depicts DAPI labeling of cell nuclei.
[score:3]
iii), an early-appearing neuronal marker (Papandrikopoulou et al., 1989), indicating that miR-153 over -expressing cells retain at least some aspects of neuronal lineage commitment, despite reduced neurite extension.
[score:3]
miR-153 regulates SNAP-25, synaptic transmission, and neuronal development.
[score:3]
However, miR-153 over -expression did not result in significant apoptosis (Fig. 2f) or change in cell proliferation (Fig. 2g).
[score:3]
Bar graphs depict the real time RT-PCR quantification of mRNAs in vector control and miR-153 over -expression conditions for candidate mRNA transcripts identified from the microarray experiment that achieved the adjusted p-value cut-off of 0.1 (a) and raw p-value of 0.05 (b), respectively.
[score:3]
Nfia and Nfib each contained several predicted miR-153 binding sites in their 3′UTRs with high aggregate P [CT]s (probability of conserved targeting (Friedman et al., 2009)) of 0.99 and 0.96, respectively, indicating that miR-153 interactions with Nfia/Nfib 3′UTRs are likely to be evolutionarily conserved.
[score:3]
RT-PCR validation of candidate miR-153-regulated mRNAs.
[score:2]
MiR-153 prevents and partly reverses ethanol's effects on miR-153-regulated gene transcripts.
[score:2]
While current analysis focused on miR-153-repressed transcripts, potential direct effects on induced transcripts cannot be discounted.
[score:2]
MiR-153 over -expression also did not alter cell survival, and unlike ethanol (Santillano et al., 2005), did not alter cell proliferation.
[score:2]
Importantly, varenicline administration subsequent to ethanol exposure, reversed the ethanol-induction of nearly all of the assessed miR-153-regulated transcripts, including importantly, Nfia/b/c.
[score:2]
Identification of miR-153-regulated candidate genes.
[score:2]
There was an overall significant effect (MANOVA [PTS], F [(27,24)] = 2.36, p<0.018), as well as a transcript-specific effect of nicotinic activation on miR-153-regulated transcripts (ANOVAs, F [(3,14)Nfia] = 13.51, p<0.0002; F [(3,14)Nfib] = 6.946, p<0.004; F [(3,14)Nfic] = 16.1, p<8.15E−05; F [(3,14)Ddit4] = 21.8, p<1.5E−05; F [(3,14)Hdac8] = 21.18, p<1.8E−05; F [(3,14)Arl2bp] = 3.55, p<0.04; F [(3,14)Vegfa] = 5.031, p<0.014; and F [(3,14)Ccl2] = 10.24, p<0.0008).
[score:2]
MiR-153 modulates Nfia and Nfib expression in mouse fetal brains.
[score:2]
While little is known about miR-153, an extensive literature documents the developmental role of the Nf1 family.
[score:2]
Based on the above data, we hypothesized that varenicline would prevent and reverse the effects of ethanol exposure on miR-153-regulated mRNAs.
[score:2]
MiR-153 expression is significantly induced in nicotine and varenicline -treated groups.
[score:2]
Sholl analysis (Fig. 2e) indicated that differentiating cells over -expressing GFP-miR-153 had significantly shorter neurites compared to cells transfected with the control GFP plasmid (Multivariate Analysis of Variance–Pillai's Trace Statistic (MANOVA [PTS]), F [(10,49)] = 5.11, p<4.35E−05).
[score:2]
This hypothesized linkage between miR-153, the Nfia family and fetal alcohol neurodevelopmental defects needs further assessment especially in light of associations between Nfia haplo-insufficiency and brain malformations in human populations (Lu et al., 2007).
[score:2]
Pink arrows show nuclei immuno-stained for Nfia or Nfib, while green arrows indicate strong cytoplasmic miR-153-GFP immuno-staining.
[score:1]
Importantly, we present evidence showing that miR-153 prevents, and even partly reverses the effects of ethanol exposure.
[score:1]
Once the fetal orientation was determined, 5 µg of control or miR-153 plasmid was injected with a micropipette, under ultrasound guidance, through the uterine wall, into the fetal lateral ventricle.
[score:1]
We therefore co -transfected either scrambled (control), or antisense morpholino oligonucleotides (Table 3; Fig. 5b, Fig. 6a) into some samples, to mask predicted miR-153 binding sites.
[score:1]
We therefore re-tested the effect of nicotine on miR-153.
[score:1]
iii), whereas miR-153-GFP transfected cells exhibited deficient morphological transformation (Fig. 2b.
[score:1]
Mo del for the hypothesis that a network of miR-153 and the NF1 neurogenic transcription factor family (Nfia/b/c) mediate the effects of ethanol on NSC maturation.
[score:1]
MiR-153, a brain-enriched (Sempere et al., 2004), evolutionarily conserved miRNA located within the PTPRN2 gene locus, is a candidate mediator of teratogenesis.
[score:1]
A cohort of miRNAs, including miR-153, may serve as mediators of teratogenesis.
[score:1]
Additional control or antisense morpholinos, (e) mask_i, mask_ii, and (f) mask_iii, used to protect the miR-153 binding sites were co -transfected along with other constructs as indicated on the x-axis.
[score:1]
These included 10 candidate miR-153-repressed transcripts that reached an FDR-corrected p<0.1 (Aplp2, Arl2bp, Ccl2, Cxcl1, Ddit4, Fbxo2, Hdac8, Matn2, Nfic, Rab13), and 4 with an uncorrected p<0.05 (Ccl7, Mid1, Mtap1s, Vegfa).
[score:1]
Double immunohistochemistry of anti-GFP with anti-Nfia or anti-Nfib in control-GFP (b) or Pre-miR-153-GFP (c–h) transfected GD15.5 mouse frozen sections.
[score:1]
Vegfa 3′UTR contained no predicted miR-153 binding sites, although VEGFa mRNA was significantly reduced following miR-153 transfection.
[score:1]
We were also interested in examining the extent to which miR-153 could prevent or even reverse the effects of ethanol on NSCs.
[score:1]
The percentage of labeled cells was not significantly different indicating that cell proliferation was not altered by miR-153 overexposure.
[score:1]
Among the cohort of genes that exceeded the ‘raw’ p<0.05 criterion, only Vegfa (t [(10)] = 3.07, p<0.012, Fig. 4b) was significantly reduced following miR-153 exposure in the validation sample.
[score:1]
A 10 µl cell suspension containing 3∼4 million cells was transfected by electroporation with 7 µg of either control or miR-153 precursor clone using a NEON electroporator with transfection kit (settings 1200 V, 20 ms, 2 pulses, Life Technologies, CA).
[score:1]
The x-axis depicts treatment conditions (control or miR-153).
[score:1]
To assess the capacity of miR-153 to prevent ethanol's effects (prevention paradigm), some ethanol -treated cultures were concurrently exposed to miR-153 by transient transfection.
[score:1]
MiR-153 over -expressing cells have shorter neurites compared to controls.
[score:1]
MiR-153 over -expressing cells exhibited deficient morphological transformation compared to control cells.
[score:1]
Therefore, potential interactions of miR-153 with induced mRNAs and lncRNAs need further assessment.
[score:1]
Transcript profiles were assessed from RNA samples obtained 24 hours following transfection with GFP/miR-153 or GFP control vectors (6 independent replicates in each condition, microarray data submitted to NCBI-GEO (accession number GSE49684)).
[score:1]
The x-axis depicts the z-score of ontology analysis of mRNAs induced by miR-153.
[score:1]
Collectively, repressed ontology categories were broadly associated with mature neural function, suggesting that miR-153 served as a repressor of neuronal differentiation in NSCs.
[score:1]
Purple bars represent the morpholinos used to protect the predicted miR-153 binding sites.
[score:1]
In contrast, following in utero electroporation of the pre-miR-153/GFP construct, GFP immunopositive cells showed little-to-no immunofluorescence for either Nfia or Nfib, whereas adjacent GFP -negative cells exhibited strong nuclear localization of Nfia and Nfib immunoreactivity (Fig. 9c1–c4,d1–d4,f1–f4,g1–g4).
[score:1]
We identified miR-153 as one of a small cohort of miRNAs that were significantly decreased in fetal NSCs, following ethanol exposure (Sathyan et al., 2007).
[score:1]
The human genome encodes two copies of miR-153 (mir-153-1 and miR-153-2), whereas the mouse genome encodes a single copy of this miRNA (Mandemakers et al., 2013).
[score:1]
3′UTR analysis of miR-153 candidate genes.
[score:1]
However, miR-153 did repress luciferase activity from the Luc-Nfia-3′UTR_b and from the Luc-Nfia-3′UTR_c constructs (overall ANOVAs, F [(6,28)] = 17.23, p<3.07E−08, and F [(4,18)] = 4.59, p<0.01, respectively, Fig. 5e,f).
[score:1]
Additional control or antisense morpholinos, (d) Nfib-mask_i, used to protect the predicted miR-153 binding sites in Nfib 3′UTR were co -transfected into same samples as indicated.
[score:1]
Purple bars represent the morpholinos used to mask the miR-153 binding sites.
[score:1]
These data collectively provide evidence for a role for miR-153 in preventing premature NSC differentiation.
[score:1]
Their connection with miR-153 also needs further assessment.
[score:1]
Green triangles indicate the predicted miR-153 binding sites that are conserved among vertebrates, whereas the blue triangle illustrates the predicted miR-153 binding site that shares conservation between mouse and human.
[score:1]
These data show that varenicline mimics the effects of miR-153, and like miR-153, behaves as a functional antagonist to ethanol.
[score:1]
For mRNA microarray analysis, 1.0 µg of purified mRNA samples from either control or miR-153 mimetic -treated groups, mixed with 50 pg RNA spike-in control, were used to generate biotin labeled cRNA samples by a linear amplification method using Ambion's MessageAmp™ II-Biotin Enhanced Single Round aRNA Amplification Kits (number Am1791; Life Technologies, CA).
[score:1]
In this context, the published literature implicating miRNAs like miR-153 as mediators of teratogenesis (Sathyan et al., 2007; Tal et al., 2012) is important, because miRNAs can be manipulated to promote neuro-protection after the onset of neuro-trauma (Selvamani et al., 2012).
[score:1]
Following in utero electroporation of control-GFP or miR-153/GFP vectors, fetuses were maintained for an additional period of 48 hours, before being analyzed at GD15.5.
[score:1]
iii) and miR-153/GFP (d. i–d.
[score:1]
Green triangles indicate the predicted miR-153 binding sites that are conserved among vertebrates.
[score:1]
Bar graphs represent luciferase activity normalized to the mean activity of samples transfected with the miR-153 control vector.
[score:1]
These data suggest that loss of miR-153 may explain some, but not all, ethanol effects on NSCs.
[score:1]
To assess the capacity of miR-153 to reverse the effects of prior ethanol exposure (reversal paradigm), other ethanol -treated cultures were exposed to miR-153 for 48 hours following a five-day period of ethanol exposure.
[score:1]
The reported experiments utilized mouse (mmu)-miR-153 as an experimental mo del.
[score:1]
[1 to 20 of 215 sentences]
|
2 |
![]()
Other miRNAs from this paper: hsa-mir-27a, hsa-mir-28, mmu-mir-144, hsa-mir-144, hsa-mir-153-1, hsa-mir-153-2, mmu-mir-27a, mmu-mir-28a, mmu-mir-28c, mmu-mir-28b
Taken together, our study demonstrated that i) Nrf-2 was a target gene of miR-153 in GSCs, ii) miR-153 was down-regulated in GSCs, which led to radioresistance through up-regulation of Nrf-2 and GPx1, and iii) miR-153 overexpression decreased radioresistance and stemness of GSCs in vitro and in vivo.
[score:11]
We found that miR-153 overexpression impaired the GSH system, increased ROS production, apoptosis and radiosensitivity, decreased neurosphere formation capacity and stem cell marker expression, and induced differentiation in GSCs by targeting Nrf-2. To identify the signaling pathways involved in miR-153 overexpression mediated differentiation of GSCs, we determined whether p38 MAPK signaling pathway was activated.
[score:9]
These results demonstrated that miR-153 overexpression would indirectly impair the GSH system in GSCs through targeting Nrf-2. Figure 4 A. Real-time RT-PCR analysis of miR-153 expression in GSCs.
[score:8]
These results demonstrated that miR-153 overexpression would indirectly impair the GSH system in GSCs through targeting Nrf-2. Figure 4 A. Real-time RT-PCR analysis of miR-153 expression in GSCs.
[score:8]
MiR-153 is thought to be one of the brain-enriched miRs, which play crucial roles not only in the development and function of the central nervous system (CNS), but also in the pathogenesis of CNS disease, such as Parkinson's disease (PD) and Alzheimer's disease (AD) [40, 41].
[score:8]
As miRs are believed to inversely control mRNA translation, miR-153 were selected as a candidate miR targeting Nrf-2 and we speculated that reduced miR-153 might lead to the enhanced Nrf-2 expression in GSCs.
[score:7]
Collectively, these data demonstrated that miR-153 expression was down-regulated in GSCs compared with that of non-GSCs glioma cells, which contributed to enhanced Nrf-2 expression resulting in activation of GPx1 transcription.
[score:7]
In this study, Nrf-2 was identified as a target gene of miR-153 in GSCs by bio-informatic analysis, real-time PCR, and luciferase reporter assay, so the downregulation of miR-153 contributed to the elevated Nrf-2 expression in GSCs, at least in part.
[score:7]
To investigate whether Nrf-2 overexpression could rescue stemness of GSCs with miR-153 overexpression, we detected the stem cell marker Bmi1 and differentiation marker GFAP expression by Western blot 48 h after Nrf-2 expression vectors transfection.
[score:7]
To investigate whether Nrf-2 overexpression could rescue stemness and radioresistance of GSCs with miR-153 overexpression, we detected the stem cell marker expression and examined radiosensitivity of GSCs 48 h after Nrf-2 expression vectors transfection.
[score:7]
Zhao et al. found that miR-153 was downregulated in CD133+ GSCs and miR-153 inhibited self-renewal ability of CD133+ GSCs and induced apoptosis [42].
[score:6]
MiR-153 overexpression suppressed Nrf-2 expression and Redox enzymes activity in GSCs.
[score:6]
As shown in Figure 8B, Nrf-2 overexpression also rescued the decreased neurosphere formation capacity of GSCs resulting from miR-153 overexpression.
[score:5]
Nrf-2 overexpression rescued the decreased stemness and radioresistance resulting from miR-153 overexpression in GSCs.
[score:5]
Our results showed that miR-153 overexpression increased phosphorylated p38 and ATF2 and downstream differentiation markers in GSCs and these effects were almost totally reversed by a free radical scavenger NAC, suggesting miR-153 overexpression inducing GSCs differentiation through ROS -mediated activation of p38 MAPK pathway.
[score:5]
The results indicated that Nrf-2 overexpression could rescue the decreased stemness and radioresistance resulting from miR-153 overexpression in GSCs.
[score:5]
These findings suggest that miR-153/Nrf-2/GPx1 pathway play a important role in regulating radiosensitivity and stemness of GSCs via ROS and targeting the miR-153/Nrf-2/GPx1 axis could be a novel approach in development of therapeutic strategies against glioma.
[score:5]
Nrf-2 overexpression rescued stemness and radioresistance of GSCs with miR-153 overexpression.
[score:5]
Our results showed that Nrf-2 was a target gene of miR-153 in GSCs and low level of miR-153 rescued Nrf-2 expression leading to activation of GPx1 transcription and decreased ROS level, which contributed to radioresistance of GSCs.
[score:5]
We employed lentiviral -mediated gene transfer technique to overexpress miR-153 in order to target Nrf-2 and analyzed phenotypic changes in GSCs.
[score:5]
These results indicated that Nrf-2 overexpression could rescue the decreased stemness resulting from miR-153 overexpression in GSCs.
[score:5]
As shown in Figure 3F, after miR-153 oligos were transfected into GSCs with the wild type reporter construct pGL3-Luc-Nrf-2, luciferase activity was significantly repressed compared with transfection of scramble oligos, whereas mutations in predicted target site of 3′-UTR of Nrf-2 gene abrogated the inhibition by miR-153 oligos.
[score:5]
These results indicated that Nrf-2 overexpression could rescue the decreased radioresistance resulting from miR-153 overexpression in GSCs.
[score:5]
To investigate whether Nrf-2 overexpression could rescue radioresistance of GSCs with miR-153 overexpression, we examined radiosensitivity by clonogenic assay 48 h after Nrf-2 expression vectors transfection.
[score:4]
MiR-153 is significantly down-regulated in glioma compared with normal brain tissues and decreases cell proliferation and increases apoptosis by targeting B cell lymphoma 2 (Bcl-2) and myeloid cell leukemia sequence 1 (Mcl-1) genes in glioma cell lines [23].
[score:4]
These results suggest that Nrf-2 is a direct and robust target gene of miR-153 in GSCs.
[score:4]
When 300 or 3, 000 cells were injected, the tumor incidence of GSCs with miR-153 overexpression decreased compared with that of GSCs expressing scramble sequence.
[score:4]
B. The percentage of GSCs with miR-153 overexpression forming neurospheres.
[score:3]
A. The diameters of neurospheres of GSCs with miR-153 overexpression plated at 100 cells per well in 96-well plates.
[score:3]
As shown in Figure 7A, miR-153 overexpression increased phosphorylated p38 and ATF2 and differentiation marker GFAP, and caused FoxO3 activation as evidenced by its accumulation in the nucleus.
[score:3]
These results indicated that miR-153 overexpression decreased stemness and induced differentiation through ROS -mediated activation of p38 MAPK in GSCs.
[score:3]
The in vivo data showed that miR-153 overexpression could reduce tumor-initiating potential of GSCs and increase survival in mice bearing human GSCs.
[score:3]
Figure 6 A. The diameters of neurospheres of GSCs with miR-153 overexpression plated at 100 cells per well in 96-well plates.
[score:3]
Thus, to identify the signaling pathways involved in miR-153 overexpression mediated differentiation of GSCs, we first determined whether p38 MAPK signaling pathway was activated.
[score:3]
C. Survival curves of GSCs/Lv-miR-153 transfected with Nrf-2 expression vectors.
[score:3]
After transfection with p-Nrf-2, the tumor incidence of GSCs with miR-153 overexpression increased.
[score:3]
The pivotal role of the microRNA-153/Nrf-2/GPx1 pathway in the control of radioresistance and stemness of GSCs demonstrated in this study suggested that the pathway might be a novel therapeutic target of GSCs.
[score:3]
Nevertheless, after transfection with p-Nrf-2, the median survival of mice injected with GSCs with miR-153 overexpression decreased.
[score:3]
B. The number of neurospheres per well of GSCs/Lv-miR-153 transfected with Nrf-2 expression vectors.
[score:3]
Figure 5 A. Flow cytometric analysis of ROS formation in GSCs with miR-153 overexpression after exposure to ionizing radiation.
[score:3]
These results indicated that miR-153 overexpression decreased the neurosphere formation capacity of GSCs.
[score:3]
These in vivo data indicated that miR-153 overexpression could reduce tumorigenic capacity of GSCs and increase survival in mouse mo dels of human glioma.
[score:3]
Moreover, N-acetylcysteine (NAC), which acts as a free radical scavenger by promoting intracellular biosynthesis of GSH, almost totally canceled the effect of p38 MAPK activation resulting from miR-153 overexpression.
[score:3]
Representative photomicrographs showed that miR-153 overexpression decreased CD133 and nestin immunostatining and increases GFAP and Tuj-1 immunostaining in both stem cell lines (Figure 6C, 6D).
[score:3]
C. Survival curves of GSCs with miR-153 overexpression.
[score:3]
E. A putative miR-153 target site in the wild type and mutated 3′UTR of Nrf-2. F. Relative luciferase activity in GSCs transfected with pGL3-Luc vector containing wild type and mutated 3′UTR of Nrf-2. * P < 0.01 vs cells transfected with scramble oligos.
[score:3]
To measure the effect of miR-153 overexpression on tumor formation, GSCs stably expressing miR-153 mature sequence or scramble sequence were intracranially implanted into immuno-compromised hosts.
[score:3]
Gliomas were not observed in brains of mice injected with miR-153 overexpression GSCs irradiated by 8 Gy X-ray (Figure 9C).
[score:3]
Moreover, miR-153 overexpression resulted in a slightly higher OER in GSCs.
[score:3]
To experimentally determine whether miR-153 directly targets Nrf-2 by binding to its 3′ UTR sequence (Figure 3E), we employed luciferase reporter assays.
[score:3]
A. Flow cytometric analysis of ROS formation in GSCs with miR-153 overexpression after exposure to ionizing radiation.
[score:3]
Meanwhile, the stem cell markers, Bmi1 and nestin, were decreased in GSCs with miR-153 overexpression.
[score:3]
B. Flow cytometric analysis of ROS formation in GSCs with miR-153 overexpression in the presence and absence of an antioxidant N-acetylcysteine (NAC).
[score:3]
The target GSCs were infected with viruses encoding either miR-153 or scramble sequence and selected using puromycin.
[score:3]
It is clear that GSCs with miR-153 overexpression were more radiosensitive than GSCs with stable integration of scramble sequence under normoxia or hypoxic conditions.
[score:3]
A. Real-time RT-PCR analysis of miR-153 expression in GSCs.
[score:3]
As shown in Figure 7B, miR-153 overexpression increased ROS formation in GSCs, which was abrogated in the presence of NAC.
[score:3]
As a result, the GSH/GSSG ratio, an indicator of the cellular health, was significantly lower in GSCs with miR-153 overexpression.
[score:3]
For all cell numbers transplanted, the median survival of mice injected with GSCs was increased with miR-153 overexpression.
[score:3]
These results indicated that miR-153 overexpression decreased stemness and induced differentiation in GSCs.
[score:3]
The 3′UTR of Nrf-2 gene contains a putative miR-153-target site: 5′-CTTTATAAGTAATTCTA TGCAA-3′.
[score:3]
ROS generation was significantly increased in GSCs with miR-153 overexpression, whereas ROS generation in GSCs with stable integration of scramble sequence showed no obvious change 1 h after 8 Gy X-ray irradiation, as shown in Figure 5A.
[score:3]
As shown in Figure 4D, GSH was significantly decreased, while GSSG was significantly increased in GSCs with miR-153 overexpression.
[score:3]
We used lentiviral transduction to overexpress miR-153 (Figure 4A) and evaluate its effects in GPx1 expression and activity in GSCs.
[score:3]
In addition, miR-153 overexpression reduced tumorigenic capacity of GSCs and increased survival in mice bearing human GSCs.
[score:3]
Kaplan-Meier curves further demonstrate significant increases in survival with introduction of miR-153 overexpression and/or 8 Gy X-ray irradiation (Figure 9B).
[score:3]
The apoptosis of GSCs induced by miR-153 even in the absence of radiation might result from targeting B cell lymphoma 2 (Bcl-2) and myeloid cell leukemia sequence 1 (Mcl-1) genes, which has been reported by previous study [23].
[score:3]
Moreover, we found that miR-153 overexpression resulted in radiosensitization of GSCs as well as decreased stemness and increased differentiation through ROS -mediated activation of p38 MAPK in GSCs.
[score:3]
For initial experiments, we performed an in vivo limiting dilution assay with GSCs stably expressing miR-153 mature sequence or scramble sequence.
[score:2]
MiR-153 overexpression activated p38 MAPK signaling pathway via ROS in GSCs.
[score:2]
MiR-153 overexpression decreased stemness and induced differentiation through ROS -mediated activation of p38 MAPK in GSCs.
[score:2]
MiR-153 overexpression increased ROS production, apoptosis and radiosensitivity of GSCs.
[score:2]
MiR-153 overexpression decreased the neurosphere formation capacity and stemness of GSCs.
[score:2]
MiR-153 overexpression decreased stemness and induced differentiation in GSCs.
[score:2]
MiR-153 overexpression increased ROS production, apoptosis and radiosensitivity in GSCs.
[score:2]
As shown in Figure 4B, Nrf-2 and GPx1 protein expression were significantly decreased in GSCs with stable integration of miR-153 compared with that of control cells.
[score:2]
MiR-153 overexpression reduces tumorigenic capacity of GSCs.
[score:2]
Our results thus far determined an important role for miR-153 in GSC stemness, survival, and radioresistance in vitro, but the ultimate goal of any cancer stem cell–directed therapy is to provide therapeutic benefit in vivo.
[score:2]
Our results showed that the average apoptotic rate of GSCs with miR-153 overexpression irradiated by 0 or 5 Gy X-ray were significantly increased compared with those of control cells (Figure 5B).
[score:2]
To generate the respective viruses, 293T cells were transfected with the lentiviral vector, pGLV-miR-153-GFP or pGLV-scr-GFP, and the packaging plasmid PG-P1-VSVG, PG-P2-REV and PG-P3-RRE according to standard protocols.
[score:1]
For intracranial implantation, 36 h after irradiation with 8 Gy X-ray, GSCs/Lv-scr, GSCs/Lv-miR-153 and GSCs/Lv-miR-153+p-Nrf-2 cells were counted and the indicated numbers of GSCs were implanted into the right frontal lobes of 6–8-week-old female athymic nude mice (Experimental Animals Center of Shanghai Institute of Life Science, Shanghai, China).
[score:1]
GSCs with stable integration of the miR-153 mature sequence or scramble sequence were generated through lentiviral -mediated gene transfer [48].
[score:1]
Twenty four hours later, 20 nM of miR-153 oligos (5′-UUGCAUAGUCACAAAAGUGAUC-3′) or scramble oligos (5′-UUCUC CGAACGUGUCACGUTT-3′) (GenePharma Co.
[score:1]
[#] P < 0.01 vs miR-153.
[score:1]
However, little is known about the molecular mechanisms of miR-153 functions in GSCs.
[score:1]
Cells with stable integration of miR-153 were plated 24 h prior to transfection.
[score:1]
We therefore evaluated the ability of miR-153 overexpression to increase the survival of immuno-compromised mice bearing intracranially implanted human GSCs.
[score:1]
[1 to 20 of 87 sentences]
|
3 |
![]()
Other miRNAs from this paper: mmu-mir-135a-1, mmu-mir-138-2, mmu-mir-203, mmu-mir-298, mmu-mir-21a, mmu-mir-31, mmu-mir-346, mmu-mir-223, mmu-mir-135a-2, mmu-mir-138-1, mmu-mir-410, mmu-mir-376b, mmu-mir-3085, mmu-mir-21b, mmu-mir-21c
Exogenously introduced miR-153 caused significant upregulation and downregulation of these associated miRNA regulators (Fig. 3b,c), and the expression of many of these miRNAs responded to the addition of EMD into the medium of cultured enamel cells in the form of statistically significant downregulation (Fig. 6a,b).
[score:13]
In miR-153 transfected ALCs compared with negative control siRNA transfected ALCs, the expression of miR-3085 and miR-346 was upregulated, while the expression of miR-298, miR-135a, miR-376b and miR-203 was downregulated.
[score:10]
Specifically, in miR-153 transfected ALCs, the expression of miR-3085 and miR-346 was upregulated compared with negative control siRNA, while the expression of miR-298, miR-135a, miR-376b and miR-203 was downregulated (P < 0.05) (Fig. 3b and).
[score:10]
In our current study, miR-153 overloading impaired the ability of enamel cells to intake extracellular EMPs (Figs 6 and 7), which was achieved, at-least in part, by suppressing the expression of target genes— Lamp1, Cltc, Clcn4 and Slc4a4 (Figs 3, 4, 5).
[score:7]
The expression of miR-153 is significantly downregulated during maturation-stage amelogenesis.
[score:6]
Based on the previous findings, the expression of miR-153 is significantly downregulated at maturation-stage amelogenesis compared with secretory-stage (Fig. 1).
[score:5]
MiR-153 targets endocytosis and lysosomal digestion by regulating the expression of Cltc, Lamp1, Clcn4 and Slc4a4.
[score:5]
Baseline expression of miR-153 in ALCs and LS8 cells and MiR-153 induced changes in miRNA and mRNA expression by real-time PCR.
[score:5]
The remaining gene expression targets showed no significant changes in response to miR-153 transfection in either cell mo del.
[score:5]
The expression of miR-153 was significantly downregulated at maturation stage compared with secretory stage (* P = 0.002).
[score:5]
In ALCs, the expression of Stam was downregulated in miR-153 transfection group compared with mock transfection group.
[score:5]
The expression of miR-153 could not be detected in either cell mo del, which was in sharp contrast with the exceptionally high level of expression of miR-21 (Fig. 3a).
[score:5]
Among all the gene targets, Clcn4, Cltc, Lamp1 and Slc4a4 exhibited significantly decreased expression in ALCs and LS8 cells transfected by miR-153 (P < 0.05) (Fig. 3d,e and).
[score:5]
The expression of the remaining gene targets did not show any changes in response to miR-153 transfection in either cell mo del.
[score:5]
Data in the present study indicate that miR-153 is actively involved in ameloblast -mediated endocytotic and endosomal/lysosomal pathways by directly targeting the key genes.
[score:4]
In the cell culture assays reported above, the intrinsic expression of Cltc, Clcn4, Slc4a4 and Lamp1 within ALCs and LS8 cells was suppressed by exogenously introduced miR-153 mimics at both mRNA and protein levels (Fig. 3b–e and).
[score:4]
For each verification assay, two experimental groups were set up: 1) LS8 cells co -transfected by miR-153 mimics and luciferase reporter vector (3′-UTR of target gene), 2) LS8 cells transfected by luciferase reporter vector (3′-UTR of target gene).
[score:4]
Selection strategies for miR-153 regulated gene targets.
[score:4]
Cltc, Clcn4 and Slc4a4 are validated gene targets subject to miR-153 regulation.
[score:4]
At protein level, intracellular overloading of miR-153 caused statistically significant downregulation of Clcn4 (a1, a2), Lamp1 (b1, b2), Cltc (c1, c2) and Slc4a4 (d1, d2), which corresponded well with the results from real-time PCR analysis at mRNA level.
[score:4]
In LS8 cells, the increased intracellular level of miR-153 induced similar directional changes (as in ALCs) in the expression of miR-3085, miR-298, miR-135a and miR-376b.
[score:4]
At the protein level, intracellular overloading of miR-153 caused statistically significant downregulation of Clcn4, Lamp1, Cltc and Slc4a4 (P < 0.05) (Fig. 4).
[score:4]
Commercially available LNA-DIG miRNA probes detected the expression patterns of miR-153 in presecretory-, secretory- and maturation-stage mouse enamel organs (Fig. 1a–e′).
[score:3]
In LS8 cells, intracellular overloading of miR-153 induced similar changes in the expression of miR-3085, miR-298, miR-135a and miR-376b as those in ALCs.
[score:3]
In the present study, we conducted both in vitro and in vivo functional studies and confirmed the involvement of miR-153 in the endocytosis and endosomal/lysosomal pathways by studying predicted miR-153 target genes.
[score:3]
Rab11fip2 in miR-153 transfected LS8 cells showed increased expression.
[score:3]
Note that miR-153 failed to trigger any changes in the mRNA-level expression of Lamp5, which was barely detectable in either cell mo del (Fig. 3d,e and).
[score:3]
In addition there were statistically significant differences in the expression of miR-138 and miR-346 in LS8 cells transfected by miR-153 and by negative control siRNA (P < 0.05) (Fig. 3c and).
[score:3]
There were statistically significant differences in the expression of miR-138 and miR-346 in LS8 cells transfected by miR-153 and by negative control siRNA.
[score:3]
Using total RNA samples isolated from secretory-stage (PN6) and maturation-stage (PN9) mouse mandibular molars, the relative expression levels of miR-153 were quantified by real-time PCR analysis.
[score:3]
Because the sample size in analysis was relatively small, the Mann-Whitney U test was selected to detect the potential differences in protein-level gene expression due to miR-153 overloading both in vitro and in vivo (α = 0.05, SPSS 22.0).
[score:3]
In situ hybridization analysis of miR-153 expressionFor miR-153 in situ hybridization, mandibles were dissected from PN6 and PN9 BALB/c mice, and the surrounding soft tissues were partially retained in order to keep the integrity of the mandibles.
[score:3]
At mRNA level, the expression changes caused by miR-153 overloading were more consistent between the two cell mo dels.
[score:3]
For the target prediction of miR-153, we combined the three algorithms integrated in Ingenuity Pathway Analysis (IPA, Ingenuity System, Redwood City, CA).
[score:3]
The expression levels of miR-153 in secretory- and maturation-stage enamel organs were calculated relative to the expression level of RNU6-2 as recommended by the manufacturer.
[score:3]
Although we used a relatively thorough searching strategy when screening the gene targets for miR-153, it is possible that there was a substantial false negative rate, which could be partially attributed to the limitations of available prediction algorithms.
[score:3]
This suggests that miR-153 overexpression at maturation-stage amelogenesis is a candidate etiologic factor in the occurrence of AI.
[score:3]
Intracellular miR-153 overloading induces changes in gene expression at miRNA, mRNA and protein levels.
[score:3]
In situ hybridization analysis of miR-153 expression.
[score:3]
The changes in miRNA and mRNA expression levels induced by miR-153 overloading were determined by comparing the miR-153 transfection group with a mock transfection group (transfected by AllStars Negative Control siRNA).
[score:3]
Clcn4, Lamp1, Cltc and Slc4a4 exhibited significantly decreased expression in ALCs and LS8 cells transfected by miR-153.
[score:3]
How to cite this article: Yin, K. et al. MiR-153 Regulates Amelogenesis by Targeting Endocytotic and Endosomal/lysosomal Pathways–Novel Insight into the Origins of Enamel Pathologies.
[score:3]
, MA, USA) were used to detect miR-153 expression in enamel organs overlying mandibular first molars and incisors.
[score:3]
In the previous genome-wide miRNA and mRNA transcriptome analyses, miR-153 was identified as one of the differentially expressed miRNAs during amelogenesis in rats 11.
[score:3]
Relative expression of miR-153 by real-time PCR using total RNAs isolated from secretory- and maturation-stage mandibular first molars of four animals (n = 4; panel f).
[score:3]
s were engaged to verify the predicted interaction between miR-153 and the 3′-UTR of its target genes.
[score:3]
**Marks the signals from positive control (a– e) and miR-153 expression (a′– e′).
[score:3]
Similar data analysis strategies compared the baseline expression of miRNAs between ALCs and LS8 cells, and detected the changes in the cellular levels of miRNA and mRNA induced by miR-153 transient transfection.
[score:2]
The two-tailed Student’s t-test compared the difference in gene expression between the groups of miR-153 transfection and mock transfection.
[score:2]
MiRNA expression changes caused by enamel matrix protein (EMD) exposure and EMD intake assay in presence of miR-153 overloading.
[score:2]
Because the interaction between the 3′-UTR of Lamp1 and miR-153 was validated by luciferase reporter assay in previous studies 11, three dual luciferase reporter vectors containing the 3′ UTR of mouse -specific target genes (Cltc, Clcn4 and Slc4a4) were purchased from Genecopoeia (Catalog # MmiT073292-Cltc, MmiT023599-Clcn4, MmiT0301678-Slc4a4).
[score:2]
Luciferase reporter assay verifying the predicted interaction between miR-153 and target genes.
[score:2]
Collectively, these data suggest that there were direct interactions between the seeding sequences of miR-153 and the 3′-UTRs of Cltc, Clcn4 and Slc4a4.
[score:2]
MiR-153 expression by in situ hybridization is shown in panels a′–e′.
[score:2]
Luciferase reporter assays were engaged to verify the predicted interaction between miR-153 and the 3′-UTR of its target genes.
[score:2]
MiR-153 induced changes in gene expression at protein level by western blot.
[score:2]
analysis detected the protein-level changes of the target genes following miR-153 transfection, and the amount of remaining amelogenin in the mandibular first molar germ in microinjection assay.
[score:2]
Compared with secretory stage, miR-153 showed significantly decreased expression in maturation-stage enamel (P = 0.002, n = 4) (Fig. 1f); the fold change was approximately -3.8 (maturation/secretory, Fig. 1g).
[score:2]
In addition, miR-153 is not the only miRNA regulator significantly enriched in the endocytotic and endosomal/lysosomal functional categories 11.
[score:2]
In the significantly enriched functional categories, such as those labeled with ‘endosome membrane’ or ‘lysosomal lumen’, miR-153 together with miR-3085, miR-298, miR-138, miR-135a, miR376b, miR-203 and miR-346 were predicted to be epigenetic regulators involved in endocytosis and endosomal/lysosomal pathways 11.
[score:2]
Based on the results from real-time PCR and western blot following the miR-153 transfection assay, the potential targets of miR-153 were narrowed down to four genes– Lamp1, Cltc, Clcn4 and Slc4a4.
[score:2]
Similar effects of miR-153 were observed in animals receiving either the 100 pmol and 50 pmol microinjection, while 10 pmol had no apparent impact on enamel development.
[score:2]
Schematic diagram for miR-153 regulated endocytotic and endosomal/lysosomal pathways.
[score:2]
Western blot analysis detected the protein-level changes of the target genes following miR-153 transfection, and the amount of remaining amelogenin in the mandibular first molar germ in microinjection assay.
[score:2]
The more common predicted interaction (miR-153 with “a” fragment) was provided in Fig. 1, and the information about “b” fragment was not disclosed by the manufacturer.
[score:1]
In situ hybridization of miR-153 exhibited significantly higher signal intensities in presecretory- and secretory-stage enamel organs than in maturation-stage (Fig. 1a′–e′).
[score:1]
There were two objectives of this experiment one was to evaluate the effect of miR-153 overloading on other miRNAs expressions after EMD exposure, and the second was to semi-quantify the effect of miR-153 overloading on EMD uptake.
[score:1]
Following 6 h of exposure to EMD, RNA samples were isolated from cells transfected with miR-153 mimics and negative control siRNA for real-time PCR analysis of endocytosis-related miRNAs.
[score:1]
Statistically significant differences were detected between miR-153 microinjection group (miR-153) and PBS control group (Control for miR-153), and between scrambled siRNA microinjection group (Scramble) and corresponding PBS control group (Control for scramble).
[score:1]
The differences in luciferase reporter activities from Slc4a4 vectors between miR-153 transfection group and mock transfection group were also found to be statistically significant (“a” fragment: ~60% decrease, P = 0.048; “b” fragment: ~46% decrease, P = 0.046) (Fig. 5e,f).
[score:1]
The differences in luciferase reporter activities from Slc4a4 vectors (e, f) between miR-153 transfection group and mock transfection group were also statistically significant (a fragment: ~60% decrease in luciferase activity; b fragment: ~46% decrease in luciferase activity).
[score:1]
In the first part of the assay to examine changes in the expression of selected miRNAs, for each type of cell, the assay was conducted in two groups with each group taking up 3 wells: (1) miR-153 mimics transfection, (2) mock transfection with AllStars Negative Control siRNA.
[score:1]
The final concentrations tested for miR-153 and negative control siRNA are 20 pM, 60 pM and 120 pM.
[score:1]
To be more specific, exogenously introduced miR-153 caused an average of ~44% decrease in relative surface enamel density.
[score:1]
Local microinjection of miR-153 leads to hypomineralization of tooth enamel.
[score:1]
The vectors pertinent to Slc4a4 came in two tubes containing an “a” and “b” fragments of 3′-UTRs, which corresponded with two different predicted interaction regions with miR-153.
[score:1]
The average fold change of miR-153 was ~−3.8 (maturation/secretory; panel g).
[score:1]
Microinjection of miR-153 mimics.
[score:1]
Positive control (Pos): no cells were seeded and EMD stock solution (2 mg/μl) was diluted to 500 μg/ml with FBS free culture medium; Negative control (Neg): enamel cells were seeded with no EMD treatment; MiR-153 transfection (miR): cells were transfected with miR-153 mimics and received treatment of EMD at 500 μg/ml for 6 h; Mock transfection with scrambled siRNA (Scrambled): cells were transfected with scrambled siRNAs and were exposed to 500 μg/ml EMD in the culture medium for 6 h. (d) 20 kD band densities were quantified relative to cell-free Positive control group.
[score:1]
In order to identify that ALCs and LS8 cells are suitable mo dels for investigating the functional role of miR-153, the baseline expression of miR-153 (along with miR-31, miR-21, miR-223, miR-410, miR-3085, miR-298, miR-135a, miR-138, miR376b, miR-203 and miR-346) was quantified by real-time PCR.
[score:1]
Protein samples from miR-153 mimics and negative control siRNA transfected cells were obtained 48 h after transfection.
[score:1]
For the data presented, the concentration of miR-153 mimics and scrambled siRNA was 100 pmol.
[score:1]
For miR-153 in situ hybridization, mandibles were dissected from PN6 and PN9 BALB/c mice, and the surrounding soft tissues were partially retained in order to keep the integrity of the mandibles.
[score:1]
For in vitro functional studies, ALCs and LS8 cells were used as hosts for miR-153.
[score:1]
Three concentrations of miR-153 were used; 10 pmol, 50 pmol and 100 pmol.
[score:1]
The miR-153 signals developed from presecretory- and secretory-stage enamel organ (a′, c′, d′) were higher than those from maturation-stage enamel organ (b′, e′).
[score:1]
As a result, we set PN8, at which the enamel organ of mouse mandibular first molar germs is generally at the end of secretory-stage amelogenesis, as the time point for the single microinjection of miR-153 mimics, and we sacrificed the animals at the end of maturation stage (PN12).
[score:1]
Based on the present study, miR-153 overloading during enamel maturation induces significant hypomineralization—AI-like signs–in affected animal teeth (Fig. 7).
[score:1]
Despite the enamel density difference seen by μCT analyses, and the retained amelogenin protein seen in the same miR-153 treated mandibular molars, the morphology of the enamel organs overlying the mandibular first molars did not seem to be significantly influenced by miR-153/scrambled siRNA microinjection as observed through H&E staining of the PN12 mandibles (Supplementary Fig. 3).
[score:1]
By merging all the functional categories related to endocytotic and endosomal/lysosomal pathways, and arbitrarily setting a fold-change threshold at 3.0, the Clcn4, Clcn5, Cltc, Ehd3, Lamp1, Lamp5, Rab7, Rab11fip2, Slc4a4, Slc26a7, Stam and Vps37a genes were established as potential targets of miR-153 for further investigation.
[score:1]
The location of microinjection (miR-153 mimics and negative control siRNAs, 10 μl per injection) was the right mandibular first molar germ area; the left side was injected with PBS as a control.
[score:1]
For quantification of miRNA and mRNA levels following miR-153 transfection, ALCs and LS8 cells were collected 24 h after transfection.
[score:1]
Supplementary Figure 1. Supplementary Figure 2. Supplementary Figure 3. Supplementary Table 1. Supplementary Table 2. Supplementary Table 3. In situ hybridization and real-time PCR analysis of miR-153.
[score:1]
MiR-153 mimics and negative control siRNA (Catalog # MSY0000163-miR-153 mimic, SI03650318-AllStars Negative Control siRNA, Qiagen) were mixed separately into diluted transfection reagents to form transfection complex.
[score:1]
As a result, the current study sought to investigate the miR-153-regulated endocytosis and endosomal/lysosomal pathways, and is a reasonable continuation of our previous effort to advance knowledge about miRNA-centered regulation during enamel maturation.
[score:1]
The differences in the relative densities between the positive control group and the miR-153 transfection group, and between the miR-153 transfection and mock transfection groups were detected by the Mann-Whitney U test (α = 0.05, SPSS 22.0).
[score:1]
In summary, this data shows that at-least in ALC cells miR-153 overloading results in a decrease in endocytotic activity.
[score:1]
The potential differences in the relative expression values of miR-153 between secretory and maturation stages were evaluated by two-tailed Student’s t-test (α = 0.05, SPSS 22.0).
[score:1]
At PN8, each litter of wild-type BALB/c animals was randomly divided into two equal groups: (1) miR-153—animals were injected with miR-153 mimics, and (2) Negative control—animals were injected with AllStars Negative Control siRNAs.
[score:1]
Intracellular miR-153 overloading was created by transiently transfecting ALCs and LS8 cells with miR-153 mimics.
[score:1]
In the real-time PCR analysis of miR-153 expression level in enamel organs, the raw Ct values of miR-153 were normalized by those of RNU6-2. Fold changes (maturation/secretory) were calculated using the regular ΔΔCt method.
[score:1]
Animal-grade (in vivo application) miR-153 mimics (Qiagen; Catalog # MSY0000163) were dissolved into PBS (pH 7.4) (Thermo Fisher Scientific; Catalog # 10010023) to prepare final doses of 10 pmol, 50 pmol and 100 pmol.
[score:1]
LS8 cells were the hosts for miR-153 mimics and luciferase reporter vectors.
[score:1]
[1 to 20 of 103 sentences]
|
4 |
![]()
Other miRNAs from this paper: hsa-mir-153-1, hsa-mir-153-2
The results above suggest that Rictor is a target gene of miR-153, and overexpression of miR-153 will lead to Rictor downregulation and p-Akt Ser473 inhibition in glioma cells.
[score:10]
Our results suggest that miR-153 downregulation could be the reason of Rictor upregulation and mTORC2 over-activation in human glioma cells.
[score:7]
In human glioma tissues and cells, miR-153 downregulation was negatively correlated with Rictor upregulation and mTORC2 (p-Akt Ser473) over-activation.
[score:7]
3.1. miR-153 downregulation correlates with Rictor upregulation in multiple human glioma tissues and cell lines.
[score:7]
We next wanted to know if miR-153 downregulation was the reason of Rictor upregulation in glioma cells.
[score:7]
These results indicated that miR-153 downregulation could be the reason of Rictor upregulation and mTORC2 over-activation in glioma cells.
[score:7]
Together, we showed that miR-153 downregulation could be the reason of Rictor upregulation and mTORC2 over-activation in glioma cells.
[score:7]
Note that miR-153 downregulation and Rictor upregulation were most dramatic in U87MG cells and U373MG cells (Fig 1E–1G), these two cell lines were chosen for further studies.
[score:7]
Importantly, exogenous overexpression of miR-153 downregulated Rictor and decreased p-Akt Ser473 in glioma cells.
[score:6]
Real-time PCR results confirmed miR-153 upregulation (Fig 5E) and Rictor mRNA depletion (Fig 5F) in miR-153 -expressing tumors (at Week-5, n = 3 for each).
[score:6]
miR-153 expression clearly downregulated Rictor mRNA in U87MG cells (Fig 2B).
[score:6]
Thus far, we have shown that miR-153 downregulated Rictor and inhibited glioma cell growth in vitro.
[score:6]
These results indicate that miR-153 over -expression -mediated anti-glioma cell activity is likely mediated via downregulating Rictor.
[score:6]
Overexpression of miR-153 -induced anti-glioma cell activity is possibly via downregulating Rictor.
[score:6]
Importantly, our in vivo studies showed that miR-153 downregulated Rictor/p-Akt Ser473, and potently inhibited U87MG tumor growth in nude mice.
[score:6]
Meanwhile, significant growth inhibition and apoptosis activation were observed in the miR-153 -expressing glioma cells.
[score:5]
First, we show that microRNA-153 (miR-153) selectively targets the 3’ untranslated regions (UTRs) of Rictor mRNA (Fig 1A).
[score:5]
First, MTT results in Fig 3A and 3B showed that miR-153 overexpression significantly inhibited growth of U87MG and U373MG cells.
[score:5]
Fig 5A showed that the average volume of miR-153 -expressing U87MG tumors was much smaller than that of the miR-C -expressing U87MG tumors.
[score:5]
3.3. miR-153 overexpression inhibits glioma cell growth, and activates cell apoptosis.
[score:5]
These results showed that cells with Rictor shRNA showed similar phenotypes (growth inhibition and apoptosis activation) as cells with miR-153 overexpression.
[score:5]
Together, these results demonstrated that miR-153 over -expression inhibited U87MG tumor growth in vivo.
[score:5]
Recent evidences have indicated that miR-153 was dramatically downregulated in several cancer cells [31, 32].
[score:4]
3.4. miR-153 -induced anti-glioma cell activity is mediated via downregulating Rictor.
[score:4]
Since Rictor upregulation and mTORC2 over-activation are important for glioma cell growth and apoptosis-resistance [15], we then tested the potential role of miR-153 on glioma cell functions.
[score:4]
Further, miR-153 -induced anti-glioma cell activity is possibly through downregulating Rictor.
[score:4]
Meanwhile, the number of U87MG/U373MG colonies was decreased sharply after forced miR-153 expression (Fig 3C and 3D).
[score:3]
We also analyzed expression of miR-153 and Rictor in the U87MG tumors.
[score:3]
Real-time PCR results demonstrated that miR-153 level was dramatically downregulated in glioma tissues (“Glioma”), as compared to its level in the surrounding normal brain tissues (“Normal”) (Fig 1B).
[score:3]
Intriguingly, in Rictor-silenced glioma cells, miR-153 expression failed to further decrease cell growth or increase cell apoptosis.
[score:3]
pre-miR-153 construct was introduced into U87MG cells to establish miR-153 -expressing cell line (See Methods).
[score:3]
miR-153 was first discovered as one of the several brain-specific miRNAs, based on analysis of expression profile of over one hundred miRNAs in adult organs [30].
[score:3]
Expressions of miR-153 (B), Rictor mRNA (C) as well as Rictor protein (D, vs.
[score:3]
These results indicated that miR-153 overexpression exerted anti-growth and pro-apoptosis activity against glioma cells.
[score:3]
When analyzing cell apoptosis, we detected a clear apoptosis activation in miR-153 -expressing U87MG cells (Fig 3E) and U373MG cells (Fig 3F).
[score:3]
Next, we tested miR-153 and Rictor expressions in human glioma cells.
[score:3]
These results [31, 32] have implied that miR-153 could be a tumor suppressor.
[score:3]
Rictor is a target of miR-153 in glioma cells.
[score:3]
One key finding of this study is that Rictor might be a key target gene of miR-153 in glioma cells.
[score:3]
To test this hypothesis, we again overexpressed miR-153 in Rictor-silenced U87MG cells (Fig 4G).
[score:3]
Expressions of miR-153 (E), Rictor mRNA (F) as well as Rictor protein (G) and p-Akt (G) in primary human astrocytes (“Astrocytes”) and established glioma cell lines (T98G,U373MG, U251MG and U87MG) were shown.
[score:3]
Stable U87MG cells (2 × 10 [6] cells per mouse) expressing miR-153 or miR-C were s. c. injected into the nude mice, and xenografted tumors were established.
[score:3]
Indeed, forced expression of miR-153 failed to further affect U87MG cell growth (Fig 4G) or apoptosis (Fig 4I) in these cells.
[score:3]
Tian [24]) to generate miR-153 expression construct.
[score:3]
Further, in grade IV (GBM multiforme) human gliomas, miR-153 expression appeared to be depleted [31, 32].
[score:3]
Real-time PCR results in Fig 2A confirmed miR-153 overexpression in the stable U87MG cells.
[score:3]
If Rictor is the main target of miR-153 in glioma cells, miR-153’s activity against glioma cells should be diminished in Rictor-silenced cells.
[score:3]
2.10. miR-153 overexpression.
[score:3]
Therefore, Rictor should be the primary target of miR-153 in mediating its anti-glioma cell activity.
[score:3]
miR-153 -expressing U87MG cells (“miR-153”) or miR-C -expressing U87MG cells (“miR-C”) were inoculated into the nude mice (13 mice per group), tumor volumes (A) and mice body weights (D) were recorded weekly; Estimated daily tumor growth was calculated (B); Mice survival at week-7 was also presented (C, summarizing of three-set repeats).
[score:3]
Stable U87MG cells expressing miR-153, microRNA-control (“miR-C”) or empty vector (“pSuper-puro”) were subjected to real-time PCR assay of miR-153 (A) and Rictor mRNA (B).
[score:2]
Rictor shRNA -expressing stable U87MG cells were transfected with miR-153 or microRNA-control (“miR-C”), miR-153 expression (G, Real-time PCR assay), cell growth (E, MTT assay) and apoptosis (F, Histone DNA ELISA assay) in these cells were tested.
[score:2]
Relative Rictor mRNA (A) and miRNA-153 (C) expression in stable U87MG cells with scramble control shRNA (“shRNA-C”) or Rictor shRNA (“shRNA-Rictor”) was tested by Real-time PCR assay.
[score:2]
At week-5, three xenografted U87MG tumors per group were isolated, miR-153 (E) and Rictor mRNA (F) expressions in the fresh tissues were tested by real-time PCR assay; Bars stand for mean ± SD.
[score:2]
miR-153 expression in the stable cells was tested by real-time PCR assay.
[score:2]
At week-7, the mice bearing miR-153 U87MG tumors were all alive, but the majority of mice with miR-C tumors were already dead (Fig 5C).
[score:1]
0156915.g005 Fig 5The anti-glioma activity by miR-153 in vivo.
[score:1]
For transfection, glioma cells were seeded onto 6-well plates at 50–60% confluence, which were then transfected with miR-153 construct (0.25 μg/ml) via Lipofectamine 2000 reagents (Invitrogen, Shanghai, China).
[score:1]
In the current study, we identified a potential anti-Rictor miRNA: microRNA-153 (miR-153).
[score:1]
Stable U87MG cells bearing miR-153 or miR-C were subcutaneously (s. c. ) injected into the right flanks of 4-week-old female nude mice (each mouse: 2 × 10 [6] cells in 200 µl of Matrigel).
[score:1]
Finally, we tested miR-153’s activity on glioma cell growth in vivo.
[score:1]
The anti-glioma activity by miR-153 in vivo.
[score:1]
The level of miR-153 was obviously not affected by Rictor shRNA (Fig 4C).
[score:1]
The anti-glioma activity by miR-153 in vivoFinally, we tested miR-153’s activity on glioma cell growth in vivo.
[score:1]
Pre-miR-153 (see sequence in [23]) was sub-cloned into pSuper-puromycin vector (a gift from Dr.
[score:1]
Average daily tumor growth results further confirmed the anti-glioma activity by miR-153 in vivo (Fig 5B).
[score:1]
miR-153 (-3p) and its putative binding sequence in the 3’-UTR of Rictor mRNA (A).
[score:1]
[1 to 20 of 67 sentences]
|
5 |
![]()
miR-153 directly inhibits IDO1 expression by targeting its 3′ untranslated region in colon cancer cells; yet, miR-153 overexpression does not affect cancer cell survival, apoptosis, and colony formation.
[score:12]
Nonetheless, CAR T cells expressing this CAR transgene demonstrate stronger tumoricidal activity toward WT EGFR -expressing colon cancer cells with miR-153 overexpression than they do toward the cells without miR-153 overexpression.
[score:9]
It is notable that overexpression of miR-153 downregulated IDO1 expression about 50% in HCT-116 and DLD-1 cells (Fig. 2c), which did not affect cell proliferation, cell migration, and colony formation of these cells (Fig. 3).
[score:8]
miR-153, a reported tumor-suppressive miRNA [12], downregulated the expression of IDO1 in colon cancer cells.
[score:8]
Our findings indicate that miR-153 inhibits IDO1 expression in colon cancer cells and is a tumor-suppressive miRNA that enhances CAR T cell immunotherapy.
[score:7]
When colon cancer cells are targeted by CAR T cells, miR-153 overexpression within tumor cells significantly enhances T cell killing in vitro and suppresses xenograft tumor growth in mice.
[score:7]
According to the computational program TargetScan version 7.1, which predicts biological targets of miRNAs by searching for the presence of conserved sites that match the seed region of each miRNA [18], the human IDO1 gene is putatively targeted by miR-153 and other 9 miRNAs (Additional file 3: Figure S3A).
[score:7]
These findings indicate that miR-153 inhibits IDO1 expression in colon cancer cells and is a tumor-suppressive miRNA that enhances CAR T cell immunotherapy.
[score:7]
We found only miR-153 downregulated luc2 expression in both 293 T and Hela cell lines (Additional file 3: Figure S3B and Fig. 2a).
[score:6]
miR-153 downregulates IDO1 expression.
[score:6]
We analyze IDO1 downregulation by miR-153 in colon cancer cells and the association of IDO1 and miR-153 expression with colorectal patient survival.
[score:6]
d Immunofluorescence analyses of IDO1 protein expression (red) in DLD-1 cells expressing miR-153.
[score:5]
A stable DLD-1 cell line overexpressing luciferase (DLD-1-luc) was transduced by a lentivirus carrying an expression cassette for miR-153, resulting in the DLD-1 + miR-153 line.
[score:5]
Strikingly, CAR T cells carrying a scFv targeting EGFR displayed significantly higher cytotoxic activities against colon cancer cells overexpressing miR-153 than the control.
[score:5]
a miR-153 inhibits reporter expression.
[score:5]
When tested in immunodeficient mice, we show that CAR T cells completely eliminate colon cancer cells with miR-153 overexpression, but are only partially effective against colon cancer cells without miR-153 overexpression.
[score:5]
e Flow cytometry analyses of IDO1 expression in monocyte-derived dendritic cells with miR-153 overexpression.
[score:5]
Our data demonstrate that overexpression of miR-153 and subsequent IDO1 inhibition do not alter cell proliferation and other cellular processes in colon cancer cells.
[score:5]
The expression of miR-153 is inversely correlated with IDO1 expression in colon tumors.
[score:5]
These results imply that moderate downregulation of IDO1 by miR-153, but not elimination of IDO1, has little effect on colon cancer cells.
[score:4]
When the miR-153 binding site in the IDO1 3’UTR was mutated, the reporter downregulation by miR-153 was abolished (Fig. 2a).
[score:4]
These data indicate that IDO1 downregulation by miR-153 in colon cancer cells enhances the cytotoxicity of co-cultured CAR T cells.
[score:4]
IDO-1 downregulation by miR-153 was also observed in HCT-116 cells treated with LPS (Additional file 4: Figure S4C).
[score:4]
IDO1 downregulation by miR-153 is inducer and time independence.
[score:4]
At the bottom is the reduced luciferase activity from reporter carrying the WT or the mutant IDO1 3′UTR under miR-153 overexpression.
[score:3]
To corroborate this finding, we next transfected a miR-153 expression vector containing both miR-153 and GFP into DLD-1 cells and stained cells using antibodies against IDO1.
[score:3]
miR-153 overexpression has little effects on colon cancer cells.
[score:3]
Previous reports demonstrate that miR-153 overexpression reduces cell proliferation in lung cancer cells [20], melanoma cells [21], and glioblastoma stem cells [22], but does not affect cell proliferation in colon cancer cells [23].
[score:3]
Therefore, miR-153 and IDO1 are suitable adjunct drug targets, e. g., in combination with CAR T cells, for adequately unleashing the immune response against cancer.
[score:3]
f Simple linear regression analysis showing an inverse relationship between miR-153 and IDO1 expression in 385 colon cancer patients from the TCGA database.
[score:3]
miR-153 also decreased IDO1 expression in monocyte-derived dendritic cells (Fig. 2e).
[score:3]
miR-153 overexpression enhances cancer cell killing by CAR T cells in xenografts.
[score:3]
Introduction of miR-153 resulted in lower IDO1 expression in DLD-1 cells treated with LPS or Cp-G DNA (Additional file 4: Figure S4A and B).
[score:3]
miR-153 decreased IDO1 mRNA expression in DLD-1 cells, but not in HCT-116 cells (Additional file 4: Figure S4D).
[score:3]
miR-153 overexpression in colon cancer cells, however, does not alter cell proliferation, cell apoptosis, or colony formation in vitro.
[score:3]
We noted that PD-L1, another IFN-γ -induced protein, was not suppressed by miR-153 (Fig. 2b).
[score:3]
A bar graph was plotted to show loss of CFSE fluorescence intensity in cells with or without miR-153 overexpression treated with IFN-γ.
[score:3]
We analyzed miR-153 expression in relationship to IDO1 mRNA levels in patients with colorectal cancer and found a significant inverse correlation between miR-153 and IDO1 mRNA levels (P = 0.04, R [2] = 0.23; Fig. 2f).
[score:3]
Nonetheless, these data suggest that IDO1 is a bona fide target gene of miR-153.
[score:3]
These data support that autonomous overexpression of miR-153 within tumor cells enhanced anti-tumor activities of CAR T cells.
[score:3]
The plasmids carrying miR-153 or the control had a GFP expression cassette.
[score:3]
In this work, we present that IDO1 inhibition by an miRNA miR-153 in combination with CAR T cells effectively enhances the efficacy of cancer cell killing that is mediated by CAR T cells.
[score:3]
b Flow cytometry analyses of IDO1 and PD-L1 expression in DLD-1, HT-29, or HCT-116 cells transfected with miR-153, a negative control (NC), or mock treatment.
[score:3]
As shown in Fig. 3, cell proliferation, apoptosis, and cell cycle arrest were not changed by miR-153 overexpression in DLD-1 and HCT-116 cells with or without IFN-γ treatment (Fig. 3a, b).
[score:3]
However, patients’ survival was not associated with miR-153 expression levels.
[score:3]
Our results support that miR-153 is an endogenous IDO1 negative regulator and an immunotherapy enhancer.
[score:2]
We generate CAR T cells targeting the epidermal growth factor receptor variant III and measure their tumor killing effects against colon cancer cells with or without miR-153 overexpression by killing assays and in xenografts.
[score:2]
These data suggest that miR-153 -mediated cell proliferation regulation is cancer cell-type specific.
[score:2]
Compared with mock treatment (transfection without agents) or the negative control, miR-153 substantially decreased IFN-γ -induced IDO1 expression in all cell lines as determined by flow cytometry (Fig. 2b) and about 60–90% by western blotting (Fig. 2c).
[score:2]
The seed sequence of miR-153 is underlined.
[score:1]
As a control for DLD-1-miR-153 (DLD + NC), DLD-1-luc cells were infected with virus carrying the parental vector.
[score:1]
At day 10, tumors were smaller in mice injected with either DLD-1 + NC or DLD-1 + miR-153 treated with CAR T cells than those in mice with DLD-1 + miR-153 and WT T cells; mice with DLD-1 + miR-153 and CAR T injection had the smallest tumors.
[score:1]
b CFSE -based proliferation of CAR T cells cultured with DLD-1 + NC or DLD-1 + miR-153.
[score:1]
Chimeric antigen receptor (CAR) T cells Indoleamine 2,3-dioxygenase 1 (IDO1) miR-153 Colon cancer Tumor microenvironment Two major advances in immunotherapy tip the balance in favor of the immune system for eliminating cancer cells.
[score:1]
c Wound-healing analyses of DLD-1 and HCT-116 cells transfected with miR-153 and treated with IFN-γ.
[score:1]
mirVana® miR-153 mimic and miRNA Mimic Negative Control #1 (negative control), Lipofectamine RNAiMAX transfection reagents, and IFN-γ were purchased from ThermoFisher (Waltham, MA).
[score:1]
T cells were co-cultured in DLD-1+miR-153 (orange) or DLD-1+NC cells (green) for 24 hours.
[score:1]
NC is a normal control for DLD-1-miR-153 (DLD-1-luc cells were infected with virus carrying the parental vector).
[score:1]
DLD-1 cells were treated with LPS or cp-G DNA for 12 h. (C and D) The IDO1 protein (C) or mRNA (D) levels in DLD-1 and HCT-116 cells transfected with or without miR-153 before treated with LPS for 6 to 24 h. (PDF 309 kb) Additional file 5: Figure S5.
[score:1]
The efficiency for transient transfection of miR-153 miRNA mimic or anti-miR-153 in 3 colon cancer cell lines ranged from ~ 40-70%.
[score:1]
At day 15, tumors were eradicated in 5/5 mice with DLD-1 + miR-153 and EGFRvIII-CAR T and in three of five mice with mice with DLD-1 + NC and EGFRvIII-CAR T. Four of five mice with DLD-1 + miR-153 and WT T cells developed larger tumors, some of which had metastasized (Fig. 5d).
[score:1]
a Apoptosis analyses of DLD-1 and HCT-116 cells transfected with miR-153 and treated with IFN-γ.
[score:1]
At the top is the base pairing between IDO1 3′UTR and miR-153.
[score:1]
d Xenograft tumor growth in NSG mice inoculated with DLD-1 + NC or DLD-1 + miR-153 cells and treated with CAR T or WT T cells.
[score:1]
b Cell cycle analyses of DLD-1 and HCT-116 cells transfected with miR-153 and treated with IFN-γ.
[score:1]
The precursor to miR-153 (Pre-miR-153) sequence was inserted into a lentiviral vector pSIH-copGFP from System Biosciences (Palo Alto, CA) to generate pSIH-miR-153 [17].
[score:1]
However, miR-153 introduction into either HCT-116 or DLD-1 cells barely altered cell proliferation, cell migration, and colony formation.
[score:1]
CFSE-labeled cells were transfected with miR-153, treated with IFN-γ, and cultured for 1 to 6 days before flow cytometry.
[score:1]
DLD-1-luc cells were infected by lentivirus carrying miR-153, and 5 × 10 [6] recombinant cells (DLD-1 + miR-153) were subcutaneously injected into 6- to 8-week NSG mice (n = 5).
[score:1]
We found that CAR T cells co-cultured with DLD-1 + miR-153 produced more IL-2, TNF-α, and granzyme B and had higher proliferation and potentially higher T cell activation than those co-cultured with DLD-1-NC (Fig. 5a, b).
[score:1]
a Cytokine production of CAR T cells co-cultured with DLD-1 cells with or without miR-153.
[score:1]
The activation of T cells exhibits no difference when co-cultured with tumor cells with or without miR-153.
[score:1]
[1 to 20 of 72 sentences]
|
6 |
![]()
Other miRNAs from this paper: mmu-mir-146a, mmu-mir-150, mmu-mir-155, mmu-mir-199a-1, mmu-mir-93, mmu-mir-100, mmu-mir-199a-2, mmu-mir-377, mmu-mir-423
However, IDO expression increased in antagomir-control recipients over time until it was higher than that detected in antagomir-153-3p recipients, although the expression of miR-153-3p was continuously inhibited by antagomir (Figure 5B-5C).
[score:7]
IDO expression is directly inhibited by miR-153-3p.
[score:6]
In the present study, we used in vitro and animal mo del experiments to first demonstrate that IDO could be directly inhibited by miR-153-3p and that this miR might participate in aGVHD by inhibiting IDO.
[score:6]
Based on the above results in animals, we speculated that the occurrence of aGVHD was determined by the early expression level of endogenous miR-153, although miR-153-3p might be only one of the inhibitors of IDO during aGVHD progression.
[score:5]
Animal mo del experiments suggested that miR-153-3p might participate in aGVHD by inhibiting IDO expression.
[score:5]
Therefore, miR-153-3p is involved in the pathogenesis of aGVHD through inhibiting IDO and might represent a putative new bio-target for novel intervention strategies for aGVHD.
[score:5]
To investigate whether miR-153-3p could directly inhibit the expression of IDO, the wild-type 3′UTR of the IDO sequence and a mutant IDO 3′UTR containing a mutation in the miR-153-3p binding site were ligated into a luciferase dual-reporter plasmid (Figure 2A).
[score:5]
In the present study, IDO, which is able to suppress T-cell immunity, was identified as a novel target of miR-153.
[score:5]
miR-153-3p expression is decreased while IDO expression is increased in murine recipients with aGVHD.
[score:5]
In the present study, we were also interested in determining how circulating miR-153-3p inhibits intracellular IDO expression.
[score:5]
Human IDO, which has been shown to function in immunosuppression, was identified as a potential target of miR-153-3p.
[score:5]
Following miR-153-3p transfection in HeLa cells, both the IDO mRNA and protein levels were significantly reduced (Figure 2C and 2D), indicating that miR-153-3p could bind to the IDO 3′UTR and inhibit the expression of IDO.
[score:5]
Thus, the direct inhibition of IDO by miR-153-3p would provide a new mechanism by which miR-153 participates in the pathogenesis of aGVHD in cells other than lymphocytes.
[score:4]
In addition, we revealed the direct target protein of miR-153-3p, IDO, which will be important for providing novel ideas for aGVHD therapy.
[score:4]
Because miR-153-3p directly binds IDO, we further investigated whether the expression level of miR-153-3p correlated negatively with the expression level of IDO in humans.
[score:4]
miR-153-3p expression varies with the development of aGVHD.
[score:4]
In conclusion, this study is the first to show that IDO is a new target of miR-153-3p.
[score:3]
It indicated that miR-153 might be related to some immune-related diseases, including GVHD.
[score:3]
miR-153-3p and IDO expression correlates with aGVHD in murine recipients.
[score:3]
E. The cumulative incidence of aGVHD between the high and low miR-153-3p expression groups in the training set (p<0.001).
[score:3]
To further confirm the effect of miR-153 expression at +7 d after transplantation on the occurrence of aGVHD, we employed another cohort of patients as the validation set (n=52, Table 1).
[score:3]
As anticipated, the expression level of miR-153-3p in the aGVHD group (270 copies/μl [range, 0-5221 copies/μl] vs 28 copies/μl [range, 0-838 copies/μl], p=0.031) was much higher than that in the control group.
[score:3]
The luciferase activity assay showed that miR-153-3p overexpression clearly decreased luciferase expression in the 293T cells compared with the controls (Figure 2B).
[score:3]
Recipient mice of an antagomir of miR-153-3p display relatively higher IDO expression at the early stage after transplantation.
[score:3]
On +7 d, three mice were randomly killed in each group to examine the plasma miR-153 expression level.
[score:3]
Notably, in the control group, the expression level of miR-153-3p was undetectable in 11 patients at +7 d, whereas miR-153-3p could be detected in the aGVHD group (Figure 1C).
[score:3]
Univariate analysis revealed that a higher expression level of miR-153-3p at +7 d (>120 copies/μl, p<0.001), a younger age (patients less than 30 years old, p=0.031) and undergoing haploidentical transplantation (p=0.001) were associated with a higher incidence of aGVHD.
[score:3]
The plasma miR-153-3p expression profiles of the six patients after allo-HSCT are shown in Supplemental Figure S1.
[score:3]
Therefore, miR-153-3p might be a putative bio-target for novel intervention strategies for aGVHD.
[score:3]
Therefore, we assumed that a SNP might be responsible for the differences in endogenous miR-153 expression.
[score:3]
Because receiving a haploidentical transplant is also an independent risk factor of aGVHD, there is also a possibility that the interaction between recipient and donor components might lead to the differential expression of miR-153 at the early stage after transplant.
[score:3]
High expression level of miR-153-3p at +7 d after allo-HSCT can predict the occurrence of aGVHD.
[score:3]
More interestingly, indoleamine-2,3-dioxygenase (IDO) was found to be a potential target protein of miR-153-3p through bioinformatics analysis.
[score:3]
The miR-153-3p antagomir increases IDO expression at the early stage after allo-HSCT.
[score:3]
Circulating RNA was purified, and qRT-PCR with SYBR Green was performed to detect the miR-153-3p expression level.
[score:3]
In the subsequent multivariate analysis, only a higher expression level of miR-153-3p at +7 d and undergoing haploidentical transplantation were independent risk factors for aGVHD (Table 2).
[score:3]
C. The expression level of miR-153-3p at +7 d in the aGVHD group was compared with that in the control group in the training set.
[score:2]
Figure 6 miR-153 has mainly been reported to be a critical regulator in the neural molecular network [18, 19], and it is also related to tumor proliferation [20, 21].
[score:2]
In the aGVHD group, 30 patients had decreased expression levels of miR-153-3p at the time of aGVHD occurrence compared to samples from the same patients prior to aGVHD onset (p<0.0001).
[score:2]
The expression level of miR-153-3p was much higher in the aGVHD group (range=77 to 3,389,977 copies/l plasma; Lg [copies/μl]=3.056±0.167, mean±SEM) compared to the group without aGVHD (range=0 to 817 copies/μl plasma; Lg [copies/μl]=1.253±0.181, p<0.0001).
[score:2]
To further confirm the change in miR-153-3p during aGVHD progression in human, we prospectively collected plasma samples from 70 consecutive patients (aGVHD+, n=35 vs aGVHD-, n=35) at different time points after allo-HSCT.
[score:1]
However, this difference in endogenous miR-153 remains unclear.
[score:1]
The constructs were transfected into 293T cells together with miR-153-3p mimic or miR control mimic.
[score:1]
The results of the GVHD mouse mo del experiments might elucidate the mechanism underlying the reduced IDO levels in early post-transplantation patients in response to endogenous miR-153 as a risk factor for aGVHD.
[score:1]
According to the ROC analysis, the optimal cut-off value for miR-153-3p was 120 copies/μl.
[score:1]
In this study, we found that the levels of miR-153-3p at +7 d in the GVHD group were higher than were those in the non-GVHD group.
[score:1]
miR-153-3p can bind to IDO.
[score:1]
Thus, we presumed that circulating miR-153-3p might also function in a manner similar to those mentioned above in DCs, MSCs and MDSCs during GVHD.
[score:1]
miR-153-3p is significantly increased when aGVHD occurs after allo-HSCT.
[score:1]
After miR-153-3p was identified as a potential biomarker of aGVHD, we were further interested in the role of this miR in GVHD progression.
[score:1]
However, whether a specific type of cell actively secretes miR-153-3p and what controls its shuttling are still unknown.
[score:1]
Absolute copies of miR-153-3p in the plasma were assessed using TaqMan qRT-PCR.
[score:1]
At +21 d, miR-153-3p levels had decreased in the liver but significantly increased in the small intestine.
[score:1]
Recipient mice of an antagomir of miR-153-3p do not develop severe aGVHD and have increased survival.
[score:1]
Clinically, elevated levels of plasma miR-153-3p at +7 d after transplantation would be a good predictor of the onset of aGVHD.
[score:1]
Among the five patients with increased miR-153-3p levels during aGVHD, three of them also showed increased miR-153-3p levels after aGVHD was controlled (Figure 1B).
[score:1]
However, the miR-153-3p level in control mice remained relatively low in comparison to the antagomir group.
[score:1]
In addition, 25 of the patients displayed a subsequent increase in miR-153-3p levels when aGVHD was controlled.
[score:1]
Recipient mice injected with a miR-153-3p antagomir exhibit delayed aGVHD and longer survival.
[score:1]
The statistical significance of the plasma miR-153-3p levels at +7 d after HSCT between the two groups was analyzed using Student's t test.
[score:1]
To investigate whether miR-153-3p expression is decreased during aGVHD, a major histocompatibility complex (MHC)-mismatched HSCT mo del was used in which spleen cells (2×10 [7]) and bone marrow cells (BMCs, 1×10 [7]) from C57BL/6 (H-2 [b], B6) donors were transferred intravenously into lethally irradiated BALB/c (H-2 [d]) (F1) recipient mice (Figure 3A).
[score:1]
D. Twenty-four hours after HeLa cell transfection with has-miR-153-3p mimic or mimic control, the cells were induced with IFNγ for twelve hours and lysed in RIPA buffer.
[score:1]
To confirm the relationship between miR-153-3p and aGVHD, we performed the MHC-mismatched murine experiment as previously described.
[score:1]
Mmu-miR-153 and IDO were quantified by TaqMan qRT-PCR.
[score:1]
Figure 2 A. The unique site of complementarity in has-miR-153-3p and human IDO mRNA is CUAUGCAA.
[score:1]
B. HEK-293T cells were transiently co -transfected with a combination of psiCHECK2 luciferase reporter plasmids encoding human IDO with a wild-type 3′UTR or mutated sequences and has-miR-153-3p mimic or mimic control.
[score:1]
In vivo miR-153 antagomir treatment Antagomirs were synthesized by Guangzhou RiboBio Co.
[score:1]
Moreover, we showed that the plasma level of miR-153-3p at +7 days (d) after allo-HSCT served as a promising biomarker to predict the occurrence of aGVHD.
[score:1]
A. The unique site of complementarity in has-miR-153-3p and human IDO mRNA is CUAUGCAA.
[score:1]
C. Total RNA isolated from HeLa cells transfected with has-miR-153-3p mimic or mimic control was subjected to real-time qPCR to assess the levels of IDO mRNA.
[score:1]
In vivo miR-153 antagomir treatment.
[score:1]
The results for miR-153-3p at +7 d after HSCT were log-transformed due to their abnormal distribution.
[score:1]
In the current study, we first demonstrated that the plasma miR-153-3p level would be a good biomarker for predicting subsequent aGVHD.
[score:1]
This finding suggested that molecules other than miR-153 might control IDO during the late stages of transplantation.
[score:1]
miR-153-3p yielded an AUC of 0.887 with a sensitivity of 74.3% and a specificity of 80.0% for forecasting aGVHD after allo-HSCT.
[score:1]
[1 to 20 of 75 sentences]
|
7 |
![]()
Other miRNAs from this paper: hsa-mir-30a, mmu-mir-30a, mmu-mir-30b, mmu-mir-135a-1, hsa-mir-30c-2, hsa-mir-30d, mmu-mir-30e, mmu-mir-300, hsa-mir-30b, hsa-mir-135a-1, hsa-mir-135a-2, hsa-mir-153-1, hsa-mir-153-2, mmu-mir-30c-1, mmu-mir-30c-2, mmu-mir-30d, mmu-mir-200a, mmu-mir-135a-2, hsa-mir-30c-1, hsa-mir-200a, hsa-mir-30e, hsa-mir-612, hsa-mir-300, mmu-mir-30f
Importantly, we found that systemic delivery of miR-153 antagomir up-regulated WWOX protein levels and inhibited expression of Wnt signaling target genes, including c-myc and Cyclin D1 (Figure 5C–5D).
[score:10]
On the other hand, overexpression of miR-153 significantly inhibited the proliferation and migration, and promoted apoptosis of lung cancer cells, through suppression of AKT expression [35].
[score:9]
First, overexpression of miR-153 promoted, while its antisense inhibited the transcriptional activity of β-catenin and expression of its down-stream target genes.
[score:9]
Besides, up-regulation of miR-153 promotes cell proliferation via suppression of the PTEN tumor suppressor gene in human prostate cancer [33].
[score:8]
At the molecular level, our luciferase reporter and analysis found that miR-153 could suppress WWOX expression through targeting its 3′-UTR region.
[score:7]
In agreement, a dramatic up-regulation of WWOX was observed in cells with miR-153 inhibition (Figure 3C and Supplementary Figure 1B).
[score:6]
Notably, we found that overexpression of miR-153 mimics resulted in a substantial increase of reporter activity (Figure 1A), which was accompanied by the up-regulation of Cyclin A, Cyclin D1, Cyclin E and C-myc, as well as the reduction of p21, leading to an increased cell cycle progression, cell proliferation and colony formation (Figure 1B–1F).
[score:6]
In addition, we observed a reduced protein levels of WWOX and p21, an increased expression of Cyclin D1 by miR-153 overexpression (Figure 4C), suggesting that miR-153 could also promote tumor growth in vivo.
[score:5]
To this end, bioinformatics software (TargetScan) was employed to identify potential target genes for miR-153.
[score:5]
As expected, inhibition of miR-153 dramatically suppressed HCC growth and size (Figure 5A–5B).
[score:5]
In agreement, inhibition of miR-153 by its antisense oligos led to a suppression of β-catenin activity (Figure 2A).
[score:5]
In agreement, we found that overexpression of miR-153 mimics promoted, while its antisense inhibited the nuclear localization of Dvl-2 protein (Supplementary Figure 2A–2B).
[score:5]
To understand how miR-153 regulates WWOX expression, the luciferase reporter plasmids containing the 3′-UTR of WWOX was co -transfected with miR-153 mimics or antisense.
[score:4]
It has been reported that miR-153 was down-regulated and correlated significantly with advanced clinical stage in ovarian cancers [32], suggesting that miR-153 might be of potential importance as diagnostic biomarkers.
[score:4]
However, the molecular determinants of miR-153 up-regulation in HCC tissues remain to be determined.
[score:4]
Third, miR-153 was up-regulated in HCC tissues and correlated with poor survival of patients.
[score:4]
The expression levels of Cyclin A, Cyclin D1, Cyclin E, C-myc and p21 were also affected by miR-153 antisense (Figure 2B–2C), accompanied with a reduction of cell growth and colony formation (Figure 2D–2F).
[score:3]
Mutations were introduced in potential miR-153 binding sites using the QuikChange site-directed mutagenesis Kit (Stratagene, USA).
[score:3]
MicroRNA-153 regulates β-catenin activation through suppression of WWOX.
[score:3]
Figure 6 (A) miR-153 expression was determined by real-time PCR in human HCC tissues and adjacent normal tissues.
[score:3]
Transfection of miR-153 mimics resulted in a reduced WWOX protein expression (Figure 3B and Supplementary Figure 1A).
[score:3]
Next, we examined the mechanisms underlying the inhibitory effect of miR-153 on β-catenin -dependent gene transcription.
[score:3]
Therefore, miR-153 could either act as an onco-miRNA or a tumor suppressor in human cancers, which might be dependent on cellular context.
[score:3]
5.0 × 10 [6] HepG2 cells stably expressing miR-153 or negative control (miR-NC) were injected subcutaneously to the skin under the front legs of the mouse.
[score:3]
To further demonstrate its function, we tested if forced expression of miR-153 promotes the ability of HepG2 cells to form xenograft tumors in nude mice.
[score:3]
Next, we asked whether miR-153 inhibition has therapeutic and preventive effects for HCC using a murine liver cancer mo del.
[score:3]
As a result, WWOX overexpression reversed the oncogenic roles of miR-153 (Supplementary Figure 3B–3C), underlining the specific importance of the WWOX for miR-153 action in the cell proliferation.
[score:3]
MicroRNA-153 promotes HCC growth in vivoTo further demonstrate its function, we tested if forced expression of miR-153 promotes the ability of HepG2 cells to form xenograft tumors in nude mice.
[score:3]
Among which, we found that WWOX, harbored a potential miR-153 binding site in its 3′-untranslated region (3′-UTR) (Figure 3A).
[score:3]
Systematic administration of MicroRNA-153 suppresses HCC development in C57BL/6 mice.
[score:3]
As expected, miR-153 was significantly up-regulated in HCC tissues, compared with adjacent normal tissues (Figure 6A).
[score:3]
MicroRNA-153 regulates WWOX expression.
[score:3]
As a result, the tumor volume and weight were markedly increased in miR-153 -overexpressed tumors compared to control tumors (Figure 4A–4B).
[score:2]
To further investigate whether the deregulated abundant miR-153 correlates with the survival of HCC patients, expression levels of miR-153 were determined in HCC and matched non-cancerous tissues.
[score:2]
As shown in the Supplementary Figure 4, expression levels of miR-153 gradually increased in C57BL/6 mice treated with DEN, compared with vehicle controls.
[score:2]
Second, miR-153 could regulate cell proliferation and tumor growth in vitro and in vivo.
[score:2]
In the present study, we performed a MicroRNA -based genetic screen, which revealed a novel diversion in β-catenin signaling triggered by miR-153 in HCC development.
[score:2]
In the present study, our data showed that miR-153 could be a novel and important regulator of β-catenin signaling in HCC.
[score:2]
MicroRNA-153 antisense inhibits β-catenin signaling.
[score:2]
Taken together, in the present study, our results highlight the roles of miR-153 in the regulation of HCC.
[score:2]
Moreover, miR-153 supports colorectal cancer progression via pleiotropic effects that enhance invasion and chemotherapeutic resistance [34].
[score:1]
Our results further indicate that miR-153-medicated activation of β-catenin may play an important role in the HCC progression.
[score:1]
Figure 2 (A) HepG2 cells transiently transfected with the TopFlash–FopFlash and miR-153 antisense (AS) or NC for 36 hr.
[score:1]
Figure 5 (A–B) Number of HCC tumors/liver (A) and tumor size (mm [3]) (B) in NC-, and miR-153 antigomir -treated mice.
[score:1]
Furthermore, mutagenesis of the seed sequence abolished the effects of miR-153 mimics or antisense on WWOX activity (Figure 3D).
[score:1]
Figure 4 (A–B) HepG2 cells stably transfected with miR-153 or negative control (NC) were injected into nude mice (n = 6–8 for each group) and followed up for tumorigenesis.
[score:1]
To further verify the functional connection between miR-153 and WWOX, HepG2 cells were transfected with adenovirus containing WWOX or GFP as a negative control (Supplementary Figure 3A).
[score:1]
Mice were systemically administrated with miR-NC or miR-153 antagomir at week 28.
[score:1]
Cells were transfected with 100 ng of wild-type 3′-UTR-reporter or mutant constructs together with miR-153 mimics, antisenseor negative control (NC).
[score:1]
miR-153 mimics and antisense were purchased from Ambion Company (Invitrogen, USA).
[score:1]
Based on this finding, we treated mice with systemically administration of miR-NC or miR-153 antagomir at week 28.
[score:1]
Kaplan-Meier analysis further revealed that low miR-153 level in HCC tissues significantly correlated with the markedly reduced tumor-free survival and overall survival of HCC patients (Figure 6B–6C).
[score:1]
[1 to 20 of 52 sentences]
|
8 |
![]()
Other miRNAs from this paper: hsa-mir-21, mmu-mir-141, mmu-mir-181a-2, hsa-mir-34a, hsa-mir-181a-2, hsa-mir-181a-1, hsa-mir-141, hsa-mir-153-1, hsa-mir-153-2, mmu-mir-200a, mmu-mir-21a, mmu-mir-34a, mmu-mir-181a-1, hsa-mir-200a, hsa-mir-1246, mmu-mir-21b, mmu-mir-21c
The results revealed that PQ could inhibit the expression of miR-200a-3p and miR-21, but up-regulated the levels of miR-141-3p and miR-153 in damaged lung tissues; EPCs injection significantly attenuated the PQ induced-up-regulation of miR-141-3p (approximate to 60%), while EPCs had no significant effect on the expression of miR-200a-3p, miR-21 and miR-153 (Fig. 3a).
[score:13]
PQ also caused the dysregulated expression of some miRNAs including miR-200a-3p, miR-21, miR-141-3p and miR-153, and only the level of miR-141-3p was influenced by EPCs.
[score:4]
a The expressions of miR-200a-3p, miR-21, miR-141-3p and miR-153 in lung tissues were determined using qRT-PCR.
[score:3]
[1 to 20 of 3 sentences]
|
9 |
![]()
Other miRNAs from this paper: mmu-mir-101a, mmu-mir-124-3, mmu-mir-195a, mmu-mir-206, mmu-mir-298, mmu-mir-16-1, mmu-mir-16-2, mmu-mir-29a, mmu-mir-92a-2, mmu-mir-328, mmu-mir-101b, mmu-mir-124-1, mmu-mir-124-2, mmu-mir-92a-1, mmu-mir-92b, mmu-mir-101c, mmu-mir-195b, mmu-mir-124b
MicroRNA-153 physiologically inhibits expression of amyloid-beta precursor protein in cultured human fetal brain cells and is dysregulated in a subset of Alzheimer disease patients.
[score:7]
It is worth mentioning that beyond miR-101, among several microRNAs reported to regulate APP expression, miR-153 (Long et al., 2012) is also predicted to target human and mouse, but not rat, RanBP9 3′UTR.
[score:6]
MicroRNA-153 negatively regulates the expression of amyloid precursor protein and amyloid precursor-like protein 2. Brain Res.
[score:3]
However, the miR-153 binding site is very close to the RanBP9 open reading frame suggesting that the efficiency of targeting should be low (Grimson et al., 2007).
[score:3]
[1 to 20 of 4 sentences]
|
10 |
![]()
Other miRNAs from this paper: hsa-mir-21, hsa-mir-29a, mmu-mir-124-3, mmu-mir-9-2, mmu-mir-132, mmu-mir-135a-1, hsa-mir-139, hsa-mir-124-1, hsa-mir-124-2, hsa-mir-124-3, hsa-mir-132, hsa-mir-135a-1, hsa-mir-135a-2, hsa-mir-153-1, hsa-mir-153-2, hsa-mir-9-1, hsa-mir-9-2, hsa-mir-9-3, mmu-mir-21a, mmu-mir-29a, mmu-mir-29c, mmu-mir-135b, mmu-mir-139, mmu-mir-135a-2, mmu-mir-124-1, mmu-mir-124-2, mmu-mir-9-1, mmu-mir-9-3, hsa-mir-29c, hsa-mir-135b, mmu-mir-21b, mmu-mir-21c, mmu-mir-9b-2, mmu-mir-124b, mmu-mir-9b-1, mmu-mir-9b-3
REST directly down-regulates a large number of genes at the transcriptional level, but also probably indirectly activates the expression of other genes at the post-transcriptional level via the repression of many noncoding targets (Conaco et al., 2006; Mortazavi et al., 2006; Wu and Xie, 2006; Visvanathan et al., 2007; Singh et al., 2008; Johnson et al., 2009), including several micro RNAs (miRNAs) considered to be brain-specific (such as miR9, miR124, miR132, miR135, miR139, and miR153; Figure 1).
[score:9]
REST regulates the expression of miRNAs and is itself regulated by them, including miR-153 (Mortazavi et al., 2006; Wu and Xie, 2006), miR-9 and miR-29a (Wu and Xie, 2006; Figure 1).
[score:5]
Importantly, REST itself appears to be a predicted target of miR-153 (Mortazavi et al., 2006; Wu and Xie, 2006), miR-9 and miR-29a (Wu and Xie, 2006).
[score:3]
[1 to 20 of 3 sentences]
|
11 |
![]()
Other miRNAs from this paper: hsa-let-7c, hsa-mir-16-1, hsa-mir-21, hsa-mir-23a, hsa-mir-16-2, mmu-mir-9-2, mmu-mir-146a, mmu-mir-181a-2, mmu-mir-183, mmu-mir-191, mmu-mir-195a, hsa-mir-181a-2, hsa-mir-181b-1, hsa-mir-181c, hsa-mir-183, hsa-mir-181a-1, hsa-mir-153-1, hsa-mir-153-2, hsa-mir-191, hsa-mir-9-1, hsa-mir-9-2, hsa-mir-9-3, hsa-mir-146a, mmu-let-7c-1, mmu-let-7c-2, mmu-mir-16-1, mmu-mir-16-2, mmu-mir-21a, mmu-mir-23a, hsa-mir-181b-2, mmu-mir-181a-1, mmu-mir-9-1, mmu-mir-9-3, mmu-mir-181b-1, mmu-mir-181c, mmu-mir-181b-2, hsa-mir-181d, mmu-mir-181d, mmu-mir-1195, mmu-mir-2137, mmu-mir-486b, mmu-mir-21b, mmu-mir-21c, mmu-mir-9b-2, mmu-mir-9b-1, mmu-mir-9b-3
This mRNA is targeted by miR-9-5p [47], miR-21-5p, miR-16-5p (TargetScan), miR-183-5p [47], miR-486b-5p [82], and miR-153-3p [47].
[score:5]
miR-195a-5p that has the same seeding sequence with miR-16-5p and is predicted to bind BCL2 mRNA was also downregulated while miR-153-3p that was also found to bind BCL2 experimentally (by Western blot, qRT-PCR, and LUC) [45] was increased.
[score:4]
FOXO1 is targeted by a multitude of miRNAs that are changed in our study miR-9-5p, miR-21-5p, miR-16-5p, miR-183-5p [47], miR-486b-5p, and miR-153-3p.
[score:3]
miR-153-3p that binds BCL2 experimentally (by WB, qRT-PCR and LUC) [45] was increased in our study and may have the opposite effect, i. e., attenuating the anti-apoptotic effect of the other miRNAs.
[score:1]
[1 to 20 of 4 sentences]
|
12 |
![]()
Other miRNAs from this paper: mmu-mir-30a, mmu-mir-101a, mmu-mir-124-3, mmu-mir-9-2, mmu-mir-146a, mmu-mir-150, mmu-mir-181a-2, mmu-mir-182, mmu-mir-122, mmu-mir-106b, mmu-mir-148a, mmu-mir-200a, mmu-mir-20a, mmu-mir-93, mmu-mir-96, mmu-mir-338, mmu-mir-17, mmu-mir-200c, mmu-mir-181a-1, mmu-mir-320, mmu-mir-221, mmu-mir-124-1, mmu-mir-124-2, mmu-mir-9-1, mmu-mir-9-3, mmu-mir-382, mmu-mir-384, mmu-mir-411, mmu-mir-503, mmu-mir-495, mmu-mir-9b-2, mmu-mir-124b, mmu-mir-9b-1, mmu-mir-9b-3
Interestingly, miR-182 and miR-153 in the Udown group had close relations with the Uup microRNAs through their targets Nfatc3, Ppp3r1, and Robo2 (Fig 6A and Table 1), indicating cooperation between the microRNAs in these two groups in regulating multiple processes.
[score:4]
Also, miR-153 in the Udown group together with miR-221, miR-384-5p, and miR-30a in the Uup group targeted Nfat.
[score:3]
miR-153 in the Udown group targeted Nfatc3, along with miR-221, miR-384-5p, and miR-30a in the Uup group.
[score:3]
Also, Robo2 was targeted by miR-153 in the Udown group and miR-148a/b, miR-338-3p, and miR-101a/b in the Uup group (Fig 6A).
[score:3]
[1 to 20 of 4 sentences]
|
13 |
![]()
Other miRNAs from this paper: mmu-mir-132, mmu-mir-184, mmu-mir-205, mmu-mir-34b, mmu-let-7a-1, mmu-let-7a-2, mmu-mir-7a-1, mmu-mir-7a-2, mmu-mir-7b, mmu-mir-133b, mmu-mir-433
Among the miRs reported to regulate α-synuclein, miR-7a-5p did not change and miR-153-3p was upregulated in DA neurons from old mice, however, there was no evidence for a reduction of Snca expression (Supplementary Figure S1A).
[score:7]
Several miRs, such as miR-133b, miR-7 and miR-153, miR-433, let-7a-5p and miR-184-5p, miR-205, miR-132 and miR-34b/c, have previously been implicated in the development and maintenance of DA neurons and were linked to neurodegeneration.
[score:2]
[1 to 20 of 2 sentences]
|
14 |
![]()
Other miRNAs from this paper: mmu-let-7g, mmu-let-7i, mmu-mir-1a-1, mmu-mir-27b, mmu-mir-29b-1, mmu-mir-125a, mmu-mir-125b-2, mmu-mir-132, mmu-mir-141, mmu-mir-142a, mmu-mir-144, mmu-mir-155, mmu-mir-200b, mmu-mir-206, mmu-let-7d, mmu-mir-200a, mmu-let-7a-1, mmu-let-7a-2, mmu-let-7b, mmu-let-7c-1, mmu-let-7c-2, mmu-let-7e, mmu-let-7f-1, mmu-let-7f-2, mmu-mir-21a, mmu-mir-29a, mmu-mir-29c, mmu-mir-27a, mmu-mir-93, mmu-mir-34a, mmu-mir-1a-2, mmu-mir-28a, mmu-mir-200c, mmu-mir-29b-2, mmu-mir-125b-1, mmu-mir-1b, mmu-mir-28c, mmu-mir-28b, mmu-mir-21b, mmu-let-7j, mmu-mir-21c, mmu-let-7k, mmu-mir-142b
As such affector miRNAs, that act independently from the interaction of Nrf2 with Keap1, miRNAs miR-153, miR-27-a, miR-142-5p, and miR-144 regulated the Nrf2 expression in neuroblastoma cells [179], and miR-28 targeted the 3’UTR of Nrf2 mRNA decreasing Nrf2 expression in human breast cancer cells [180].
[score:8]
[1 to 20 of 1 sentences]
|
15 |
![]()
Other miRNAs from this paper: mmu-mir-135a-1, mmu-mir-142a, mmu-mir-129-1, mmu-mir-183, mmu-mir-186, mmu-mir-187, mmu-mir-206, mmu-mir-207, mmu-mir-296, mmu-mir-298, mmu-mir-301a, mmu-mir-129-2, rno-mir-301a, rno-mir-129-2, mmu-mir-19a, mmu-mir-135a-2, mmu-mir-380, rno-mir-19a, rno-mir-129-1, rno-mir-135a, rno-mir-142, rno-mir-153, rno-mir-183, rno-mir-186, rno-mir-187, rno-mir-206, rno-mir-296, rno-mir-298, mmu-mir-433, rno-mir-433, rno-mir-207, mmu-mir-301b, mmu-mir-761, mmu-mir-705, mmu-mir-449b, rno-mir-301b, rno-mir-380, rno-mir-761, mmu-mir-129b, mmu-mir-142b
MicroRNAs like miR-19a, 34b, 129, 135a, 142-3p, miR-153, miR-186, miR-187, and miR-301a were significantly downregulated in Cs1-ko mice.
[score:4]
Majority of the dysregulated microRNAs e. g. miR-380, miR-207, miR-79, miR-129, miR-153, miR-183, etc.
[score:2]
[1 to 20 of 2 sentences]
|
16 |
![]()
Other miRNAs from this paper: mmu-let-7g, mmu-let-7i, mmu-mir-9-2, mmu-mir-132, mmu-mir-138-2, mmu-mir-140, mmu-mir-195a, mmu-mir-34c, mmu-mir-34b, mmu-let-7d, mmu-mir-208a, mmu-let-7a-1, mmu-let-7a-2, mmu-let-7b, mmu-let-7c-1, mmu-let-7c-2, mmu-let-7e, mmu-let-7f-1, mmu-let-7f-2, mmu-mir-16-1, mmu-mir-16-2, mmu-mir-21a, mmu-mir-29a, mmu-mir-34a, mmu-mir-148b, mmu-mir-338, mmu-mir-210, mmu-mir-219a-1, mmu-mir-9-1, mmu-mir-9-3, mmu-mir-138-1, mmu-mir-219a-2, mmu-mir-503, mmu-mir-146b, mmu-mir-709, mmu-mir-195b, mmu-mir-21b, mmu-let-7j, mmu-mir-21c, mmu-let-7k, mmu-mir-219b, mmu-mir-219c, mmu-mir-9b-2, mmu-mir-9b-1, mmu-mir-9b-3
For example, Ccnd1 is targeted by miR-138, but it is also targeted by miR-34a, miR-16, miR-195, miR-153, miR-503 and many other microRNAs [50].
[score:5]
[1 to 20 of 1 sentences]
|
17 |
![]()
Other miRNAs from this paper: mmu-mir-30a, mmu-mir-30b, mmu-mir-124-3, mmu-mir-155, mmu-mir-30e, mmu-mir-30c-1, mmu-mir-30c-2, mmu-mir-30d, mmu-mir-124-1, mmu-mir-124-2, mmu-mir-7a-1, mmu-mir-7a-2, mmu-mir-7b, mmu-mir-133b, mmu-mir-30f, mmu-mir-124b
In addition, miR-7, miR-153 and miR-155 negatively regulated α-syn expression, which is a crucial regulator for neuroinflammation in PD [15, 24].
[score:5]
[1 to 20 of 1 sentences]
|
18 |
![]()
Other miRNAs from this paper: mmu-let-7g, mmu-let-7i, mmu-mir-15b, mmu-mir-154, mmu-mir-190a, mmu-mir-204, mmu-mir-34c, mmu-let-7d, mmu-let-7a-1, mmu-let-7a-2, mmu-let-7b, mmu-let-7c-1, mmu-let-7c-2, mmu-let-7e, mmu-let-7f-1, mmu-let-7f-2, mmu-mir-214, mmu-mir-181b-1, mmu-mir-133b, mmu-mir-181b-2, mmu-mir-448, mmu-mir-675, mmu-mir-455, mmu-mir-190b, mmu-mir-574, mmu-mir-1983, mmu-mir-1839, mmu-let-7j, mmu-let-7k
The following TaqMan RT-PCR assays from Life Technologies were used to assess expression of mmu-miR-455, mmu-miR-574-3p, mmu-miR-448-5p, mmu-miR-45c-5p, mmu-miR-34c-3p, mmu-miR-204, mmu-miR-1839-3p, mmu-miR-153, mmu-miR-1983, mmu-miR-214 in mouse: 002455 (mmu-miR-455), 002349 (mmu-miR-574-3p), 464921_mat (mmu-miR-448-5p), 000428 (mmu-miR-45c-5p), 001197 (mmu-miR-204), 002584 (mmu-miR-34c*), 121203_mat (mmu-miR-1839-3p), 001191 (mmu-miR-153), 121204_mat (mmu-miR-1983), 002306 (mmu-miR-214) and 001973 (U6 snRNA).
[score:2]
RT-PCR analysis was performed for miR-448, miR-34c, miR-34c*, miR-204, miR-1839-3p, miR-153, miR-1983, miR-214, miR-455, miR-574-3p.
[score:1]
miR array profiling identified ten specific miRs that were altered (>1.5 fold, p < 0.05) by morphine (miR-204, miR-448, miR-455, miR-574, miR-34c, miR-34c*, miR-1839, miR-153, miR-1983 and miR-214) and RT-PCR analysis was performed for those ten miRs.
[score:1]
[1 to 20 of 3 sentences]
|
19 |
![]()
Other miRNAs from this paper: mmu-mir-132, mmu-mir-140, mmu-mir-144, mmu-mir-200b, mmu-mir-122, mmu-mir-34c, mmu-mir-19b-2, mmu-mir-20a, mmu-mir-21a, mmu-mir-27a, mmu-mir-92a-2, mmu-mir-34a, mmu-mir-103-1, mmu-mir-103-2, mmu-mir-210, mmu-mir-214, mmu-mir-33, mmu-mir-19b-1, mmu-mir-92a-1, mmu-mir-705, mmu-mir-3077, mmu-mir-21b, mmu-mir-21c
Cao Y LV Q LV C MicroRNA-153 suppresses the osteogenic differentiation of human mesenchymal stem cells by targeting bone morphogenetic protein receptor type IIInt.
[score:4]
[1 to 20 of 1 sentences]
|
20 |
![]()
Other miRNAs from this paper: mmu-mir-124-3, mmu-mir-9-2, mmu-mir-34c, mmu-mir-34b, mmu-mir-106b, mmu-mir-34a, rno-mir-7a-1, mmu-mir-124-1, mmu-mir-124-2, mmu-mir-9-1, mmu-mir-9-3, mmu-mir-7a-1, mmu-mir-7a-2, mmu-mir-7b, rno-mir-7a-2, rno-mir-7b, rno-mir-9a-1, rno-mir-9a-3, rno-mir-9a-2, rno-mir-34b, rno-mir-34c, rno-mir-34a, rno-mir-106b, rno-mir-124-3, rno-mir-124-1, rno-mir-124-2, rno-mir-153, rno-mir-9b-3, rno-mir-9b-1, rno-mir-9b-2, mmu-mir-9b-2, mmu-mir-124b, mmu-mir-9b-1, mmu-mir-9b-3
Post-transcriptional regulation of alpha-synuclein expression by mir-7 and mir-153.
[score:4]
[1 to 20 of 1 sentences]
|
21 |
![]()
Other miRNAs from this paper: mmu-let-7i, mmu-mir-15b, mmu-mir-128-1, mmu-mir-135a-1, mmu-mir-140, mmu-mir-142a, mmu-mir-144, mmu-mir-154, mmu-mir-155, mmu-mir-298, mmu-mir-34b, mmu-mir-200a, mmu-let-7b, mmu-mir-26a-1, mmu-mir-27a, mmu-mir-31, mmu-mir-93, mmu-mir-34a, mmu-mir-103-1, mmu-mir-103-2, mmu-mir-338, mmu-mir-344-1, mmu-mir-28a, mmu-mir-219a-1, mmu-mir-26a-2, mmu-mir-135a-2, mmu-mir-128-2, mmu-mir-7a-1, mmu-mir-7a-2, mmu-mir-219a-2, mmu-mir-377, mmu-mir-380, mmu-mir-382, mmu-mir-133b, mmu-mir-543, mmu-mir-376c, mmu-mir-770, mmu-mir-344d-3, mmu-mir-3099, mmu-mir-344d-1, mmu-mir-344d-2, mmu-mir-495, mmu-mir-669b, mmu-mir-669c, mmu-mir-700, mmu-mir-344-2, mmu-mir-544, mmu-mir-1983, mmu-mir-344e, mmu-mir-344b, mmu-mir-344c, mmu-mir-344g, mmu-mir-344f, mmu-mir-28c, mmu-mir-28b, mmu-mir-344h-1, mmu-mir-344h-2, mmu-mir-344i, mmu-mir-219b, mmu-mir-219c, mmu-mir-142b
[15] A study in SH-SY5Y cells (a human derived cell line) was the first to identify and verify that the Nrf2 gene is the target gene of miR-153/miR-27a/miR-142-5p/miR-144.
[score:3]
[1 to 20 of 1 sentences]
|
22 |
![]()
Other miRNAs from this paper: mmu-mir-1a-1, mmu-mir-124-3, mmu-mir-9-2, mmu-mir-154, mmu-mir-190a, mmu-mir-193a, mmu-mir-130b, mmu-mir-21a, mmu-mir-29a, mmu-mir-323, mmu-mir-325, mmu-mir-1a-2, mmu-mir-32, mmu-mir-33, mmu-mir-222, mmu-mir-124-1, mmu-mir-124-2, mmu-mir-9-1, mmu-mir-9-3, mmu-mir-335, mmu-mir-409, mmu-mir-431, mmu-mir-744, mmu-mir-488, mmu-mir-681, mmu-mir-714, mmu-mir-190b, mmu-mir-193b, mmu-mir-877, mmu-mir-1b, mmu-mir-21b, mmu-mir-21c, mmu-mir-9b-2, mmu-mir-124b, mmu-mir-9b-1, mmu-mir-9b-3
miR-431, miR-714, miR-744, miR-877, miR-130b, miR-21, miR-323-3p, miR-325, miR-409-3p, miR-154*, and miR-681 were significantly increased 4 days post-sciatic nerve crush in pre-conditioned DRGs, while miR-190, miR-1, miR-33, miR-32, miR-153, miR-335-5p, miR-193, and miR-488 showed significantly decreased expression.
[score:3]
[1 to 20 of 1 sentences]
|
23 |
![]()
Other miRNAs from this paper: hsa-let-7a-1, hsa-let-7a-2, hsa-let-7a-3, hsa-let-7b, hsa-let-7c, hsa-let-7d, hsa-let-7e, hsa-let-7f-1, hsa-let-7f-2, hsa-mir-21, hsa-mir-26a-1, hsa-mir-29b-1, hsa-mir-29b-2, mmu-let-7g, mmu-let-7i, mmu-mir-29b-1, mmu-mir-125b-2, mmu-mir-144, mmu-mir-10b, mmu-mir-200b, hsa-mir-10b, hsa-mir-214, hsa-mir-200b, mmu-let-7d, hsa-let-7g, hsa-let-7i, hsa-mir-125b-1, hsa-mir-144, hsa-mir-153-1, hsa-mir-153-2, hsa-mir-125b-2, mmu-mir-200a, mmu-let-7a-1, mmu-let-7a-2, mmu-let-7b, mmu-let-7c-1, mmu-let-7c-2, mmu-let-7e, mmu-let-7f-1, mmu-let-7f-2, mmu-mir-21a, mmu-mir-26a-1, hsa-mir-200c, mmu-mir-200c, mmu-mir-214, mmu-mir-26a-2, mmu-mir-29b-2, mmu-mir-125b-1, hsa-mir-200a, hsa-mir-26a-2, hsa-mir-494, mmu-mir-494, mmu-mir-21b, mmu-let-7j, mmu-mir-21c, mmu-let-7k
Several research reported that PTEN function as a target gene of miR-21 [28], miR-214 [29], miR-494 [30], miR-26a [31], miR-144 [32] and miR-153 [33].
[score:3]
[1 to 20 of 1 sentences]
|
24 |
![]()
Other miRNAs from this paper: mmu-let-7g, mmu-let-7i, mmu-mir-1a-1, mmu-mir-15b, mmu-mir-29b-1, mmu-mir-126a, mmu-mir-128-1, mmu-mir-9-2, mmu-mir-133a-1, mmu-mir-137, mmu-mir-140, mmu-mir-142a, mmu-mir-145a, mmu-mir-146a, mmu-mir-155, mmu-mir-181a-2, mmu-mir-185, mmu-mir-188, mmu-mir-193a, mmu-mir-200b, mmu-mir-204, mmu-mir-205, mmu-mir-206, mmu-mir-122, mmu-mir-143, mmu-mir-302a, mmu-mir-34c, mmu-mir-34b, mmu-let-7d, mmu-mir-196a-1, mmu-mir-196a-2, mmu-mir-208a, mmu-let-7a-1, mmu-let-7a-2, mmu-let-7b, mmu-let-7c-1, mmu-let-7c-2, mmu-let-7e, mmu-let-7f-1, mmu-let-7f-2, mmu-mir-15a, mmu-mir-21a, mmu-mir-22, mmu-mir-29a, mmu-mir-29c, mmu-mir-31, mmu-mir-34a, mmu-mir-1a-2, mmu-mir-10a, mmu-mir-17, mmu-mir-210, mmu-mir-212, mmu-mir-181a-1, mmu-mir-214, mmu-mir-223, mmu-mir-33, mmu-mir-221, mmu-mir-29b-2, mmu-mir-9-1, mmu-mir-9-3, mmu-mir-181b-1, mmu-mir-181c, mmu-mir-128-2, mmu-mir-7a-1, mmu-mir-7a-2, mmu-mir-361, mmu-mir-375, mmu-mir-378a, mmu-mir-133a-2, mmu-mir-181b-2, mmu-mir-429, mmu-mir-449a, mmu-mir-451a, mmu-mir-302b, mmu-mir-302c, mmu-mir-302d, mmu-mir-146b, mmu-mir-181d, mmu-mir-1b, mmu-mir-378b, mmu-mir-145b, mmu-mir-21b, mmu-let-7j, mmu-mir-378c, mmu-mir-21c, mmu-mir-378d, mmu-mir-451b, mmu-let-7k, mmu-mir-126b, mmu-mir-142b, mmu-mir-9b-2, mmu-mir-9b-1, mmu-mir-9b-3
MicroRNA-153 negatively regulates the expression of amyloid precursor protein and amyloid precursor-like protein 2. Brain Res.
[score:3]
[1 to 20 of 1 sentences]
|
25 |
![]()
Other miRNAs from this paper: mmu-mir-27b, mmu-mir-124-3, mmu-mir-125b-2, mmu-mir-132, mmu-mir-134, mmu-mir-138-2, mmu-mir-140, mmu-mir-10b, mmu-mir-186, mmu-mir-24-1, mmu-mir-34b, mmu-mir-106b, mmu-mir-19b-2, mmu-mir-30c-1, mmu-mir-30c-2, mmu-let-7f-1, mmu-let-7f-2, mmu-mir-21a, mmu-mir-24-2, mmu-mir-26a-1, mmu-mir-27a, rno-mir-322-1, mmu-mir-322, mmu-mir-326, rno-mir-326, rno-mir-329, mmu-mir-329, rno-mir-140, mmu-mir-19a, mmu-mir-25, mmu-mir-139, mmu-mir-219a-1, mmu-mir-320, mmu-mir-26a-2, mmu-mir-124-1, mmu-mir-124-2, mmu-mir-19b-1, mmu-mir-138-1, mmu-mir-125b-1, mmu-mir-219a-2, rno-let-7f-1, rno-let-7f-2, rno-mir-10b, rno-mir-19b-1, rno-mir-19b-2, rno-mir-19a, rno-mir-21, rno-mir-24-1, rno-mir-24-2, rno-mir-25, rno-mir-26a, rno-mir-27b, rno-mir-27a, rno-mir-30c-1, rno-mir-30c-2, rno-mir-34b, rno-mir-106b, rno-mir-124-3, rno-mir-124-1, rno-mir-124-2, rno-mir-125b-1, rno-mir-125b-2, rno-mir-132, rno-mir-134, rno-mir-138-2, rno-mir-138-1, rno-mir-139, rno-mir-153, rno-mir-186, rno-mir-219a-1, rno-mir-219a-2, rno-mir-320, rno-mir-219b, mmu-mir-21b, mmu-mir-21c, mmu-mir-219b, mmu-mir-219c, rno-mir-322-2, mmu-mir-124b
miR-153 did not show any changes in either the expression of the primary transcript or the mature form (Figure 5I).
[score:3]
[1 to 20 of 1 sentences]
|
26 |
![]()
Other miRNAs from this paper: hsa-mir-20a, hsa-mir-98, mmu-mir-124-3, hsa-mir-124-1, hsa-mir-124-2, hsa-mir-124-3, hsa-mir-153-1, hsa-mir-153-2, mmu-mir-20a, mmu-mir-98, rno-mir-20a, mmu-mir-124-1, mmu-mir-124-2, hsa-mir-361, mmu-mir-361, rno-mir-98, rno-mir-124-3, rno-mir-124-1, rno-mir-124-2, rno-mir-153, hsa-mir-20b, dre-mir-20b, dre-mir-20a, dre-mir-124-1, dre-mir-124-2, dre-mir-124-3, dre-mir-124-4, dre-mir-124-5, dre-mir-124-6, dre-mir-153b, dre-mir-153a, dre-mir-153c, rno-mir-361, mmu-mir-20b, rno-mir-20b, mmu-mir-124b
The results of miRror2.0 for the input of mmu miR-98, mmu miR-124, mmu miR-153 and mmu miR-361 are shown.
[score:1]
Figure 2A shows the difference in the mapping of the four selected mouse miRNAs (mmu-miR-124, mmu-miR-153, mmu-miR-361 and mmu-miR-98; only four miRNAs were selected for simplicity).
[score:1]
[1 to 20 of 2 sentences]
|
27 |
![]()
Other miRNAs from this paper: mmu-let-7i, mmu-mir-27b, mmu-mir-9-2, mmu-mir-144, mmu-mir-149, mmu-mir-199a-1, mmu-mir-297a-1, mmu-mir-297a-2, mmu-mir-106a, mmu-mir-106b, mmu-let-7e, mmu-mir-16-1, mmu-mir-16-2, mmu-mir-21a, mmu-mir-31, mmu-mir-92a-2, mmu-mir-34a, mmu-mir-340, mmu-mir-214, mmu-mir-218-1, mmu-mir-218-2, mmu-mir-223, mmu-mir-199a-2, mmu-mir-199b, mmu-mir-92a-1, mmu-mir-9-1, mmu-mir-9-3, mmu-mir-181c, mmu-mir-363, mmu-mir-376a, mmu-mir-434, mmu-mir-451a, mmu-mir-463, mmu-mir-487b, mmu-mir-671, mmu-mir-497a, mmu-mir-874, mmu-mir-297a-3, mmu-mir-297a-4, mmu-mir-574, mmu-mir-92b, mmu-mir-21b, mmu-mir-21c, mmu-mir-451b, mmu-mir-497b, mmu-mir-9b-2, mmu-mir-9b-1, mmu-mir-9b-3
Some of the miRNAs (mir-21, mir-34a, mir-27b, mir-9, mir-874, mir-223, mir-144 and mir-153) that were reported to increase in the brain after moderate to severe TBI [20]– [21], [23], [61]– [62] did not show significant modulation in the serum in our experiment.
[score:1]
[1 to 20 of 1 sentences]
|
28 |
![]()
Other miRNAs from this paper: mmu-mir-184, mmu-mir-21a, mmu-mir-7a-1, mmu-mir-7a-2, mmu-mir-7b, mmu-mir-133b, mmu-mir-21b, mmu-mir-21c
This may involve specific individual miRNAs, such as miR-133b, miR-7, miR-184-5p, miR-153, and others, which are implicated in maintaining DA neuronal homeostasis and involved in the pathogenesis of PD 40– 42.
[score:1]
[1 to 20 of 1 sentences]
|
29 |
![]()
Other miRNAs from this paper: cel-let-7, cel-lin-4, cel-mir-49, cel-mir-50, cel-mir-51, cel-mir-71, cel-mir-87, hsa-let-7a-1, hsa-let-7a-2, hsa-let-7a-3, hsa-let-7b, hsa-let-7c, hsa-let-7d, hsa-let-7e, hsa-let-7f-1, hsa-let-7f-2, hsa-mir-92a-1, hsa-mir-92a-2, hsa-mir-100, mmu-let-7g, mmu-let-7i, mmu-let-7d, hsa-let-7g, hsa-let-7i, hsa-mir-153-1, hsa-mir-153-2, mmu-let-7a-1, mmu-let-7a-2, mmu-let-7b, mmu-let-7c-1, mmu-let-7c-2, mmu-let-7e, mmu-let-7f-1, mmu-let-7f-2, mmu-mir-92a-2, mmu-mir-100, mmu-mir-92a-1, hsa-mir-92b, bta-let-7f-2, bta-mir-92a-2, bta-let-7d, bta-let-7g, bta-let-7a-1, bta-let-7f-1, bta-let-7i, bta-let-7a-2, bta-let-7a-3, bta-let-7b, bta-let-7c, bta-let-7e, mmu-mir-92b, bta-mir-100, bta-mir-153-1, bta-mir-153-2, bta-mir-92a-1, bta-mir-92b, sma-let-7, sma-mir-71a, sma-bantam, sma-mir-71b, mmu-let-7j, mmu-let-7k
[2]miR-153-3p is identical to mammalian miR-153-3p from nucleotides 1–21.
[score:1]
[1 to 20 of 1 sentences]
|
30 |
![]()
Other miRNAs from this paper: mmu-mir-124-3, mmu-mir-200a, mmu-mir-214, mmu-mir-221, mmu-mir-124-1, mmu-mir-124-2, mmu-mir-217, mmu-mir-335, mmu-mir-124b
Accumulating evidence demonstrates the close correlation of invasive capacity and metastasis with miRNAs, such as miR-124 in nasopharyngeal carcinoma [33], miR-153 in CRC [34] and miR-335 in lung cancer [35].
[score:1]
[1 to 20 of 1 sentences]
|
31 |
![]()
Other miRNAs from this paper: mmu-mir-9-2, mmu-mir-135a-1, mmu-mir-10b, mmu-mir-184, mmu-mir-191, mmu-mir-302a, mmu-mir-34b, mmu-mir-21a, mmu-mir-26b, mmu-mir-342, mmu-mir-135b, mmu-mir-135a-2, mmu-mir-9-1, mmu-mir-9-3, mmu-mir-335, mmu-mir-532, mmu-mir-302b, mmu-mir-302c, mmu-mir-302d, mmu-mir-721, mmu-mir-343, mmu-mir-449b, mmu-mir-1192, mmu-mir-1970, mmu-mir-21b, mmu-mir-21c, mmu-mir-9b-2, mmu-mir-9b-1, mmu-mir-9b-3
This study reported the potential interplay of miR-9, miR-21, miR-153, and miR-335 miRNAs and their mRNA, illustrating the delicate yet sensitive balance between antagonistic biological cues that may ultimately determine cellular apoptosis or survival and adaptation following ethanol insult.
[score:1]
[1 to 20 of 1 sentences]
|
32 |
![]()
Other miRNAs from this paper: mmu-let-7g, mmu-let-7i, mmu-mir-15b, mmu-mir-27b, mmu-mir-30a, mmu-mir-30b, mmu-mir-124-3, mmu-mir-125a, mmu-mir-125b-2, mmu-mir-128-1, mmu-mir-130a, mmu-mir-9-2, mmu-mir-133a-1, mmu-mir-137, mmu-mir-138-2, mmu-mir-140, mmu-mir-146a, mmu-mir-152, mmu-mir-181a-2, mmu-mir-200b, mmu-mir-204, mmu-mir-206, mmu-mir-143, mmu-mir-30e, mmu-let-7d, mmu-mir-106a, mmu-mir-106b, mmu-mir-130b, mmu-mir-30c-1, mmu-mir-30c-2, mmu-mir-30d, mmu-mir-200a, mmu-let-7a-1, mmu-let-7a-2, mmu-let-7b, mmu-let-7c-1, mmu-let-7c-2, mmu-let-7e, mmu-let-7f-1, mmu-let-7f-2, mmu-mir-15a, mmu-mir-22, mmu-mir-93, mmu-mir-103-1, mmu-mir-103-2, mmu-mir-19a, mmu-mir-181a-1, mmu-mir-218-1, mmu-mir-218-2, mmu-mir-223, mmu-mir-124-1, mmu-mir-124-2, mmu-mir-9-1, mmu-mir-9-3, mmu-mir-138-1, mmu-mir-181b-1, mmu-mir-181c, mmu-mir-125b-1, mmu-mir-128-2, mmu-mir-7a-1, mmu-mir-7a-2, mmu-mir-7b, mmu-mir-133a-2, mmu-mir-133b, mmu-mir-181b-2, mmu-mir-146b, mmu-mir-181d, mmu-mir-133c, mmu-let-7j, mmu-mir-130c, mmu-mir-30f, mmu-let-7k, mmu-mir-9b-2, mmu-mir-124b, mmu-mir-9b-1, mmu-mir-9b-3
Log FC offset P-val (a) P-val (b) hsa-mir-19a Early 125/50.20% −2.485 0.031 1.5023E-05 2.19E-06 hsa-mir-106 Early 156/56.52% −3.929 0.030 2.3594E-05 3.10E-07 hsa-mir-181a Early 125/49.02% −0.242 0.029 0.0001 3.42E-06 miR-93 Early 72/50.35% −3.272 0.030 0.0019 1.78E-05 mmu-mir-153 Early 75/48.08% −0.610 0.036 0.0108 0.0088 hsa-mir-92-1,2 Early 128/55.65% −5.035 0.024 0.0109 0.0001 miR-130 Early 99/57.56% −1.
[score:1]
[1 to 20 of 1 sentences]
|