![]() |
miRBase |
![]() |
![]() |
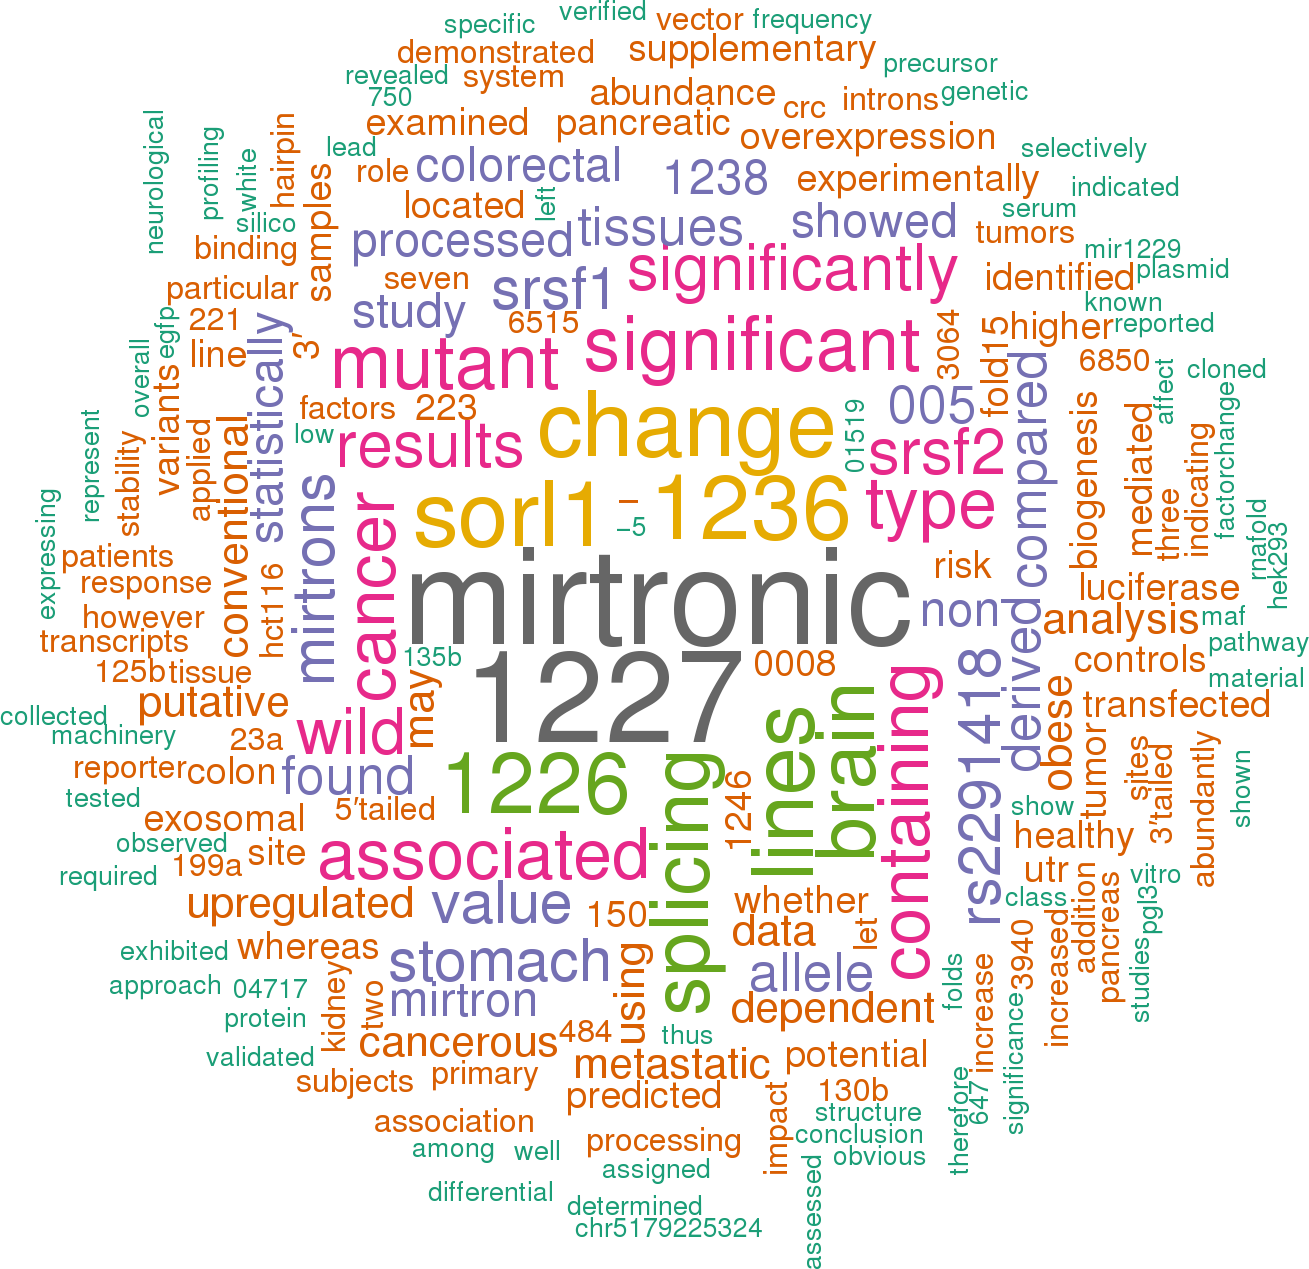
![]() 9 publications mentioning hsa-mir-1229Open access articles that are associated with the species Homo sapiens and mention the gene name mir-1229. Click the [+] symbols to view sentences that include the gene name, or the word cloud on the right for a summary. |
|
1 |
![]()
Other miRNAs from this paper: hsa-mir-204, hsa-mir-205, hsa-mir-212, hsa-mir-214, hsa-mir-320a, hsa-mir-362, hsa-mir-382, hsa-mir-328, hsa-mir-450a-1, hsa-mir-329-1, hsa-mir-329-2, hsa-mir-450a-2, hsa-mir-320b-1, hsa-mir-320c-1, hsa-mir-320b-2, hsa-mir-320d-1, hsa-mir-320c-2, hsa-mir-320d-2, hsa-mir-320e, hsa-mir-219b
An optimal approach would have been to check the co -expression of all potential target genes of miR-1229-3p in brain tissues and examine their correlation with the miRNA expression to distill the potential mediators.
[score:7]
To this end, we compiled a list of all predicted target genes of miR-1229-3p using the two most commonly used miRNA target prediction algorithms (TargetScan and miRanda) (n = 960).
[score:7]
In addition, miRNA expression databases (HMED and miRmine) show that miR-1229-3p is expressed at higher levels in the brain compared to other tissues, indicating an active regulatory role of miR-1229-3p on its target genes in the brain.
[score:7]
We experimentally verified that miR-1229-3p interacts with the predicted target site in the 3′ UTR of SORL1 which is the most significant AD -associated miR-1229-3p target and is abundantly expressed in the human brain.
[score:7]
In addition, our pathway analysis using IPA demonstrated several target genes of miR-1229-3p to be involved in the network of Nervous System Development and Neurological disease (Supplementary material, Table S4).
[score:6]
Subsequently, we found that 750 miR-1229-3p target genes are expressed in the brain, using the Human Body Map 2.0 data.
[score:5]
We selected SORL1, which is the most significant AD -associated target gene of miR-1229-3p, and examined whether the miRNA controls its expression level in vitro.
[score:5]
We assessed the association of genetic variants in the 750 brain-expressed target genes of miR-1229-3p with AD.
[score:5]
These data indicate that miR-1229-3p directly controls the expression of SORL1 in the brain.
[score:4]
Association of miR-1229-3p target genes with AD.
[score:3]
Our miRNA expression experiments further showed that the mutant allele enhances the stability or processing of mature miR-1229-3p.
[score:3]
Supplementary Table S3 shows ten target genes of miR-1229-3p with the most significant association with AD.
[score:3]
To this end, HEK293 cells were transfected with pMCSV vectors expressing transcripts with EGFP and wild type or mutant pre-miR-1229.
[score:3]
We generated expression vector containing the pre-miR-1229-3p sequence and co -transfected the construct with Luciferase reporters containing the 3′ UTR (wild-type or mutant miR-1229-3p binding site) of SORL1.
[score:3]
Multiple miR-1229-3p target genes were associated with AD.
[score:3]
We assessed which target genes of miR-1229-3p are implicated in pathways in nervous system or neurological disorders and may have a role in developing AD.
[score:3]
HEK293 cells were plated into 96-well plates and co -transfected with MSCV-miR-1229, pGL3 vector containing the SORL1 3′ UTR and a plasmid expressing the Renilla transfection control.
[score:3]
Thus, we checked the expression of miR-1229-3p in the brain.
[score:3]
Our data showed that miR-1229-3p is abundantly expressed (average Ct-value: 28.8) in both white and gray matter of the human brain (Supplementary material, Table S2).
[score:3]
We examined the expression of miR-1229-3p in the human brain.
[score:3]
We revealed miR-1229-3p target genes that are associated with AD.
[score:3]
We cloned the pre-miR-1229 sequence containing either the wild type or mutant allele behind the gene encoding green fluorescent protein (GFP) in the expression plasmid MSCV-BC (Murine Stem Cell Virus-Bar Coded) 53, resulting in GFP-miRNA fusion transcripts.
[score:3]
The impact of rs2291418 on miR-1229 structure and expression.
[score:3]
We found that rs2291418 in the miR-1229 precursor, a miRNA which is abundantly expressed in the brain, is associated with the risk of AD.
[score:3]
The effect of rs2291418 on the expression level of miR-1229-3p.
[score:3]
Therefore, a higher expression level of miR-1229-3p in rs2291418 mutant allele carriers may reduce SORL1 level and subsequently increase AD risk.
[score:3]
To experimentally show the impact of rs2291418 on the pre-miR-1229 processing, we examined the expression levels of mature miR-1229 with the wild type and mutant pre-miRNA sequences.
[score:3]
miR-1229-3p -mediated regulation of SORL1.
[score:2]
In addition, this experiment showed a dose -dependent regulation of SORL1 by miR-1229-3p (Supplementary Fig. S2).
[score:2]
These data strongly suggest for miR-1229-3p -mediated regulation of SORL1 in the human brain.
[score:2]
Our in silico and in vitro analyses showed miR-1229-3p -mediated regulation of SORL1, which is a well-known gene involved in AD.
[score:2]
The expression level of miR-1229-3p was determined with TaqMan MicroRNA Assay according to manufacturer’s protocol (Applied Biosystems, Foster City, CA, USA).
[score:2]
We found that over -expression of miR-1229-3p significantly decreases the Luciferase activity of the reporter containing the wild type SORL1 fragment, compared to the mutated SORL1 reporter (p-value = 0.003) (Fig. 4).
[score:2]
miR-1229-3p -mediated regulation of SORL1.
[score:2]
The pre-miR-1229 is precursor of two mature miRNAs (miR-1229-3p and miR-1229-5p), however, the 3p miRNA has been shown to be the predominant product 31.
[score:1]
We generated the pre-miR-1229 hairpin structures containing the rs2291418 wild-type (G) and mutant (A) allele using the Vienna RNAfold algorithm 24.
[score:1]
Schematic view of the RNAfold predicted secondary structures of the pre-miR-1229 containing either the wild type or the mutant allele.
[score:1]
Out of 237 variants located in 206 miRNAs, we found rs2291418 (Chr5:179225324, A > G), a low-frequency variant (MAF = 0.02) in the pre-miR-1229 sequence, to be significantly associated with the risk of AD (p-value = 6.8 × 10 [−5] and OR = 1.2).
[score:1]
In silico analysis indicated that the mutant allele improves the stability of the hairpin structure of pre-miR-1229.
[score:1]
This analysis indicated that the variant’s mutant allele may enhance the stability of the pre-miR-1229 hairpin, suggesting an improvement of the pre-miRNA processing into the mature miR-1229.
[score:1]
A polymorphism in miR-1229 was associated with AD.
[score:1]
The SORL1 3′ UTR sequences (wild-type and mutated), containing the putative binding site of miR-1229-3p, were amplified and cloned into the pGL3 luciferase reporter vector downstream of the Luciferase open reading frame (Promega).
[score:1]
Both the pre-miR-1229 wild type and pre-miR-1229 mutant transfected cells had equal levels of the EGFP-miRNA transcripts.
[score:1]
A flow chart of our approach to detect genetic variants within miRNAs and miRNA -binding sites that are associated with AD is shown in Fig. 1. Out of 237 variants located in 206 miRNAs, we found rs2291418 (Chr5:179225324, A > G), a low-frequency variant (MAF = 0.02) in the pre-miR-1229 sequence, to be significantly associated with the risk of AD (p-value = 6.8 × 10 [−5] and OR = 1.2).
[score:1]
[1 to 20 of 44 sentences]
|
2 |
![]()
Other miRNAs from this paper: hsa-let-7a-1, hsa-let-7a-2, hsa-let-7a-3, hsa-mir-15a, hsa-mir-18a, hsa-mir-7-1, hsa-mir-7-2, hsa-mir-7-3, hsa-mir-1-2, hsa-mir-15b, hsa-mir-1-1, hsa-mir-1224, hsa-mir-877, hsa-mir-887, hsa-mir-1226, hsa-mir-1227, hsa-mir-1236, hsa-mir-1238, hsa-mir-3605, hsa-mir-3940, hsa-mir-4728, hsa-mir-3064, hsa-mir-6515, hsa-mir-6850
*Statistically significant results, p < 0.05 Table 4 Change of mirtronic miRNA expression levels in response to the overexpression of splicing factors Overexpressed splicing factorChange of mirtronic miRNA expression levels, folds (p value) miR-1226 miR-1227 miR-1229 SRSF1 (3.2 ± 0.6-fold)1.5 ± 0.6 (p = 0.23)−1.1 ± 0.4 (p = 0.47)1.7 ± 0.4 [a] (p = 0.05) SRSF2 (1.6 ± 0.5-fold)1.5 ± 0.8 (p = 0.15)1.9 ± 0.7 [a] (p = 0.008)1.4 ± 0.3 [a] (p = 0.008) A significance level of 0.05 was applied as a cutoff value [a]Statistically significant results Overall, our results lead to a conclusion that altered expression of a particular SF may affect the levels of mirtronic miRNAs in the cell.
[score:11]
Whereas a significant upregulation of SRSF2 -dependent expression was observed for hsa-miR-1227-3p (p = 0.008) and miR-1229-3p (p = 0.008), the hsa-miR-1226-3p did not exhibit statistically different (p = 0.15) expression levels between the HCT116 line and the line overexpressing the SRSF2 SF (Fig. 4b, the diagram at the right).
[score:10]
Remarkably, hsa-mir-1229-3p is upregulated in cell lines derived from metastatic sites and downregulated in primary tumor lines.
[score:7]
Our results revealed that increased nuclear levels of SRSF1 in tested HCT116 cells significantly enhanced the hsa-miR-1229-3p expression, while upregulated SRSF2 increased the abundance of the mirtronic miRNAs hsa-miR-1227-3p and hsa-miR-1229-3p.
[score:6]
Remarkably, hsa-mir-1229-3p, which was upregulated in the metastatic site-derived cell lines, exhibited no expression change in the primary tumors.
[score:6]
These findings are in agreement with the observation that the overexpression of SRSF1 had the largest impact on the expression of hsa-miR-1229-3p, whereas SRSF2 on hsa-miR-1227-3p.
[score:5]
White vertical boxplots represent data from healthy tissues; gray from tumors Table 3 Expression of mirtronic miRNAs in colorectal, stomach, and pancreatic cancerous tissues compared to healthy tissues Cancerous tissue miRNAs of mirtron origin Non-mirtronic miRNA miR-1226-3p miR-1227-3p miR-1229-3p miR-1236-3p miR-1238-3p Colorectal − No change No change No change No change Stomach + No change No change No change No change Pancreatic No change − No change − No changeData were considered significant for p < 0.05 − reduced expression compared to the non-cancerous tissue, + increased expression Despite a considerable progress in the study of biogenesis of mirtron-derived miRNAs, the factors responsible for mirtronic intron splicing are not known.
[score:4]
However, further studies are required to ascertain whether hsa-miR-1229-3p is selectively upregulated in metastatic tumor tissues.
[score:4]
In particular, hsa-miR-1229-3p is selectively upregulated in the pancreatic and stomach cancer cell lines derived from metastatic sites.
[score:4]
Concomitant evaluation of the miRNA expression levels by RT-qPCR showed a statistically significant increase of hsa-miR-1229-3p but not hsa-miR-1226-3p or hsa-miR-1227-3p in response to SRSF1 overexpression (Fig. 4b, the diagram at the left, and Table 4).
[score:3]
The expression levels of hsa-miR-1226-3p, hsa-miR-1227-3p, hsa-miR-1229-3p, and hsa-miR-1236-3p dramatically decreased and comprised less than 5 % of the levels observed for the WT minigenes (Table 1).
[score:3]
Correlations were found between the hsa-miR-1229-3p expression pattern and tissue origin — a steep increase in the mirtronic miRNA abundance was detected in three lines (SU.
[score:3]
86.86, T3M4, stomach KATOIII, colon HCT116) or the excretory system (kidney CaKi-1, 786-O) were chosen to define whether the expression of the human mirtronic miRNAs hsa-miR-1226-3p, hsa-miR-1227-3p, hsa-miR-1229-3p, and hsa-miR-1236-3p and canonical hsa-miR-1238-3p varies between the cancerous cells.
[score:3]
For example, no obvious differences in abundance of hsa-miR-1229-3p were seen among samples collected from the pancreas, colon, or stomach, notwithstanding a ~14-fold under -expression of SRSF1 and a sevenfold of SRSF2 in the colorectal and stomach cancerous tissues.
[score:3]
Dendrogram of hierarchy clustering analysis is presented at the left Table 2 Differential expression of mirtronic miRNAs in pancreas, kidney, colon, and stomach cancer cell lines Organ Cell line miRNAs of mirtron origin Non-mirtronic miRNA miR-1226-3p miR-1227-3p miR-1229-3p miR-1236-3p miR-1238-3p Pancreas PANC-1−2.8 ± 1.8 [a] −1.7 ± 0.3 [a] −2.8 ± 0.9 [a] −1.4 ± 0.2 −1.2 ± 0.6 SU.
[score:3]
The miRNA variability in cancer cell lines was determined by changes in abundance of two mirtronic miRNAs, hsa-miR-1229-3p and hsa-miR-1236-3p, while the expression levels of hsa-miR-1226-3p and hsa-miR-1227-3p declined in all tested cancer cell lines compared to those in HEK 293A.
[score:2]
In the present study, we experimentally proved that hsa-miR-1227-3p, hsa-miR-1229-3p, and hsa-miR-1236-3p derived from conventional mirtrons are processed by the splicing machinery.
[score:1]
Schemes represent protein-coding genes, harboring reside-verified mirtronic miRNA hsa-miR-1226-3p, putative conventional mirtronic miRNAs hsa-miR-1227-3p, hsa-miR-1229-3p, and hsa-miR-1238-3p, mirtronic miRNAs, located in 5′-tailed mirtrons hsa-miR-3064-5p and hsa-miR-6515-5p and mirtronic miRNAs, located in 3′-tailed mirtrons hsa-miR-3940-5p and hsa-miR-6850-5p.
[score:1]
In contrast, hsa-miR-1229-3p and hsa-miR-1236-3p showed significant variations among cancer cell lines and have a potential to be exploited for profiling specific cancer cell types.
[score:1]
In this study, we experimentally validated three novel splicing -dependent miRNAs processed from mirtrons, hsa-miR-1227-3p, hsa-miR-1229-3p, and hsa-miR-1236-3p.
[score:1]
We found that biogenesis of the human hsa-miR-1227-3p, hsa-miR-1229-3p, and hsa-miR-1236-3p is splicing -dependent; therefore, these miRNAs can be assigned to the class of miRNAs processed by a non-canonical mirtron pathway.
[score:1]
In this study, cell line-specific profiles of miRNAs processed from conventional mirtrons, hsa-miR-1226-3p, hsa-miR-1227-3p, hsa-miR-1229-3p, and hsa-miR-1236-3p, in seven various pancreatic, kidney, colorectal, and stomach cancer cell lines were identified (Table 2).
[score:1]
In this study, we examined eight putative mirtrons and provided experimental evidence that human hsa-miR-1227-3p, hsa-miR-1229-3p, and hsa-miR-1236-3p could be assigned to the class of mirtronic miRNAs.
[score:1]
These results convincingly confirmed that the biogenesis of hsa-miR-1226-3p, hsa-miR-1227-3p, hsa-miR-1229-3p, and hsa-miR-1236-3p is strictly splicing -dependent, thus the efficiency of the splicing machinery defines the quantity of these miRNAs.
[score:1]
Putative human conventional mirtron-derived hsa-miR-1227-3p, hsa-miR-1229-3p, hsa-miR-1236-3p, and hsa-miR-1238-3p [15] and 3′-tailed mirtron-derived hsa-miR-3940-5p and hsa-miR-6850-5p were identified in short 69–102 nucleotide introns, whereas hsa-miR-3064-5p and hsa-miR-6515-5p were processed from both long (1236 nt) and short (88 nt) 5′-tailed mirtrons [12].
[score:1]
A bioinformatic analysis of the splicing signals using the Human Splicing Finder online tool [27] identified putative consensus motifs typical for SRSF1 and SRSF2 in exons proximal to hsa-miR1227- and hsa-miR1229-containing introns, respectively (Additional file 1: Figure S3).
[score:1]
However, further studies are required to assess whether miR-1229-3p is associated with the metastatic potential of human tumors.
[score:1]
Finally, we demonstrated that the SRSF1 and SRSF2 SFs contribute to the biogenesis of mirtronic hsa-miR-1227-3p and hsa-miR-1229-3p.
[score:1]
Introns containing validated mirtronic miRNA hsa-mir-1226-3p or predicted miRNAs hsa-mir-1227-3p, hsa-mir-1229-3p, hsa-mir-1236-3p, and hsa-mir-1238-3p processed from conventional; hsa-miR-3064-5p and hsa-miR-6515-5p from 5′-tailed; and hsa-miR-3940-5p and hsa-miR-6850-5p from 3′-tailed mirtrons are depicted as red lines.
[score:1]
[1 to 20 of 30 sentences]
|
3 |
![]()
Other miRNAs from this paper: hsa-let-7c, hsa-mir-15a, hsa-mir-16-1, hsa-mir-22, hsa-mir-23a, hsa-mir-26a-1, hsa-mir-26b, hsa-mir-27a, hsa-mir-29a, hsa-mir-30a, hsa-mir-31, hsa-mir-95, hsa-mir-98, hsa-mir-99a, hsa-mir-100, hsa-mir-101-1, hsa-mir-29b-1, hsa-mir-29b-2, hsa-mir-103a-2, hsa-mir-103a-1, hsa-mir-107, hsa-mir-16-2, hsa-mir-196a-1, hsa-mir-199a-1, hsa-mir-148a, hsa-mir-30c-2, hsa-mir-30d, hsa-mir-139, hsa-mir-10a, hsa-mir-10b, hsa-mir-34a, hsa-mir-196a-2, hsa-mir-199a-2, hsa-mir-210, hsa-mir-221, hsa-mir-222, hsa-mir-224, hsa-let-7i, hsa-mir-27b, hsa-mir-30b, hsa-mir-125b-1, hsa-mir-130a, hsa-mir-137, hsa-mir-140, hsa-mir-143, hsa-mir-145, hsa-mir-125a, hsa-mir-125b-2, hsa-mir-185, hsa-mir-195, hsa-mir-155, hsa-mir-29c, hsa-mir-30c-1, hsa-mir-101-2, hsa-mir-130b, hsa-mir-30e, hsa-mir-26a-2, hsa-mir-365a, hsa-mir-365b, hsa-mir-376c, hsa-mir-378a, hsa-mir-337, hsa-mir-196b, hsa-mir-424, hsa-mir-450a-1, hsa-mir-484, hsa-mir-494, hsa-mir-450a-2, hsa-mir-503, hsa-mir-455, hsa-mir-378d-2, hsa-mir-103b-1, hsa-mir-103b-2, hsa-mir-378b, hsa-mir-378c, hsa-mir-378d-1, hsa-mir-378e, hsa-mir-378f, hsa-mir-378g, hsa-mir-378h, hsa-mir-378i, hsa-mir-378j
Of note, miR-185, miR-139-5p, miR-484, and miR-130b were down-regulated in obese without DM-2 when compared to non-obese subjects while the expression of miR-99a, miR-1229, miR-125b, miR-221 and miR-199a-5p was up-regulated [Figure 4A and Table S2].
[score:8]
In obese subjects with DM-2, the expression of miR-K12-7, miR-484 and miR-130b, was down-regulated, while miR-1229, miR-199a-5p, miR-221 and miR-125b, were up-regulated compared with non-obese subjects [Figure 4B and Table S2].
[score:8]
[1 to 20 of 2 sentences]
|
4 |
![]()
The results exhibited miR-647 was significantly up-regulated in ox-LDL treated VSMCs, whereas no obvious change in miR-135b and miR-1229 (n = 3, P < 0.05) (Fig. 5A).
[score:4]
Three miRNAs, miR-135b, miR-647 and miR-1229 were selected as candidate targets of APPAT (Table S5).
[score:3]
[1 to 20 of 2 sentences]
|
5 |
![]()
Other miRNAs from this paper: hsa-let-7a-1, hsa-let-7a-2, hsa-let-7a-3, hsa-mir-21, hsa-mir-23a, hsa-mir-27a, hsa-mir-30a, hsa-mir-30c-2, hsa-mir-139, hsa-mir-223, hsa-mir-125b-1, hsa-mir-141, hsa-mir-142, hsa-mir-9-1, hsa-mir-125a, hsa-mir-125b-2, hsa-mir-150, hsa-mir-30c-1, hsa-mir-30e, hsa-mir-376c, hsa-mir-375, hsa-mir-376a-1, hsa-mir-381, hsa-mir-376b, hsa-mir-376a-2, hsa-mir-320c-1, hsa-mir-543, hsa-mir-1246, hsa-mir-320d-1, hsa-mir-320c-2, hsa-mir-320d-2
Exosomal miR-1229, miR-1246, miR-150, miR-21, miR-223, and miR-2a are reported to be significantly up-regulated in CRC patients [13].
[score:4]
Another study demonstrated that the serum exosomal levels of seven miRNAs (let-7a, miR-1229, miR-1246, miR-150, miR-21, miR-223, and miR-23a) were significantly higher in CRC patients [13].
[score:1]
[1 to 20 of 2 sentences]
|
6 |
![]()
Other miRNAs from this paper: hsa-let-7a-1, hsa-let-7a-2, hsa-let-7a-3, hsa-mir-15a, hsa-mir-16-1, hsa-mir-17, hsa-mir-21, hsa-mir-23a, hsa-mir-30a, hsa-mir-92a-1, hsa-mir-92a-2, hsa-mir-100, hsa-mir-105-1, hsa-mir-105-2, hsa-mir-106a, hsa-mir-16-2, hsa-mir-192, hsa-mir-139, hsa-mir-203a, hsa-mir-205, hsa-mir-210, hsa-mir-212, hsa-mir-214, hsa-mir-222, hsa-mir-223, hsa-mir-200b, hsa-mir-15b, hsa-mir-133a-1, hsa-mir-133a-2, hsa-mir-143, hsa-mir-191, hsa-mir-146a, hsa-mir-150, hsa-mir-154, hsa-mir-200c, hsa-mir-155, hsa-mir-200a, hsa-mir-378a, hsa-mir-379, hsa-mir-151a, hsa-mir-133b, hsa-mir-484, hsa-mir-486-1, hsa-mir-146b, hsa-mir-629, hsa-mir-151b, hsa-mir-1246, hsa-mir-203b, hsa-mir-486-2
Exosomal let-7a, miR-1229, miR-1246, miR-150, miR-21, miR-223 and miR-23a from colorectal tumor samples and cancer cell lines are more highly expressed than those from healthy controls samples and normal colon cell lines, and the expression levels of these miRNAs are significantly decreased in exosomes samples collected after tumor resection, indicating the cancer status (121).
[score:5]
[1 to 20 of 1 sentences]
|
7 |
![]()
Other miRNAs from this paper: hsa-let-7a-1, hsa-let-7a-2, hsa-let-7a-3, hsa-let-7b, hsa-let-7c, hsa-let-7d, hsa-let-7e, hsa-let-7f-1, hsa-let-7f-2, hsa-mir-15a, hsa-mir-21, hsa-mir-23a, hsa-mir-26b, hsa-mir-27a, hsa-mir-93, hsa-mir-103a-2, hsa-mir-103a-1, hsa-mir-107, hsa-mir-199a-1, hsa-mir-148a, hsa-mir-181a-2, hsa-mir-199a-2, hsa-mir-210, hsa-mir-181a-1, hsa-mir-221, hsa-mir-222, hsa-let-7g, hsa-let-7i, hsa-mir-30b, hsa-mir-125b-1, hsa-mir-132, hsa-mir-143, hsa-mir-152, hsa-mir-125b-2, hsa-mir-155, hsa-mir-106b, hsa-mir-130b, hsa-mir-365a, hsa-mir-365b, hsa-mir-378a, hsa-mir-335, hsa-mir-424, hsa-mir-484, hsa-mir-146b, hsa-mir-378d-2, hsa-mir-1268a, hsa-mir-1275, hsa-mir-103b-1, hsa-mir-103b-2, hsa-mir-1908, hsa-mir-378b, hsa-mir-378c, hsa-mir-1268b, hsa-mir-378d-1, hsa-mir-378e, hsa-mir-378f, hsa-mir-378g, hsa-mir-378h, hsa-mir-378i, hsa-mir-378j
Ortega et al. [18] identified that miR-484 and miR-130b were lowly expressed in human subcutaneous adipose from obese and type 2 diabetes mellitus (DM), miR-199a-5p, miR-221, miR-125b and miR-1229 were lowly expressed, indicating that these miRNAs play a key role in obesity.
[score:5]
[1 to 20 of 1 sentences]
|
8 |
![]()
Other miRNAs from this paper: hsa-mir-30b, hsa-mir-141, hsa-mir-125a, hsa-mir-193a, hsa-mir-483, hsa-mir-92b, hsa-mir-1915, hsa-mir-4521
Following co-culture with LGG or LGG with B. caccae grown under anaerobic conditions, miRNA profiling highlighted differential regulation of a vast number of miRNAs (mir483-3p, mir1229-3p, mir92b, mir1915, mir30b-5p, mir4521, mir193a-5p, mir125a-5p and mir141-3p) linked to colorectal cancer (Fig. 6).
[score:2]
[1 to 20 of 1 sentences]
|
9 |
![]()
Other miRNAs from this paper: hsa-let-7a-1, hsa-let-7a-2, hsa-let-7a-3, hsa-let-7b, hsa-let-7e, hsa-mir-15a, hsa-mir-16-1, hsa-mir-17, hsa-mir-18a, hsa-mir-19a, hsa-mir-19b-1, hsa-mir-19b-2, hsa-mir-20a, hsa-mir-21, hsa-mir-22, hsa-mir-23a, hsa-mir-24-1, hsa-mir-24-2, hsa-mir-25, hsa-mir-27a, hsa-mir-30a, hsa-mir-92a-1, hsa-mir-92a-2, hsa-mir-99a, hsa-mir-100, hsa-mir-101-1, hsa-mir-103a-2, hsa-mir-103a-1, hsa-mir-106a, hsa-mir-16-2, hsa-mir-192, hsa-mir-196a-1, hsa-mir-199a-1, hsa-mir-148a, hsa-mir-10a, hsa-mir-196a-2, hsa-mir-199a-2, hsa-mir-203a, hsa-mir-215, hsa-mir-221, hsa-mir-222, hsa-mir-223, hsa-mir-200b, hsa-mir-1-2, hsa-mir-15b, hsa-mir-27b, hsa-mir-122, hsa-mir-125b-1, hsa-mir-133a-1, hsa-mir-133a-2, hsa-mir-141, hsa-mir-143, hsa-mir-145, hsa-mir-152, hsa-mir-191, hsa-mir-125a, hsa-mir-125b-2, hsa-mir-126, hsa-mir-127, hsa-mir-146a, hsa-mir-150, hsa-mir-185, hsa-mir-194-1, hsa-mir-195, hsa-mir-320a, hsa-mir-200c, hsa-mir-1-1, hsa-mir-155, hsa-mir-128-2, hsa-mir-194-2, hsa-mir-200a, hsa-mir-101-2, hsa-mir-130b, hsa-mir-302c, hsa-mir-375, hsa-mir-378a, hsa-mir-148b, hsa-mir-324, hsa-mir-451a, hsa-mir-483, hsa-mir-484, hsa-mir-486-1, hsa-mir-500a, hsa-mir-92b, hsa-mir-595, hsa-mir-596, hsa-mir-421, hsa-mir-378d-2, hsa-mir-744, hsa-mir-885, hsa-mir-939, hsa-mir-940, hsa-mir-1233-1, hsa-mir-1290, hsa-mir-1246, hsa-mir-103b-1, hsa-mir-103b-2, hsa-mir-718, hsa-mir-378b, hsa-mir-378c, hsa-mir-4306, hsa-mir-4286, hsa-mir-500b, hsa-mir-1233-2, hsa-mir-3935, hsa-mir-642b, hsa-mir-378d-1, hsa-mir-378e, hsa-mir-378f, hsa-mir-378g, hsa-mir-378h, hsa-mir-378i, hsa-mir-3976, hsa-mir-4644, hsa-mir-203b, hsa-mir-451b, hsa-mir-378j, hsa-mir-486-2
Ogata-Kawata reported that the serum exosomal levels of seven miRNAs (let-7a, miR-1229, miR-1246, miR-150, miR-21, miR-223, and miR-23a) were significantly higher in primary CRC patients, even those with early stage, than in healthy controls.
[score:1]
[1 to 20 of 1 sentences]
|