![]() |
miRBase |
![]() |
![]() |
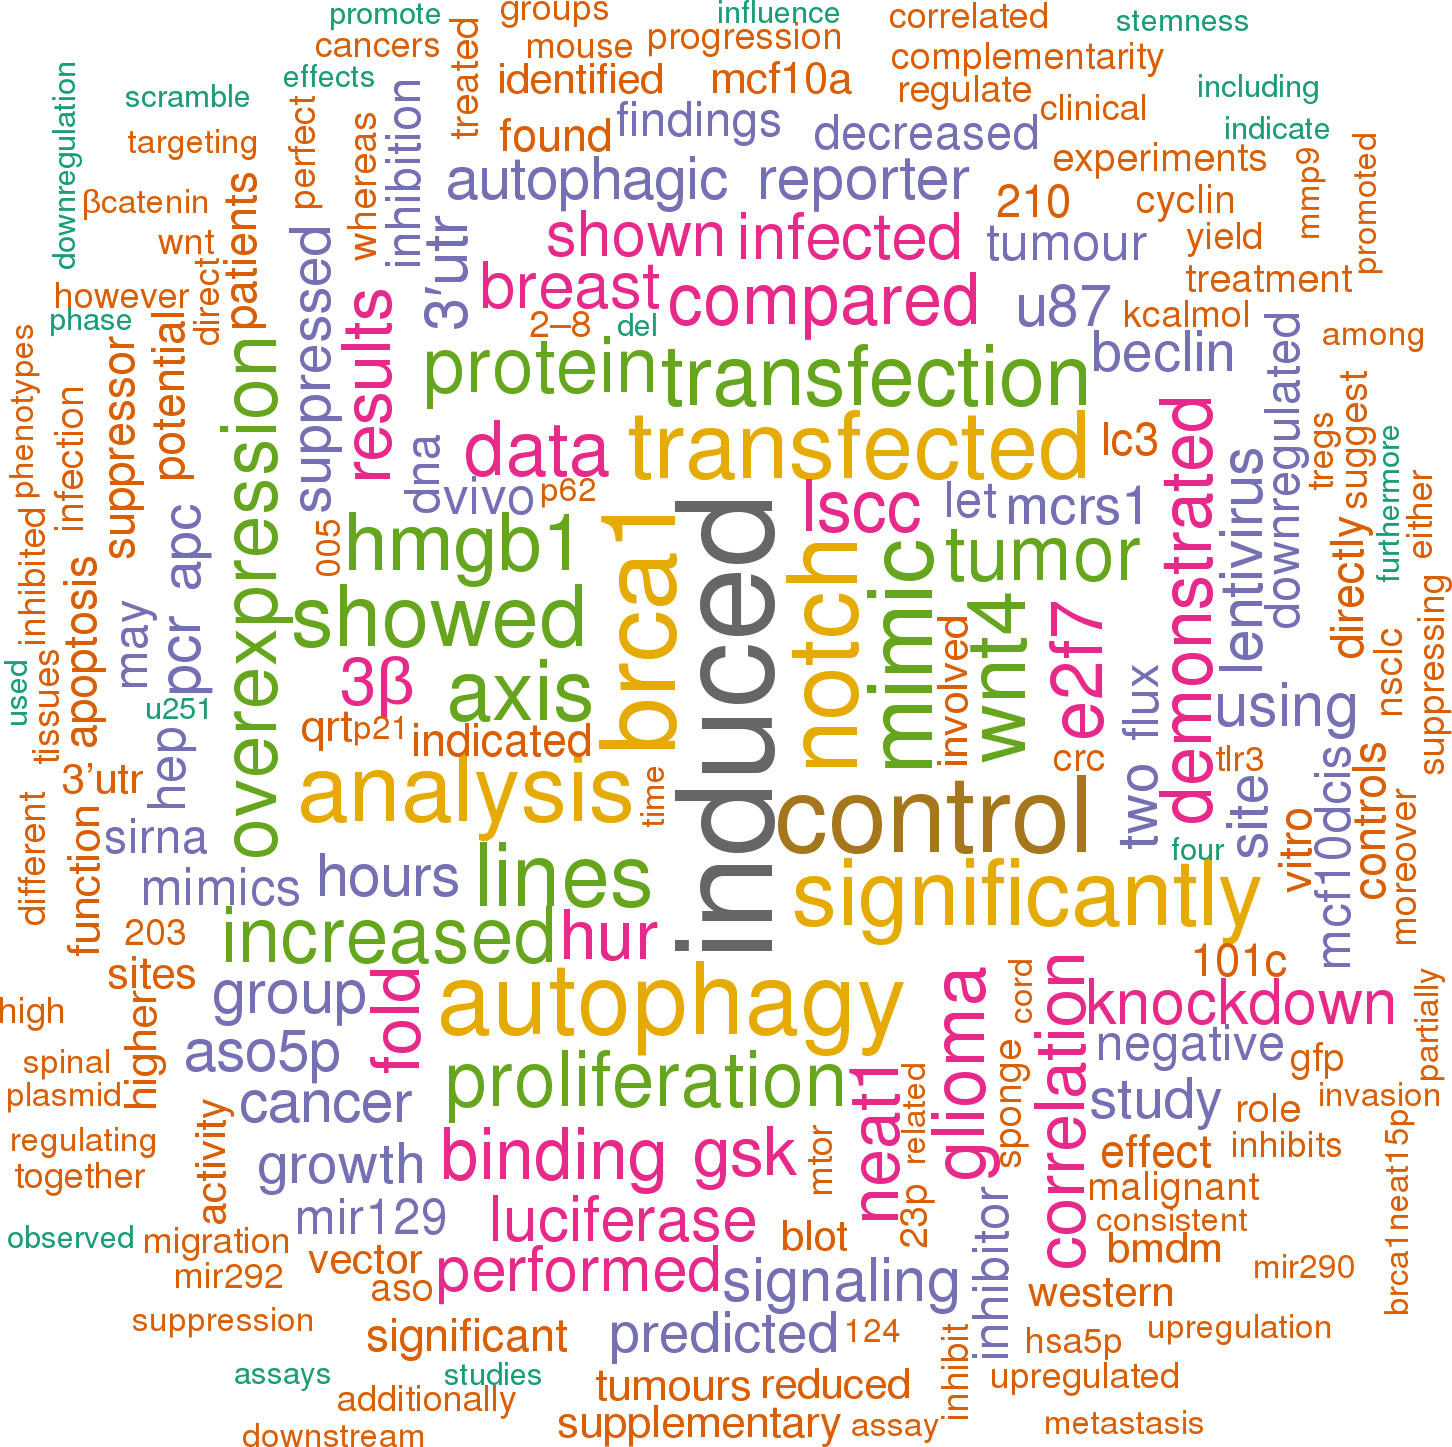
![]() 52 publications mentioning mmu-mir-129-1Open access articles that are associated with the species Mus musculus and mention the gene name mir-129-1. Click the [+] symbols to view sentences that include the gene name, or the word cloud on the right for a summary. |
|
1 |
![]()
Other miRNAs from this paper: mmu-mir-206, mmu-mir-21a, mmu-mir-129-2, mmu-mir-21b, mmu-mir-21c, mmu-mir-129b
Down-regulation of miR-129-5p suppressed both proliferation and migration of tumour cells while down-regulation also increased apoptosis of tumour cells.
[score:9]
In this study, we showed that down-regulation of miR-129-5p lowered levels of c-myc both in vivo and in vitro suggesting that miR-129-5p could be targeted to regulate c-myc indirectly.
[score:8]
Wu et al showed that cyclin -dependent kinase 6 (Cdk6), a kinase involved in G1-S transition, is a direct target of miR-129 and downregulation of Cdk6 by miR-129 plays an important role in regulating cell proliferation in lung epithelial derived cells [22].
[score:8]
We identified APC as a direct target gene of miR-129-5p using a luciferase reporter assay and showed that down-regulation of miR-129-5p induced greater APC expression both in vitro and in vivo.
[score:8]
miR-129-1 is frequently detected in solid tumours [11–17and despite that its expression is down-regulated in some types of cancers [12], [14]– [16], its expression is elevated in LSCC [18]– [20].
[score:8]
miR-129-5p directly targets APC-mRNA at 3′-UTR and protein expression of genes regulated by miR-129-5p.
[score:7]
Down-regulation of miR-129 through methylation was correlated with upregulation of the SRY-related high-mobility group box 4 (SOX4) in gastric cancers [14].
[score:7]
Histone acetylation is intimately related to miRNA expression and consequently histone deacetylase inhibitors (HDACi) such as 4-phenylbutyric acid (PBA) could alter miR-129 expression.
[score:7]
Liu et al demonstrated that down-regulation of VCP by microRNA-129-5p could suppress the genesis and progression of hepatocellularcarcinoma [16].
[score:6]
We demonstrated that miR-129-5p regulates APC by inhibiting its expression.
[score:6]
Down-regulation of miR-129-5p inhibits the growth of LSCC xenografts in nude mice.
[score:6]
In conclusion, miR-129-5p expression was upregulated in human LSCC.
[score:6]
This likely explains the suppressed proliferation and migration capabilities of Hep-2 cells following miR-129-5p down-regulation by ASO.
[score:6]
Together, these data suggest that miR-129-5p has an oncogenic role in LSCC and that it directly inhibits the tumour suppressor APC and allows increased Wnt signalling to occur.
[score:6]
Accordingly, greater numbers of Hep-2 cells were observed to remain in the G1 phase after down-regulation of miR-129-5p expression by ASO.
[score:6]
For example, miR-129 expression is high in human oesophageal squamous cell carcinomas (ESCC) and retinoblastomas [11], [12], but is down-regulated in human bladder tumours, gastric cancers, paediatric brain tumours, and hepatocellular carcinomas [13], [14]– [16].
[score:6]
We showed that down-regulation of miR-129-5p by ASO-miR-129-5p transfection lowered cyclin D1 expression in LSCC both in vivo and in vitro.
[score:6]
In consideration of negative regulation of miRNA, we notice APC, a tumour suppressor, among these potential targets for miR-129-5p.
[score:6]
We demonstrate that down-regulation of miR-129-5p in Hep-2 cells by transfecting ASO specific to miR-129-5p significantly suppressed cell proliferation and migration.
[score:6]
Patients with higher miR-129-5p expression had higher-grade tumours, lymph node metastases, or more advanced clinical disease.
[score:5]
Patients with higher expression of miR-129-5p also had advanced clinical-stage disease, T3-T4 grades, and lymph node metastases.
[score:5]
Therefore, to validate the oncogenic function of miR-129-5p, a tumour suppressor target needed to be identified.
[score:5]
Down-regulation of miR-129-5p in Hep-2 cells transfected with the ASO-miR129-5p lentivirus led to higher levels of APC expression compared to cells transfected with the GFP-lentivirus or untransfected cells (P<0.05) (Fig. 5 D–F).
[score:5]
In addition, we observed that down-regulation of miR-129-5p in Hep-2 cells caused the increased number of G0/G1-phase cells and the reduced number of S-phase cells as compared to in the control cells, implying the suppression effect of cell proliferation induced by transfection of ASO-miR-129-5p in Hep-2 cells.
[score:5]
There were no differences between genders regarding miR-129-5p expression, but higher miR-129-5p expression in LSCC tumours was positively correlated with T grade, lymph node metastasis, and clinical staging.
[score:5]
The PCR results confirmed that the ASO-miR-129-5p construct effectively suppressed miR-129-5p expression in Hep-2 cells (P<0.05; Fig. 1A).
[score:5]
We demonstrated in this study that miR-129-5p expression was significantly upregulated in LSCC tumour specimens compared to adjacent non-cancerous tissues in human patients.
[score:5]
Down-regulation of miR-129-5p reduces Hep-2 cell proliferation in vitro.
[score:4]
ASO-miR-129-5p down-regulates miR-129-5p in Hep-2 cells.
[score:4]
Down-regulation of miR-129-5p affected the progression of cell cycle in Hep-2 cells.
[score:4]
Site-directed mutagenesis of the miR-129-5p target site in the APC-3′-UTR was used as a negative control and termed Mut-3′-UTR.
[score:4]
ASO-miR-129-5p down-regulates miR-129-5p and reduces proliferation and migration of Hep-2 cells.
[score:4]
In contrast however, miR-129 is also upregulated in several solid tumours and non-cancerous tissues from cancer patients with lymph node metastases [11], [12], [21].
[score:4]
These data together strongly suggest that down-regulation of miR-129-5p induces apoptosis in LSCC cells.
[score:4]
Down-regulation of miR-129-5p significantly affected the progression of cell cycle in Hep-2 cells.
[score:4]
We found that miR-129-5p was significantly upregulated in LSCC and closely correlated with clinical pathological findings of patients.
[score:4]
Down-regulation of miR-129-5p reduces motility of Hep-2 cells in vitro.
[score:4]
Treating a breast cancer cell line with a pro-apoptotic dose of HDACi caused upregulation of miR-129 [20].
[score:4]
Down-regulation of miR-129-5p enhances apoptosis of LSCC.
[score:4]
Our findings suggest that miR-129-5p may stimulate oncogenesis in LSCC by targeting APC and altering the Wnt signalling pathway.
[score:3]
Relationship between miR-129-5p expression levels and clinical pathology in LSCC patients.
[score:3]
We have predicted several potential target candidates for miR-129-5p.
[score:3]
Studies have shown that several miRNAs, including miR-129, are differentially expressed in HPV-infected cells and cell lines [9], [10].
[score:3]
ASO-miR-129-5p inhibits the growth of LSCC tumours in vivo.
[score:3]
Immunohistochemical staining showed greater levels of cytoplasmic APC in cells treated with the ASO-miR129-5p-lentivirus while cells in GFP-lentivirus group or untransfected group showed only weak expression (Fig. 6A).
[score:3]
These findings suggest that miR-129 functions as a tumour suppressor in some cancers.
[score:3]
0077829.g005 Figure 5(A) The predicted miR-129-5p target site on the APC 3′-UTR.
[score:3]
0077829.g004 Figure 4ASO-miR-129-5p inhibits the growth of LSCC tumours in vivo.
[score:3]
Restoration of miR-129 in cancer cells by pharmacological induction of histone acetylation and DNA demethylation resulted in decreased SOX4 expression [14], [18]– [20].
[score:3]
miR-129 expression differs greatly in different tumour types.
[score:3]
These findings suggest that miR-129-5p may be a potential therapeutic target for LSCC.
[score:3]
miR-129-5p is overexpressed in human LSCC.
[score:3]
This data suggests that ASO-miR-129-5p can significantly inhibit the growth and progression of LSCC tumours in vivo.
[score:3]
Increased miR-129 leads to decreased APC expression that could cause accumulation of beta-catenin in the cytoplasm.
[score:3]
Furthermore,tumour growth in mice was significantly inhibited by injections of the ASO-miR-129-5p lentivirus, and apoptosis of tumour cells was induced by the ASO-miR-129-5p lentivirus both in vitro and in vivo.
[score:3]
We also analysed relationships between miR-129-5p expression levels in the LSCC tumours and the clinical data from those patients (Table 1).
[score:3]
Co-transfection of the miR-129-5p inhibitor, ASO-miR-129-5p, with miR-129-5p also eliminated the ability of miR-129-5p to silence luciferase activity.
[score:3]
Dual functions for miR-129, as a tumour suppressor and oncogene have been observed in different cancers.
[score:3]
This study implicates miR-129-5p as a potentially valuable target for novel diagnoses and treatments in LSCC.
[score:3]
Our results also suggest an oncogenic function of miR-129-5p, potentially through differential regulation of signal transduction pathways.
[score:2]
For the reporter assay, cells were transiently transfected with luciferase reporter gene constructs and miR-129-5p or its antagomir targeting endogenous miR-129-5p.
[score:2]
The expression of the APC reporter was significantly decreased 53% in miR-129-5p -transfected cells compared to control cells.
[score:2]
These results indicated that miR-129-5p directly interacts with APC.
[score:2]
Furthermore, lower levels of c-myc after down -regulating miR-129-5p could explain the increased apoptosis observed in LSCC after transfection with miR-129-5p-specific ASO.
[score:2]
We also demonstrated using luciferase reporter assays, that adenomatous polyposis coli (APC) is a target for miR-129-5p.
[score:2]
miR-129-5p is a negative regulator of APC.
[score:2]
Lastly, our results suggested that miR-129-5p may regulate cell proliferation and division by modulating cell cycle progression.
[score:2]
Flow cytometric analyses of the effect of ASO-miR-129-5p on Hep-2 cells' cell cycle and apoptosis.
[score:1]
Furthermore, in the xenograft sections from the nude mice, morphological findings from transmission electron microscopy show typical signs of apoptosis such as nuclear condensation and fragmentation, marginalization of chromatin, cell shrinkage, and formation of cytoplasmic vacuoles in tumours treated with ASO-miR129-5p lentivirus (Fig. 3 A-c).
[score:1]
At 48, 72, and 96 h post-transfection, cells transfected with the ASO-miR-129-5p virus showed significantly less proliferation than control cells (GFP transfected cells) (P<0.05; Fig. 1B).
[score:1]
Additionally, cytoplasmic cyclin D1 and c-myc were less prominent in the tumour tissue from the ASO-miR129-5p -treated cells group than in tumours from the GFP-lentivirus group or untreated group (Fig. 6 B and C).
[score:1]
Untransfected Hep-2 cells were used as controls for cells transfected with ASO-miR-129-5p lentivirus or GFP-lentivirus.
[score:1]
Additionally, miR-129-5p transfection did not reduce the luciferase activity of the reporter construct transfected with mutant 3′UTR of APC.
[score:1]
Cells transfected with ASO-miR-129-5p migrated in significantly fewer numbers (20.67±5.51) than cells transfected with GFP (44.33±6.51) or untransfected cells (47±3.61) (** P<0.01).
[score:1]
Mice in the experimental group received an injection of ASO-miR-129-5p lentivirus while control mice received GFP-lentivirus.
[score:1]
Human miR-129-1 is one of the seven miRNAs identified near FRA7H, a fragile site in chromosome 7q32 [11].
[score:1]
miR-129-5p expression was measured by real-time PCR and normalized to the external control (human U6 gene).
[score:1]
Seventy-two hours after transfection with lentivirus containing ASO sequences against miR-129-5p, 2×10 [4] LSSC cells were resuspended in 200 µL of serum-free medium and plated in the upper compartment of the Boyden chambers.
[score:1]
A recombinant lentivirus encoding an ASO against human miR-129-5p and a control lentivirus were artificially synthesized by Genechem (Shanghai, China) and tittered to 10 [9] TU/mL for preparation according to manufacturer's protocol.
[score:1]
It has been reported that miR-129 was methylated in more than 95% of esophageal squamous cell carcinoma (ESCC) [18].
[score:1]
Co-transfection of miR-129-5p with the luciferase reporter plasmid resulted in less luciferase activitiy than transfection of the reporter plasmid alone.
[score:1]
While mice in both groups formed detectable tumours by the end of the study, the average tumour volume (0.24±0.15 cm [3]) and weight (0.24±0.14 g) in the ASO-miR-129-5p treated group was significantly lower than the tumour volume (0.63±0.25 cm [3]) and weight (0.68±0.23 g) from mice in the control group (P<0.05; Fig. 4).
[score:1]
Hep-2 cells were transfected with ASO-miR-129-5p, GFP, or no vector.
[score:1]
However, the role of miR-129 in LSCC remains unknown.
[score:1]
In this study, we used real-time PCR to measure the expression of miR-129-5p in both cell lines and primary LSCC samples.
[score:1]
Cells from the ASO-miR-129-5p lentivirus group, GFP-lentivirus group, and control Hep-2 cell group were harvested 72 h post-transfection and incubated in cell lysis buffer for 30 min on ice.
[score:1]
Mice were then treated with the lentiviral vectors encoding either ASO-miR-129-5p or GFP.
[score:1]
Figure 2 shows the percentage of apoptotic cells in the ASO-miR-129-5p -treated group is significantly higher (13.61±1.12%) than in the untreated cell group (1.87±1.44%) or GFP -treated cell group (5.98±1.23%) (P<0.05) in cultured cells.
[score:1]
The role of miR-129-5p to enhance tumour growth and progression was further demonstrated in vivo by treating LSCC tumour-bearing mice with miR-129-5p ASO and demonstrating slower tumour growth.
[score:1]
Lentivirus vectors for anti-sense oligonucleotides of miR-129-5p.
[score:1]
[1 to 20 of 90 sentences]
|
2 |
![]()
Other miRNAs from this paper: hsa-mir-129-1, hsa-mir-129-2, mmu-mir-129-2, hsa-mir-449b, mmu-mir-449b, mmu-mir-129b
According to our findings, we propose a mo del wherein after BRCA1 function is downregulated or inactivated by gene mutations or epigenetic silencing (e. g. DNA methylation), oncogenic NEAT1 is upregulated to epigenetically downregulate tumor-suppressive miR-129-5p expression and subsequently activate WNT4 expression.
[score:17]
Furthermore, we have revealed that NEAT1 upregulation by BRCA1 deficiency results in activating the expression of the stem-cell factor WNT4 by suppressing miR-129-5p expression.
[score:10]
Consistent with the reporter data, miR- 129- 5p overexpression significantly suppressed WNT4 expression in both cell lines (Figure 6C), demonstrating that WNT4 is the genuine target of miR-129-5p.
[score:9]
To reveal if the NEAT1/miR-129-5p signaling axis mediates BRCA1-deficiency -induced upregulation of WNT4 expression and WNT signaling, Western blot analysis of WNT4 and β-catenin in BRCA1-knockdown cells with or without co-overexpression of miR- 129- 5p was performed.
[score:9]
These findings demonstrate that downregulation of miR-129-5p expression by upregulated NEAT1 contributes to enhanced cell proliferation, stemness, invasiveness and anchorage-independent growth of BRCA1 -deficient breast tumor cells.
[score:9]
Consistent with the PCR array data, NEAT1 knockdown led to the induction of miR-129-5p expression in both MCF10A and MCF10DCIS cells, whereas BRCA1 knockdown suppressed its expression (Figure 4B).
[score:9]
These data together indicate that miR-129-5p inhibits WNT signaling via downregulation of WNT4 expression.
[score:8]
Although ectopic expression of miR-129-5p alone had no significant impact on cell growth, co -expression of miR-129-5p in BRCA1-knockdown MCF10DCIS cells suppressed approximately 55% of increased cell growth (Figure 5A).
[score:8]
Figure 6 WNT4 is a miR-129-5p target gene that is regulated by the BRCA1/NEAT1/miR-129-5p axis(A) A map for the predicted miR-129-5p targeting site in the 3′-untranslated region of the WNT4 mRNA.
[score:8]
To further confirm the result of the miR-129-5p mimic, we transfected the miR-129-5p inhibitor RNA into MCF10A cells with normal expression levels of miR-129-5p and examined the effect of miR-129-5p inhibition on WNT4 and β-catenin protein levels.
[score:7]
To reveal how relevant the BRCA1/NEAT1/miR-129-5p signaling axis is to breast cancer, we performed in silico analysis of publicly available cancer-related expression databases and published expression data to examine the expression correlation between these three molecules.
[score:7]
qRT-PCR analysis of miR-129-5p expression was performed on MCF10A and MCF10DCIS cells transfected with the control siRNA, the siRNA targeting BRCA1 or NEAT1, or the siRNA combination targeting both genes for 48 hours.
[score:7]
Based on the prior finding that NEAT1 is the downstream of BRCA1, this result suggests that inhibition of miR-129-5p expression by BRCA1 knockdown is NEAT1 -dependent.
[score:6]
To understand whether inhibition of miR-129-5p has an opposite effect to promote self-renewal of breast stem cells, we transfected the miR-129-5p inhibitor RNA (antagomir) into MCF10A cells that express normal levels of miR-129-5p and performed sphere formation assays to examine the effect.
[score:6]
Indeed, as shown in Figure 6C, β-catenin protein levels positively correlated with WNT4 protein levels and miR-129-5p overexpression concurrently downregulated both WNT4 and β-catenin protein levels.
[score:6]
After removal of the four cell lines (HCC70, MDA-MB-231, SUM-185PE, and SUM-52PE) with a poor correlation, the remaining 31 cell lines displayed a negative correlation between NEAT1 and miR-129-5p expression (correlation coefficiency = –0.2175 ± 0.1063) in a statistically significant manner (p = 0.0499) (Figure 8B, the right plot), consistent with our finding that NEAT1 negatively regulates miR-129-5p expression.
[score:6]
Indeed, in both MCF10A and MCF10DCIS cells co-overexpression of miR-129-5p abolished induction of WNT4 expression and activation of WNT signaling induced by BRCA1 knockdown (Figure 6I).
[score:6]
Figure 8 In silico expression correlation analysis of BRCA1, NEAT1 and miR-129-5p in a cohort of human breast cancer cell lines(A) Regression analysis of the expression correlation between BRCA1 and NEAT1 in breast cancer cell lines.
[score:5]
This was expected as miR-129-5p expression is epigenetically regulated by NEAT1 and any other epigenetic alterations may interfere with this regulatory axis.
[score:5]
This rescue study indicates that downregulation of miR-129-5p in BRCA1-knockdown cells contributes to the increased cell growth phenotype.
[score:5]
Additionally, BRCA1 overexpression consistently induced miR-129-5p expression in both MCF10A and MCF10DCIS cell lines (Figure 4C).
[score:5]
qRT-PCR analysis of miR-129-5p expression was performed on MCF10A and MCF10DCIS cells transfected with the empty vector or BRCA1 expression plasmid DNA.
[score:5]
To verify that WNT4 is a target of miR-129-5p, we performed luciferase reporter analysis of the WNT4 3′-untranslated region (3′-UTR).
[score:5]
We found that NEAT1 inhibited miR-129 expression by increasing the DNA hypermethylation of the CpG island in the miR-129 gene.
[score:5]
To unravel how the NEAT1/miR-129-5p axis contributes to enhanced malignancies caused by BRCA1 deficiency, we searched the putative gene targets of miR-129-5p using PicTar, TargetScan, and Miranda algorithms [64– 66].
[score:5]
This result reveals that NEAT1 epigenetically inhibits miR-129 expression.
[score:5]
WNT4 is a miR-129-5p target gene that is regulated by the BRCA1/NEAT1/miR-129-5p axis.
[score:4]
When co -transfected with siBRCA1, the miR-129-5p mimic significantly inhibited the increased self-renewal and proliferation of BCSCs induced by BRCA1-knockdown (Figure 5D).
[score:4]
These 35 cell lines showing the trend of BRCA1/NEAT1 regulation were further subjected to expression correlation analysis of both NEAT1 and miR-129-5p.
[score:4]
These results, taken together, indicate that as a downstream effector of the NEAT1/miR-129-5p axis, upregulated WNT4 is functionally required for enhanced malignant phenotypes and stemness of breast tumor cells induced by BRCA1 abrogation.
[score:4]
Given that the miR-129 gene is epigenetically silenced in breast and gastric cancers via DNA methylation [62, 63], we hypothesized that NEAT1 may regulate the DNA methylation status of the miR-129 gene to modulate its expression.
[score:4]
Upregulation of WNT4 by the NEAT1-miR129 axis is functionally implicated in promoting malignant phenotypes and stemness of BRCA1 -deficient breast tumor cells.
[score:4]
As shown in Figure 8B (the left plot), the expression correlation between these two non-coding RNAs was poor (p = 0.6259) possibly due to loss of NEAT1/miR-129-5p regulation in some cell lines (indicated by red dots).
[score:4]
Moreover, the transfection of the miR-129- 5p mimic alone suppressed invasiveness and anchorage-independent growth of MCF10DCIS cells and its co- transfection with siBRCA1 impaired the enhancing effects of BRCA1 knockdown on these two malignant phenotypes (Figure 5F, 5G).
[score:4]
Co-transfection of miR- 129-5p with the wild-type WNT4 3′-UTR reporter led to approximately 60% suppression of the reporter activity (p < 0.01, n = 3), whereas miR-129- 5p had no effect on the activity of the mutated WNT4 3′-UTR reporter with mutations at the miR-129-5p recognition site (Figure 6B).
[score:4]
To further confirm the role of NEAT1 in the regulation of the miR-129-5p/WNT4 axis, NEAT1 overexpression experiments were performed.
[score:4]
Epigenetic regulation of miR-129-5p expression by the BRCA1/NEAT1 axis.
[score:4]
48 hours posttransfection, Western blot analysis of WNT4, β-catenin and β-actin was performed on MCF10A cells transfected with either the scramble or miR-129-5p inhibitor RNA.
[score:3]
In silico expression correlation analysis of BRCA1, NEAT1 and miR-129-5p in a cohort of human breast cancer cell lines.
[score:3]
Ectopic expression of miR-129-5p alone attenuated self-renewal (indicated by the reduced sphere number) and the proliferation rate (indicated by the smaller sphere size) of BCSCs in MCF10DCIS (Figure 5D).
[score:3]
The miR-129-5p mimic and inhibitor were obtained from Sigma (St.
[score:3]
We further analyzed the expression correlation between BRCA1 and miR-129-5p in these 31 BC lines.
[score:3]
BRCA1 mRNA expression levels tended to positively correlate with miR-129-5p levels (correlation coefficiency = 0.3048 ± 0.2129) although it was not statistically significant (p = 0.1629) (Figure 8C, the left plot).
[score:3]
We obtained miR-129-5p data from a publication by Riaz et al., who profiled the miRNA expression of 51 breast cancer cell lines [71].
[score:3]
The discovery of the BRCA1/NEAT1/miR-129-5p/WNT4 axis and the pivotal roles of WNT4 in WNT signaling activation as well as in the enhancement of BCSC generation suggest that WNT signaling is a potential therapeutic target for breast cancer with alterations in this signaling axis.
[score:3]
The left regression analysis plot was made according to BRCA1 and miR-129-5p expression datasets from 31 BC lines that were narrowed down from analysis shown in the right panel of (B).
[score:3]
siRNA, miR-129-5p mimic and inhibitor transfections were performed with 20 nM of each reagent using OligofectamineTM RNAiMAX (Invitrogen, Carlsbad, CA, USA) according to the manufacturer's instructions.
[score:3]
As shown in Figure 5B and 5C, ectopic expression of miR-129-5p alone significantly reduced both CD44+CD49f+CD24– (7.31 ± 1.49% vs.
[score:3]
7.62 ± 0.28% of the control, p < 0.05; n = 3), indicating that miR-129-5p is an intrinsic suppressor of BCSCs.
[score:3]
were performed on MCF10A cells transfected with either the control scramble or miR-129-5p inhibitor RNA.
[score:3]
WNT4 is a target of miR-129-5p and downstream of the BRCA1/NEAT1 axis.
[score:3]
siRNA, miR-129-5p mimic and inhibitor transfections.
[score:3]
As predicted, NEAT1 knockdown resulted in decreased DNA methylation of the miR-129 CpG island (66.3 ± 2.6% vs.
[score:2]
Through our mechanistic studies we have identified the NEAT1/miR-129-5p/WNT4 axis and revealed that dysregulation of this signaling axis contributes to BRCA1-deficiency -induced malignant phenotypes in breast cancer cells, such as increases in cell proliferation, invasiveness, anchorage-independent growth and stemness.
[score:2]
Moreover, our in silico correlation analysis indicates that a significant portion of breast cancer cell lines (> 70%) manifested the regulation trend of the BRCA1/NEAT1/miR-129-5p axis.
[score:2]
Figure 5(A) The miR-129-5p mimic attenuates enhanced proliferation of BRCA1-knockdown MCF10DCIS cells.
[score:2]
A DNA fragment with mutations in the seeding site of WNT4 3′-UTR was used to construct the mutant reporter and its RNA sequence is shown under the map with its wild-type and miR-129- 5p sequences.
[score:2]
These in silico analyses, taken together, indicate that 29 (76.3%) out of 38 BC lines exhibited the trend of BRCA1/NEAT1/miR-129-5p axis regulation.
[score:2]
To reveal if the miR-129 gene is under the regulation of the BRCA1/NEAT1 axis, qRT-PCR assays were performed on MCF10A and MCF10DCIS cells with single or double knockdown of BRCA1 and NEAT1.
[score:2]
Co-transfection of miR-129-5p with BRCA1 siRNA partially abrogated the expanded CD44+CD49f+CD24– (from 21.85 ± 2.71% down to 16.26 ± 1.29%, p < 0.05; n = 3) and CD44+CD49f+CD24–EpCAM+ BCSC subsets (from 18.07 ± 2.83% down to 12.77 ± 1.27%, p < 0.05; n = 3) induced by BRCA1 knockdown (Figure 5B, 5C).
[score:2]
Given variable genetic and epigenetic alterations among these breast cancer cell lines, we predicted that some cell lines had lost the BRCA1/NEAT1/miR-129- 5p regulation axis.
[score:2]
The NEAT1/miR-129-5p axis mediates the effect of BRCA1 deficiency to enhance malignancies and stemness of breast tumor cells.
[score:1]
Western blot analysis of WNT4, β-catenin and β-actin was performed on scramble dsRNA-tansfected and miR-129-5p -transfected MCF10A and MCF10DCIS cells.
[score:1]
The NEAT1/miR-129-5p signaling axis contributes to enhanced malignant phenotypes and stemness of BRCA1 -deficient breast tumor cells.
[score:1]
Without these sequential analyses, there is no correlation between BRCA1 and miR-129-5p (correlation coefficiency = –0.02839 ± 0.1607; p = 0.8608; r [2] = 0.000866) from analysis of all 38 cell lines.
[score:1]
Western blot analysis of WNT4, β-catenin and β-actin was performed on MCF10A and MCF10DCIS cells transfected with the control siRNA, the BRCA1 siRNA or BRCA1 siRNA plus miR-129-5p mimic for 48 hours.
[score:1]
These data together demonstrate that the miR-129 gene is the downstream of the BRCA1/NEAT1 axis.
[score:1]
Bisulfite sequencing analysis of the DNA region (containing 32 CpG dinucleotides) within the CpG island of the miR-129 gene was performed on genomic DNA samples isolated from control and NEAT1 siRNA -transfected MCF10DCIS cells.
[score:1]
To reveal the functional role of miR-129-5p in the BRCA1-deficiency -induced malignant phenotypes of breast tumor cells, we performed a miR-129-5p rescue study by co-transfecting the miR-129-5p mimic with BRCA1 siRNA into MCF10DCIS cells.
[score:1]
As expected, inactivation of miR-129-5p resulted in elevated protein levels of WNT4 and β-catenin in MCF10A cells (Figure 6D).
[score:1]
To test this hypothesis, we performed bisulfite sequencing analysis of the CpG island of the miR-129 gene in NEAT1-knockdown MCF10DCIS cells compared with control siRNA -transfected cells.
[score:1]
The mo del for the role of the BRCA1/NEAT1/miR-129-5p/WNT4 signaling axis in BRCA1-deficiency -driven breast tumorigenesis.
[score:1]
As our aforementioned findings (Figure 6) indicate that WNT4 is downstream of the BRCA1/NEAT1/miR-129-5p axis and activates oncogenic WNT signaling in breast tumor cells, we postulated that WNT4 is involved in enhancing malignant phenotypes and stemness of BRCA1 -deficient breast tumor cells.
[score:1]
HEK-293T cells were transfected with the wild-type or mutated WNT4 3′-UTR reporter plasmid DNA along with either the control scramble dsRNA or the miR-129-5p mimic.
[score:1]
MCF10DCIS cells were transfected with the control siRNA, BRCA1 siRNA, miR-129-5p mimic or BRCA1 siRNA plus miR- 129- 5p mimic.
[score:1]
These findings, taken together, indicate that WNT4 is downstream of the BRCA1/NEAT1/miR-129-5p signaling axis.
[score:1]
After exclusion of two cell lines (BT-483 and HCC1143, indicated by red dots in the left plot of Figure 8C) identified to have a poor correlation, the remaining 29 BC lines showed a positive correlation between BRCA1 and miR-129-5p (correlation coefficiency = 0.4364 ± 0.2120) in a statistically significant manner (p = 0.0493) (Figure 8C, the right plot).
[score:1]
The relevance of the BRCA1/NEAT1/miR-129-5p axis in breast cancer.
[score:1]
By using the same miR-129-5p rescue method, we next performed flow cytometry analysis to examine the effect of miR-129-5p on the BCSC population.
[score:1]
[1 to 20 of 79 sentences]
|
3 |
![]()
MiR-129 induced autophagic flux by targetedly suppressing Notch-1. MiR-129 induced autophagy by targetedly suppressing Notch-1. E2F7 partially promoted Notch-1 inhibition -induced autophagy by upregulating Beclin-1. E2F7 was suppressed by Notch-1 and induced autophagy.
[score:15]
Moreover, overexpression of E2F7 was shown to be capable of inducing autophagy by upregulating Beclin-1. Interestingly, enforced expression of miR-129 or inhibition of Notch-1 increased the expression of E2F7 in glioma cells.
[score:12]
By targetedly suppressing Notch-1, which in turn suppressed the activation of mTOR and promoted the expression of Beclin-1, miR-129 induced autophagy.
[score:9]
By upregulating Beclin-1 expression, miR-129 and E2F7 induced autophagy and inhibited cell proliferation.
[score:8]
In this study, the major novel findings were that miR-129 is a new inducer of autophagy both through mTOR signaling and upregulation of Beclin-1 by targetedly suppressing Notch-1 in glioma cell lines.
[score:8]
Taken together, these results demonstrated that inhibition of endogenous Notch-1 might promote miR-129 -induced autophagy through suppress the activity of mTOR and enhance the expression of Beclin-1. Having tested the influence of Notch-1 on autophagy as indicated by Ingenuity Pathway Analysis (IPA) in Gastric cancer network 1: http://www.
[score:7]
Western blot analysis showed that the Lv-miR-129 group had a high level of miR-129 with downregulated Notch-1 expression along with increased E2F7 and Beclin-1 expression, p62 degradation and LC3-I to LC3-II conversion compared with the other two groups (Figure 6C and 6D).
[score:7]
Immunohistochemical analysis showed that Notch-1 expression was downregulated, whereas Beclin-1 and LC3 expression were increased in the Lv-miR-129 group compared with the other two groups (Figure 6E).
[score:7]
Taken together, these results demonstrated that inhibition of endogenous Notch-1 might promote miR-129 -induced autophagy through suppress the activity of mTOR and enhance the expression of Beclin-1. (A) Predicted binding sequences between miR-129 and seed site in Notch-1 3′UTR.
[score:7]
In addition to Notch-1 and E2F7, we also found miR-129 could inhibit the expression of Notch-2, E2F1 and E2F3 while promoted the expression of E2F8 (Supplementary Figure S5A and S5B).
[score:7]
On the contrary, miR-129 inhibition upregulates the protein level of Notch-1 in glioma cells (Supplementary Figure S3A and S3B).
[score:6]
Indeed, we demonstrated that overexpression of miR-129 or knockdown of Notch-1 not only inhibited mTOR activity but also increased Beclin-1 protein levels in glioma cells.
[score:6]
Treatment with 3-Methyladenine (3-MA), an autophagy inhibitor due to inhibit PI3K, in U87-129 cells could restore miR-129 -induced autophagic flux (Figure 1F).
[score:5]
Target genes of hsa-miR-129-5p were predicted using multiple target prediction algorithms: http://diana.
[score:5]
Figure 7(A) Expression of miR-129 and Notch-1 mRNA in 16 malignant glioma and 8 normal brains tissues was analyzed by qPCR, indicating that miR-129 expression was significantly lower and (B) Notch-1 was significantly higher in malignant glioma than that of normal brain tissues (** P < 0.01, *** P < 0.001).
[score:5]
Many studies demonstrated that miR-129 acted as a tumor suppressor with the ability to inhibit proliferation and promote apoptosis in a variety of tumor cell lines [15– 17].
[score:5]
These results showed that miR-129 was expressed in glioma samples and cell lines at a relatively low level, whereas the Notch-1 relative expression was high (Figure 7A, 7C–7D).
[score:5]
Consistent with MTT, the results showed that overexpression of miR-129 or E2F7 could inhibit the proliferation of U87 cells (Figure 5C and 5D, Supplementary Figure S7A and S7B).
[score:5]
It has been demonstrated that miR-129 acted as a tumor suppressor to inhibit proliferation and promote apoptosis in a variety of tumor cell line [15– 17].
[score:5]
Finally, suppression of miR-129- or E2F7 -induced autophagy by knockdown of Beclin-1 or knockdown of Atg5 restored cell viability.
[score:5]
In this study, we demonstrated that hsa-miR-129-5p, hereafter referred to as miR-129 unless particularly stated, could induce autophagy by targetedly suppressing Notch-1 in glioma cells.
[score:5]
Consistent with the result of miR-129 overexpression and Notch-1 inhibition, E2F7 also increased Beclin-1 protein levels and induced autophagy in U87 and U251 glioma cells.
[score:5]
The miR-129 sponge (129 sponge) vector effectively inhibited the expression of miR-129 (Supplementary Figure S1D) and Rap -induced the amount of LC3-I converted to LC3-II compared with scramble sponge (SCR sponge) vector (Figure 1B).
[score:4]
However, a qPCR analysis of U87 cells revealed that overexpression of E2F7 had no obvious impact on the expression of miR-129 compared with negative controls (Supplementary Figure S4C).
[score:4]
Knockdown of endogenous miR-129 expression prevented p62 degradation by Rap (Figure 1B).
[score:4]
The protein levels of p62 in Lv-miR-129 infected cells were also upregulated by CQ (Supplementary Figure S2B).
[score:4]
Knockdown of miR-129 inhibited Rap -induced LC3-I to LC3-II conversion and p62 degradation.
[score:4]
The predicted target site was mutated by site-directed mutagenesis, and 50 nM miR-129 mimics or NC mimics (RiboBio, Guangzhou, China) was transfected into cells with 5 ng Renilla plasmid (Promega, Madison, Wisconsin, USA) and 100 ng of the WT or MUT plasmid.
[score:4]
MiR-129 induced autophagy through mTOR signaling by targetedly suppressing Notch-1 in glioma cell lines.
[score:4]
On the contrary, U87 or U251 cells were transfected with miR-129 sponge vector, which inhibits endogenous miR-129, or scramble sponge vector for 48 hours.
[score:3]
The ability of miR-129 to inhibit proliferation and promote apoptosis has been demonstrated in a variety of tumor cell lines [15– 17].
[score:3]
Overexpression of miR-129 induces autophagy in human glioma cells.
[score:3]
These findings suggest that miR-129 is a promising therapeutic target as well as a diagnostic marker in glioma.
[score:3]
Consistent with the results shown above, miR-129 could promote the mRNA and protein expression of E2F7 both in U87 and U251 cell lines (Figure 4A and 4B).
[score:3]
Using DIANA microT v3.0 and miRanda bioinformatics tools, we found that hsa-miR-129-5p but not hsa-miR-129-3p potentially targets Notch-1, which contains two “seed” regions in the 3′UTR (Figure 2A).
[score:3]
Suppressed miR-129 -induced autophagic flux increased the viability of glioma cells which may further illustrate the mechanism of miR-129 in contributing to cell proliferation.
[score:3]
Many studies have shown that miR-129 acted as a tumor suppressor in a variety of human cancers [15– 17].
[score:3]
The MTT results indicated that suppression of miR-129 -induced autophagic flux by 3-MA, siBeclin-1 or siAtg5 attenuated the antiproliferative function of miR-129 in U87-129 cells after 48 or 72 hours (Figure 5A).
[score:3]
Thus, these results demonstrate that enforced expression of miR-129 increases autophagic flux.
[score:3]
Overexpression of miR-129 induced autophagy in glioma cells.
[score:3]
Therefore, these data demonstrated that overexpression of miR-129 increased the autophagic activity of glioma cells.
[score:3]
Suppression of miR-129 -induced autophagic flux rescued cell viability of U87 cells.
[score:3]
Thus, Beclin-1 may be involved in miR-129 or Notch-1 inhibition -induced autophagy (Figure 5E).
[score:3]
Importantly, inhibition of autophagic flux induced by miR-129 or E2F7 rescued the proliferation of glioma cells.
[score:3]
After infected with Lv-NC or Lv-miR-129 lentivirus for 96 hours, the infection efficiency was nearly 96% as indicated by fluorescence microscope scan and flow cytometry (Supplementary Figure S1A and S1B), and the expression of miR-129 were present at a high level in U87-129 and U251-129 cells (Supplementary Figure S1C).
[score:3]
To investigate the role of miR-129, as well as Notch-1, E2F7, Beclin-1, p62 and LC-3 expression in autophagy in vivo, tumor tissues were subjected to miR-129 and protein expression analyses.
[score:3]
Figure 4(A) qPCR analysis of relative expression of E2F7 mRNA in U87 and U251 cells after infected with Lv-NC or Lv-miR-129 for 72 hours (mean ± SEM of independent experiments, n = 3, ** P < 0.01).
[score:3]
In addition, forced expression of ICN-1 restored E2F7 and Beclin-1 protein levels induced by miR-129 (Figure 4D).
[score:3]
E2F7 partially mediated miR-129- and Notch-1 inhibition -induced autophagy.
[score:3]
To produce viruses, the pri-miR-129 expression plasmid and the backbone plasmids pMD2.
[score:3]
The result showed that miR-129 -induced autophagy and related protein expression was rescued to control levels after cotransfection of ICN-1 (Figure 2F).
[score:3]
Suppressed miR-129- or E2F7 -induced autophagy by siBeclin-1 could rescue the cell proliferation (Figure 5C and 5D, Supplementary Figure S7A and S7B).
[score:3]
Correlations between the expression levels of miR-129 and Notch-1 were analyzed using Pearson's correlation coefficient.
[score:3]
Inhibition of miR-129 -induced autophagic flux rescued the viability of glioma cells.
[score:3]
Suppression of miR-129 -induced autophagic flux, which may contributes to its anti-tumor effect, increased the viability and proliferation of glioma cells.
[score:3]
MiR-129 treatment suppressed glioma cell growth and induced autophagy in xenograft mo del.
[score:2]
Knockdown of Beclin-1 rescued E2F7- and miR-129 -induced autophagic flux (Figure 4E and 4F).
[score:2]
These data indicate an inducing role for miR-129 in autophagy and the regulation of Notch-1, E2F7 and Beclin-1 by miR-129 in vivo and vitro.
[score:2]
In summary, our findings document miR-129 and E2F7 as two autophagy inducers.
[score:1]
CQ treatment caused significant increase of LC3-II in both Lv-NC and Lv-miR-129 infected cells (Supplementary Figure S2B).
[score:1]
It is unclear, however, whether miR-129 induced autophagy partially by suppressing of Notch-2 or there have a feedback loop between Notch-2 and E2F7 need to be investigated.
[score:1]
Next, we examined the levels of p62, a poly-ubiquitin binding protein that binds to LC3 and is degraded by autophagy to determine whether miR-129 -induced autophagosome accumulation is due to autophagy induction or a block in downstream steps.
[score:1]
However, the influence of miR-129- or E2F7 -induced autophagy on cell proliferation was unclear.
[score:1]
MiR-129 is transcribed from two genes, miR-129-1 and miR-129-2 [14].
[score:1]
Notch-1/E2F7/Beclin-1 axis was involved in miR-129-triggered autophagic flux.
[score:1]
There were two potential “seed” sites in the 3′UTR of Notch-1 for hsa-miR-129-5p (Figure 2A), but there were no possible “seed” sites for hsa-miR-129-1-3p.
[score:1]
U87 cells were infected with Lv-NC or Lv-miR-129 for 72 hours and then transfected with pDsRed-LC3 for another 24 hours, or treated with 100 nM Rap and transfected with pDsRed-LC3 for 24 hours.
[score:1]
However, whether miR-129 affected autophagy was unclear.
[score:1]
These results suggested that miR-129 or E2F7 had an antiproliferative function may partially by inducing Beclin-1 -mediated autophagy (Figure 5E).
[score:1]
The p62 was degraded after infected with Lv-miR-129 for 48, 72 and 96 hours in U87 cells (Supplementary Figure S2A).
[score:1]
To further confirm this in vivo, we performed a xenograft experiment with U87 cells to manifest the inductive effect of miR-129 on autophagy in nude mice.
[score:1]
Nevertheless, to our knowledge, the influence of miR-129 on autophagy has not been reported.
[score:1]
To investigate the influence of miR-129 on autophagy, we infected with pHAGE-miR-129 lentivirus (Lv-miR-129) in U87 cells (named U87-129) and U251 cells (named U251-129) cells, which stably expressed miR-129.
[score:1]
Moreover, miR-129 promoted LC3 conversion in a time dependent manner.
[score:1]
Figure 2(A) Predicted binding sequences between miR-129 and seed site in Notch-1 3′UTR.
[score:1]
Thus, miR-129 is a promising diagnostic marker in glioma.
[score:1]
The mTOR signaling pathway and Beclin-1 were involved in autophagy induced by miR-129.
[score:1]
Cells were infected with Lv-NC or Lv-miR-129 for 96 hours or treated with 100 nM rapamycin (Rap) for 24 hours and then analyzed by Western blot.
[score:1]
Many studies have demonstrated the antiproliferative effect of miR-129 in a variety of human cancers [15– 17].
[score:1]
Cells were transfected with miR-129 mimics or non-specific mimics as a negative control (NC) (RiboBio, Guangzhou, China) using Lipofectamine [™] 2000 reagent (Invitrogen, San Diego, CA, USA) according to the manufacturer's protocol.
[score:1]
These findings may provide new insights to the application of miR-129 for glioma therapy.
[score:1]
Moreover, miR-129 triggered autophagy partially by a novel Notch-1/E2F7/Beclin-1 axis.
[score:1]
The in vitro experiments demonstrated that miR-129 could enhance autophagic flux in glioma cells.
[score:1]
The 600-bp fragment of the predicted miR-129 -binding sequence or a mismatch sequence in the 3′UTR of Notch-1 mRNA, amplified from 293T genomic DNA, was cloned into Spe I and Hand III restriction site of pMIR-REPORT plasmid (Invitrogen, San Diego, CA, USA).
[score:1]
The conversion of LC3-I to LC3-II increased after infected with Lv-miR-129 for 48, 72 and 96 hours in U87 cells (Supplementary Figure S2A).
[score:1]
A fragment of pri-miR-129 was amplified from 293T genomic DNA and cloned into lentiviral vector pHAGE-CMV-MCS-IZsGreen.
[score:1]
As miR-129-1 was frequently deleted in solid tumors [27], it was cloned into a pHAGE-CMV-IZsGreen vector (pHAGE) pHAGE-miR-129 and named as pHAGE-miR-129 in our experiments.
[score:1]
It has also been reported that miR-129 was decreased in clinical glioma samples by miRNA microarray and had an antiproliferative effect in glioma cell lines using a human pre-miR miRNA precursor library [26].
[score:1]
There is a negative correlation between miR-129 and Notch-1 (Figure 7B).
[score:1]
In conclusion, the present study demonstrated that miR-129 and E2F7 as new inducer of autophagy.
[score:1]
These results indicated that E2F7 partially promoted miR-129-triggered autophagic flux.
[score:1]
U87 cells were infected with Lv-NC or Lv-miR-129 for 72 hours and harvested for qPCR.
[score:1]
Figure 5(A) U87 cells were infected with Lv-NC or Lv-miR-129 for 24 hours and then treated with 5 mM 3-MA or transfected with 50 nM siBeclin-1 or siAtg5 for another 24 hours, 48 hours and 72 hours.
[score:1]
These findings provide new insights into the antitumor effects of miR-129 and may contribute to the application of miR-129 for glioma therapy.
[score:1]
Moreover, miR-129 promoted p62 degradation in a time dependent manner.
[score:1]
These results showed that the autophagic flux induced by miR-129 was a continual process.
[score:1]
Therefore, these results suggested that miR-129 likely induced autophagic flux partially in a Notch-1/E2F7/Beclin-1 -dependent manner in U87 cells.
[score:1]
Then, the groups were injected with phosphate buffered saline (PBS), Lv-NC and Lv-miR-129, respectively.
[score:1]
These results indicated that miR-129- or E2F7 -induced autophagy was injurious to glioma cells.
[score:1]
[1 to 20 of 99 sentences]
|
4 |
![]()
Other miRNAs from this paper: mmu-mir-129-2, mmu-mir-129b
MiR-129 overexpression regulate NF-kB, Cyclin D1, MMP9, and P21 expression in vitro, suppresses the tumorigenicity and development of endometrial carcinoma cells in vivoqRT-PCR and Western blot demonstrated decreased expression of NF-kB, Cyclin D1 and MMP9 at the mRNA and protein levels, however, P21 expression was increased after transfection of miR-129 mimics compared with the negative control (Figure 8A and 8B).
[score:12]
As predicted, miR-129 overexpression significantly downregulated GSK-3β expression and suppressed tumorigenicity and slowed down the progression of EC in vivo.
[score:10]
Figure 8MiR-129 overexpression regulate NF-kB, Cyclin D1, MMP9, and P21 expression in vitroqRT-PCR and Western blot demonstrated decreased expression of NF-kB, Cyclin D1 and MMP9 at the mRNA (A) and protein (B) levels, while P21 expression was increased after transfection of miR-129 mimics compared with the negative control.
[score:9]
The nude mouse xenograft assay showed that miR-129 overexpression may suppress tumor growth through downregulating GSK-3β expression.
[score:9]
GSK-3β downregulation by miR-129 overexpression inhibited cell migration and invasion.
[score:8]
MiR-129 overexpression regulate NF-kB, Cyclin D1, MMP9, and P21 expression in vitro, suppresses the tumorigenicity and development of endometrial carcinoma cells in vivo.
[score:8]
Therefore, we hypothesize that GSK-3β may be downregulated by miR-129 in order to suppress the development of EC.
[score:7]
The downregulation of GSK-3β is an effective way to inhibit EC tumorigenesis and progression, and miR-129 is an effective and important miR.
[score:6]
After GSK-3β down-regulation by si-GSK-3β, microRNA-129 mimic transfection or GSK-3β inhibitor exposure, EC cell phenotypes and related molecules were examined.
[score:6]
Therefore, we transfected miR-129 mimics into EC cells and found that the GSK-3β expression both at the mRNA and protein level was downregulated.
[score:6]
are representative of three separate experiments; data are expressed as the mean ± standard deviation, * P < 0.05. qRT-PCR and Western blot demonstrated decreased expression of NF-kB, Cyclin D1 and MMP9 at the mRNA and protein levels, however, P21 expression was increased after transfection of miR-129 mimics compared with the negative control (Figure 8A and 8B).
[score:6]
qRT-PCR and Western blot analysis showed that miR-129 overexpression by miR-129 transfection (P < 0.05; Figure 5C) reduced GSK-3β expression at both the mRNA and protein levels (P < 0.05; Figure 5D).
[score:5]
qRT-PCR and Western blot analysis showed that miR-129 overexpression (C) reduced GSK-3β expression at both the mRNA and protein levels (D).
[score:5]
MiR-129 overexpression suppresses the tumorigenicity and development of endometrial carcinoma cells in vivo.
[score:5]
miR-129 overexpression suppressed EC cell proliferation, increased cell apoptosis.
[score:5]
The inhibition of GSK-3β expression by miR-129 may prove to be an effective therapeutic strategy for EC.
[score:5]
Further experiments showed that miR-129 overexpression also suppressed the proliferation, migration, invasion of cells, and promoted the apoptosis of EC cells, which were completely in line with our si-GSK-3β experimental results.
[score:5]
MiR-129 overexpression regulate NF-kB, Cyclin D1, MMP9, and P21 expression in vitro.
[score:5]
are representative of three separate experiments; data are expressed as the mean ± standard deviation, * P < 0.05. miR-129 transfection inhibited cell migration (A) and invasion (B) ability compared with the control group.
[score:4]
are representative of three separate experiments; data are expressed as the mean ± standard deviation, * P < 0.05. miR-129 transfection suppressed cell proliferation (A), induced cell apoptosis (B) compared with the control group.
[score:4]
GSK-3β was a target of miR-129.
[score:3]
Next, we detected the mRNA and protein expression levels of NF-kB, Cyclin D1, MMP9, and P21 in EC cells following transfection of miR-129.
[score:3]
Lastly, we performed nude mice xenograft assays to elucidate if miR-129 could affect the expression level of GSK-3β and further influence the tumorigenicity and development of EC in vivo.
[score:3]
HEK293T cells were co -transfected with either a GSK-3β 3′ untranslated region (3′UTR) clone or a mutant clone, and miR-129 or scramble mimics using Lipofectamine 2000 reagent.
[score:3]
MiR-129 transfection reduced GSK-3β expression, and exhibited the same trend as si-GSK-3β transfection in cell function experiments.
[score:2]
Bioinformatic predictions and dual-luciferase reporter assays showed that GSK-3β was a possible target of miR-129.
[score:2]
Our predicted seed region in the 3′ UTR of GSK-3β revealed that GSK-3β is a target of miR-129, which was also convinced by our luciferase reporter assay results.
[score:2]
Luciferase reporter assays showed that miR-129 might directly bind to the 3′UTR of GSK-3β (B).
[score:1]
We located a miR-129 binding site in the 3′UTR of GSK-3β using the microRNA.
[score:1]
org prediction website showed a miR-129 binding site in the 3′UTR of GSK-3β (A).
[score:1]
[1 to 20 of 30 sentences]
|
5 |
![]()
Other miRNAs from this paper: mmu-mir-129-2, mmu-mir-129b
Recently, miR-129-5p, which is known to function as a tumor suppressor [13], has been shown to function in neuro-apoptosis by regulating bcl-2 and caspase-3 expression during cerebral IR [11].
[score:6]
miR-129-5p expression was obviously downregulated with time and reached its lowest levels at both 12 and 48 h after IR compared with the levels in the sham surgery group (Fig. 2a, P < 0.05).
[score:5]
Additionally, miR-129-5p prevents NF-κB transduction and subsequent inflammatory infiltration in autoimmune diseases by inhibiting TLR2 or TLR4-HMGB1 signaling [10, 15].
[score:5]
Transfection of human osteoblast-like cells with an miR-129-3p mimic inhibits in vitro monocyte migration by targeting the human IL-17 gene, which is one of the major mechanisms underlying the pathogenesis of rheumatoid arthritis [22].
[score:5]
We used TargetScan to identify the targets of miR-129-5p by specifying a continuous “seed match” of more than six base pairs and a potential link with TLR signaling (e. g., adaptor, interacting proteins, and DAMPs).
[score:5]
Schematic representation of the six groups of mice exposed to the different treatments Potential binding between miRNA-129-5p and the 3′ untranslated region (3′UTR) of HMGB1 (NM_010439) was predicted using TargetScan (http://www.
[score:5]
In a rat mo del of intracerebral hemorrhage, miR-129-5p has been shown to be associated with the inhibition of revascularization and angiogenesis by suppressing HMGB1 and RAGE signaling [14].
[score:5]
Recently, emerging evidence has shown that miR-129-5p is dysregulated during trauma and degenerative and autoimmune diseases and thus has special significance for the maintenance of neuronal function and macrophage/ monocyte migration under these pathological conditions [10, 14, 22].
[score:4]
miR-129-5p has also been shown to modulate angiogenesis and revascularization by regulating vascular endothelial growth factor expression via RAGE-HMGB1 signaling during intracerebral hemorrhage [14].
[score:4]
In this study, we demonstrated that miR-129-5p was downregulated in a temporal fashion and reached its lowest levels at both 12 and 48 h (Fig. 2), which was consistent with the results of our previous studies demonstrating the bimodal stages of IR -induced neuroinflammation and suggesting potential miRNA -based treatment strategies [21, 24].
[score:4]
The temporal miR-129-5p and HMGB1 expression profiles and luciferase assay results indicated that miR-129-5p targeted HMGB1.
[score:4]
No differences were detected between the two groups of cells transfected with con-129, suggesting that HMGB1 was a direct target for miR-129-5p (Fig. 3c, P > 0.05).
[score:4]
miR-129-5p mimic prevented the upregulation of HMGB1 and the TLR3-cytokine pathway after IR.
[score:4]
Fig. 5Effect of the miR-129-5p mimic and mimic control on the expression of HMGB1 and TLR3 -mediated cytokines at 48 h after IR.
[score:3]
[#] P < 0.05 versus the IR group Fig. 6Effects of the miR-129-5p mimic and mimic control on HMGB1 expression in specific cell types of the spinal cord after IR.
[score:3]
The temporal expression patterns of HMGB1 and miR-129-5p preliminarily indicated a negative correlation between these two factors.
[score:3]
Next, we assessed the effects of miR-129-5p on HMGB1 expression and the TLR3-cytokine pathway in vivo by intrathecal injection of an miR mimic and control, recombinant HMGB1 (rHMGB1), and a TLR3-specific agonist (polyinosinic-polycytidylic acid, Poly(I:C)).
[score:3]
a Quantification of miR-129-5p expression.
[score:3]
a Schematic representation of the predicted interaction between miR-129-5p and HMGB1 based on TargetScan.
[score:3]
In conclusion, this study explored the roles of miR-129-5p and its targets in spinal cord IR.
[score:3]
The IR -induced changes in the miR-129-5p and HMGB1 expression levels were examined at 12-h intervals for 48 h post-surgery.
[score:3]
HMGB1 as a target of miR-129-5p.
[score:3]
Likewise, the HMGB1 protein levels were significantly increased beginning from 12 h after IR, and this high level was maintained throughout the observation period (Fig. 2b, c, P < 0.05), suggesting a potential negative correlation between miR-129-5p and HMGB1 expression.
[score:3]
Thus, HMGB1 was selected as a potential target of miR-129-5p.
[score:3]
Increasing miR-129-5p levels protect against IR by ameliorating inflammation -induced neuronal and BCSB damage by inhibiting HMGB1 and TLR3 -associated cytokines.
[score:3]
Multiple roles of the tumor suppressor miR-129-5p in cerebral IR have recently been reported, but its functions in the spinal cord are unclear.
[score:3]
Temporal expression of miR-129-5p and HMGB1 after IR.
[score:3]
, Shanghai, China) with Lipofectamine 2000 (Invitrogen, MA, USA) to modulate in vivo miR-129-5p expression.
[score:3]
In this study, we provided evidence for the first time that elevated miR-129-5p expression exerted neuroprotective effects in a mouse mo del of spinal cord IR.
[score:3]
In this study, first, we investigated whether miR-129-5p was dysregulated and then defined HMGB1 as its target in this context.
[score:2]
miR-129-5p is known to regulate malignant tumor progression and metastasis [13].
[score:2]
Fig. 3Confirmation of a direct interaction between miR-129-5p and HMGB1.
[score:2]
These findings indicate that miR-129-5p may be involved in regulating neuroinflammatory responses after injury.
[score:2]
miR-129-5p mimic prevented inflammation -induced damage to the BSCB after IR.
[score:1]
However, little is known about the function of miR-129-5p in the interaction between HMGB1 and TLR3 in mouse mo dels of spinal cord IR.
[score:1]
Intrathecal injection of the miR-129-5p mimic significantly decreased the HMGB1, TLR3, interleukin (IL)-1β and tumor necrosis factor (TNF)-α levels and the double-labeled cell count 48 h post-surgery, whereas rHMGB1 and Poly(I:C) reversed these effects.
[score:1]
b Binding site of miR-129-5p in the WT and MT 3′UTR of HMGB1.
[score:1]
Intrathecal injection of a synthetic miR-129-5p mimic and a control.
[score:1]
miR-129-5p mimic improved hind-limb motor function after IR.
[score:1]
Fig. 2Time course of IR -induced alterations in the miR-129-5p and HMGB1 levels in a mouse mo del of spinal cord IR injury.
[score:1]
The effect of miR-129-5p on the expression of HMGB1, TLR3, and downstream cytokines was evaluated using synthetic miRs, rHMGB1, and the TLR3 agonist Poly(I:C).
[score:1]
Injection of miR-129-5p mimic preserved motor function and prevented BSCB leakage based on increased Basso Mouse Scale scores and decreased EB extravasation and water content, whereas injection rHMGB1 and Poly(I:C) aggravated these injuries.
[score:1]
miR-129-5p and HMGB1 expression was measured in triplicate with the Applied Biosystems 7500 Real-Time PCR System (Foster City, CA, USA).
[score:1]
A study by Sepramaniam et al. suggested that among the various biomarkers identified, miR-129-5p was a significantly altered miR in stroke patients [23].
[score:1]
According to the manufacturer’s gui delines, we intrathecally infused 10 μL of a synthetic miR-129-5p mimic (mimic-129) and a control mimic (con-129) (Jima Inc.
[score:1]
Fig. 7Effects of the miR-129-5p mimic and mimic control on hind-limb motor function and blood-spinal cord barrier (BSCB) integrity after IR.
[score:1]
Collectively, these data suggest that miR-129-5p functions as a negative modulator of HMGB1 in spinal cord IR.
[score:1]
[1 to 20 of 47 sentences]
|
6 |
![]()
MiR-129* down-regulation induced MCRS1 overexpression, which promotes EMT and invasion/metastasis of NSCLC cells through both the up-regulation of miR-155 and down-regulation of cell junction molecules.
[score:12]
The forced expression of miRNA-129* significantly induced the up-regulation of E-cadherin (epithelial marker) and down-regulation of Vimentin (mesenchymal marker) at both mRNA and protein levels (Figure 6e, 6f).
[score:9]
Among the 7 selected candidates, miR-129* expression was significantly down-regulated and negatively correlated with MCRS1 expression in the NSCLC tissues and cultured cells.
[score:8]
The forced expression of miR-129* significantly suppressed MCRS1 expression at both the mRNA and protein levels (Figure 6e, 6f).
[score:7]
Collectively, these results suggest that miR-129* expression can suppress oncogenic MCRS1 expression in NSCLC cells.
[score:7]
We examined the expression of these miRNAs in a series of lung cancer cell lines and found that the expression of miR-129* correlated inversely with MCRS1 expression (Figure 6a).
[score:7]
As shown in Figure 6b and 6c, miR-129* was remarkably down-regulated in the NSCLC tissues and appeared to be inversely correlated with MCRS1 mRNA expression.
[score:6]
MiR-129* originates from miR-129-1 at the 7q32.1 locus, which is a site commonly deleted in many cancers [34]; indeed, a recent study indicated that the expression of miR-129* is down-regulated in gastric cancer [35].
[score:6]
qRT-PCR assays confirmed that the expression of miR-129* was significantly down-regulated in NSCLC cell lines.
[score:5]
Summarily, these data demonstrated that miR-129* could be a tumor suppressor that affects cellular behavior by modulating MCRS1 expression.
[score:5]
In our functional test, miR-129* overexpression suppressed the cellular growth and invasion in NSCLC cells.
[score:5]
Figure 6 miR-129* directly regulated MCRS1 expression in NSCLC cells.
[score:5]
Systematic investigations ultimately showed that MCRS1 was directly and negatively regulated by the binding of miR-129* to its 3’-UTR, with miR-129* overexpression suppressing the growth and invasion of NSCLC cells.
[score:5]
Furthermore, MCRS1 expression was regulated by the binding of miR-129* to the 3’-UTR in vitro.
[score:4]
Additionally, MCRS1 activation was mediated by miR-129* down-regulation.
[score:4]
miR-129* and miR-1299 were subsequently chosen for further validation because of the inverse relationship between these two miRNAs and MCRS1 expression.
[score:3]
Additionally, miR-129* expressions were analyzed in clinical samples consisting of 6 noncancerous lung tissues, 8 NSCLCs without metastasis, and 7 NSCLCs with metastasis.
[score:3]
Altogether, these data strongly suggest that MCRS1 was directly regulated by miR-129* in the NSCLC cells.
[score:3]
Based on these data, miR-129* could be a tumor suppressor miRNA in NSCLC cells.
[score:3]
MCRS1 is directly regulated by miR-129* (miR-129-1-3p) in lung cancer cells.
[score:3]
To test whether MCRS1 is a direct target of miR-129*, we performed a luciferase reporter assay by constructing reporter genes containing the MCRS1 3’-UTR and found that the luminescence intensity was significantly reduced following the addition of a miR-129* mimic (Figure 6d).
[score:3]
Bottom: Validation of the direct targeting of MCRS1 by miR-129* using a luciferase reporter assay (Student’s t-test, *P <0.05).
[score:3]
Moreover, the ectopic expression of miRNA-129* significantly reduced cellular proliferation (Figure 6g) and invasion (Figure 6h).
[score:3]
As shown in Figure 6i, the value of miR-129* expression were related with the status of tumor metastasis.
[score:3]
This miR-129*/MCRS1/miR-155 axis provides a new angle in understanding the basis for the invasion and metastasis of lung cancer.
[score:1]
The value of miR-129* was inversely correlated with the status of tumor metastasis.
[score:1]
The research strategy is described in Additional file 10, and miR-129* and miR-1299 were identified as candidates.
[score:1]
To obtain the luciferase construct, the full-length 3’-UTR of MCRS1 (containing the binding sites for miR-129*) was amplified from the genomic DNA of EPLC-32 M1 cells and was inserted between the MluI and BgIII restriction sites in the pGL-3 basic vector (Promega).
[score:1]
Considering the novel discovery of miR-129* in NSCLC, we assessed the potential effects of miR-129* on EMT process.
[score:1]
The miR-129*/MCRS1/miR-155 axis provides a new avenue to understand the mechanism of the tumor invasion and metastasis (Figure 7).
[score:1]
[1 to 20 of 30 sentences]
|
7 |
![]()
Other miRNAs from this paper: mmu-mir-34c, mmu-mir-34b, mmu-mir-200a, mmu-mir-22, mmu-mir-26a-1, mmu-mir-34a, mmu-mir-129-2, mmu-mir-26a-2, mmu-mir-129b
As anticipated, mimics of miR-22 and miR-129 both inhibited HuR expression, while inhibitors of them increased HuR levels (Fig. 3j).
[score:7]
HuR showed higher expression levels in CRC cell lines than those in NCM460, whereas miR-22 and miR-129 expression levels were lower in the CRC cell lines (Fig. 3a, b and d).
[score:5]
Considering that miR-22 had a greater inhibitory effect on HuR than miR-129, we next focused on miR-22 to explore the consequences of miR-22 -driven HuR suppression in CRC.
[score:5]
Then, we co -transfected SW480 cells with this vector, β-gal vector and miR-22/miR-129 mimics/inhibitors.
[score:3]
Fig. 3miR-22 and miR-129 can inhibit HuR by binding to its 3’-UTR.
[score:3]
To explore the association between HuR or miR-22/miR-129 expression levels and the life expectancy of CRC patients, we downloaded RNA-Seq raw data and survival data of CRC patients from the TCGA data portal (http://cancergenome.
[score:3]
Further analysis using Pearson’s correlation analysis of scatter plots revealed that miR-22 and miR-129 were inversely correlated with HuR expression (Fig. 3c and e).
[score:3]
k Relative luciferase activities in SW480 treated with a miR-22/miR-129 mimic or inhibitor.
[score:3]
We used the mutant plasmids to repeat the luciferase experiments, and miR-22 and miR-129 mimics or inhibitors no longer influenced luciferase activity (Fig. 3k).
[score:3]
j Western blot analysis of HuR levels in 3 CRC cell lines after treatment with miR-22/miR-129 mimic or inhibitor.
[score:3]
Fig. 2HuR is a potential target gene of miR-22 and miR-129.
[score:3]
As predicted by Targetscan, miR-22 and miR-129 have 3 conserved binding sites in the 3’-UTR of HuR (Fig. 2e and f).
[score:3]
miR-22 and miR-129 can inhibit HuR by binding to its 3’-UTR.
[score:3]
HuR is a potential target gene of miR-22 and miR-129.
[score:3]
Combining bioinformatics predictions and in vitro validation, miR-22 and miR-129 were demonstrated to be upstream repressors of HuR by directly binding to its 3’-UTR.
[score:2]
b- e qRT-PCR analysis of miR-22 and miR-129 levels and the correlation between miRNA and HuR levels in the aforementioned 8 cell lines.
[score:1]
Briefly, for miRNA binding site tests, pMIR-report luciferase vectors containing binding sites for miR-22 or miR-129 on HuR’s 3’-UTR were constructed.
[score:1]
Among them, miR-22 and miR-129 showed the highest enrichments.
[score:1]
We then constructed two mutant luciferase vectors on which the binding sites of miR-22/miR-129 in the HuR 3’-UTR were mutated to abolish the interaction between miR-22/miR-129 and HuR mRNA.
[score:1]
As shown in Fig. 3f– i, miR-22 and miR-129 were inversely associated with the level of HuR in CRC tissues.
[score:1]
Kaplan-Meier curves showed that higher miR-22 or miR-129 levels predicted longer survival in CRC patients, which was contrary to that of HuR (Additional file 6: Figure S4a and b).
[score:1]
f- i qRT-PCR analysis of miR-22 and miR-129 levels and the correlation between fold changes of miRNA and HuR levels in CRC tissue pairs.
[score:1]
The minimum free energy values of the miR-22-HuR mRNA hybridisations were −22.1, −22.0 and −20.8 kcal/mol, which were lower than that of miR-129-HuR mRNA duplexes (−20.2, −13.2 and −14.6 kcal/mol), indicating that miR-22 has a tighter interaction with HuR mRNA than miR-129 (Fig. 2e and f).
[score:1]
We also analysed the correlation between the levels of miR-22/miR-129 and HuR in the CRC tissues mentioned above.
[score:1]
e and f Schematic descriptions of the hypothetical duplexes formed by miR-22 or miR-129 with the 3’-UTR of HuR.
[score:1]
The miR-22 binding site was mutated from GGCAGCT to CCGTCGA, and the binding site of miR-129 was mutated from CAAAAA to GTTTTT.
[score:1]
DNA fragments containing the miR-22 or miR-129 binding sites of HuR 3’-UTR were inserted into the pMIR-Report Luciferase vector.
[score:1]
[1 to 20 of 27 sentences]
|
8 |
![]()
Other miRNAs from this paper: hsa-mir-101-1, mmu-mir-101a, mmu-mir-155, hsa-mir-129-1, hsa-mir-210, hsa-mir-129-2, mmu-mir-129-2, mmu-mir-101b, hsa-mir-155, mmu-mir-210, hsa-mir-101-2, mmu-mir-101c, mmu-mir-129b
miR-129 might influence CTSE expression indirectly by binding the 3-untranslated region (3 ′-UTR) of specificity protein 1 (SP1) [60].
[score:6]
A significant downregulation of SP1 -expression was observed after transfection of HeLa cells with exogenous miR-129-5p [60].
[score:6]
Expression of miRNAs mmu-miR-101c and mmu-miR-129-5p was downregulated.
[score:6]
Autophagy-related miRNAs mmu-miR-101c, mmu-miR-129-5p, and mmu-miR-210-5p were differentially expressed in L. m. -infected BMDM in the late infection phase and directly influenced the parasite clearanceTo identify additional regulatory mechanisms, involved in the autophagic clearance of L. m. amastigotes, the small RNA transcriptome at 24 h p. i. was analyzed with Affymetrix® chips (Fig. 10a).
[score:5]
Fig. 10Global analysis of differentially expressed miRNAs in L. m. -infected BMDM, bioinformatical prediction of miRNA interactions with LISA, and infection rates of L. m. -infected BMDM after transfection with mmu-miR-101c or mmu-miR-129-5p mimics as well as mmu-miR-155-5p or mmu-miR-210-5p inhibitors.
[score:5]
The miRNAs mmu-miR-101c and mmu-miR-129-5p were significantly downregulated in our experiments during the late infection phase.
[score:4]
Transfection of L. m. -infected BMDM with miRNA mimics for mmu-miR-101c and mmu-miR-129-5p, or with an mmu-miR-210-5p inhibitor in the late infection phase, resulted in significantly decreased infection rates, which suggests that these miRNAs might influence autophagic processes directly (Fig. 10c).
[score:4]
Transfection with mimics of mmu-miR-101c and mmu-miR-129-5p, as well as with an inhibitor of mmu-miR-210-5p, demonstrated direct effects of the respective miRNAs on parasite clearance in L. m. -infected BMDM.
[score:4]
For downregulated miRNAs, L. m. -infected BMDM were transfected with miRNA mimics (mmu-miR-101c: MSY0019349, Qiagen; mmu-miR-129-5p: MSY0000209, Qiagen).
[score:4]
Autophagy-related miRNAs mmu-miR-101c, mmu-miR-129-5p, and mmu-miR-210-5p were differentially expressed in L. m. -infected BMDM in the late infection phase and directly influenced the parasite clearance.
[score:4]
Transfection of L. m. -infected BMDM with an mmu-miR-210-5p inhibitor as well as with mmu-miR-101c and mmu-miR-129 mimics significantly decreased the infection rates of these cells.
[score:3]
In contrast to the expected decrease of infection rates from transfection of L. m. -infected BMDM with an mmu-miR-210-5p inhibitor and an mmu-miR-129-5p mimic, the infection rates also decreased after treatment with an mmu-miR-101c mimic.
[score:3]
c A significant decrease in the infection rates was detected in L. m. -infected BMDM after transfection with mmu-miR-101c, mmu-miR-129-5p, and mmu-miR-210-5p compared to L. m. -infected BMDM transfected with a negative control of miRNA mimics or inhibitors.
[score:2]
Direct influences on parasitic clearance were shown for (1) the proteins BNIP3 and CTSE, and (2) the miRNAs mmu-miR-101c, mmu-miR-129-5p, and mmu-miR-210-5p.
[score:2]
Furthermore, mmu-miR-101c, mmu-miR-129-5p, and mmu-miR-210-5p were involved in parasite clearance from BMDM.
[score:1]
[1 to 20 of 15 sentences]
|
9 |
![]()
Other miRNAs from this paper: mmu-let-7i, mmu-mir-30b, mmu-mir-142a, mmu-mir-146a, mmu-mir-151, mmu-mir-155, mmu-mir-182, mmu-mir-21a, mmu-mir-31, mmu-mir-129-2, mmu-mir-25, mmu-mir-214, mmu-mir-409, mmu-mir-467a-1, mmu-mir-487b, mmu-mir-680-1, mmu-mir-680-2, mmu-mir-680-3, mmu-mir-709, mmu-mir-615, mmu-mir-467a-2, mmu-mir-467a-3, mmu-mir-467a-4, mmu-mir-467a-5, mmu-mir-467a-6, mmu-mir-467a-7, mmu-mir-467a-8, mmu-mir-467a-9, mmu-mir-467a-10, mmu-mir-344e, mmu-mir-21b, mmu-mir-21c, mmu-mir-7091, mmu-mir-129b, mmu-mir-142b
Among the ten miRNAs validated by qRT-PCR, we found that mmu-miR-487b-5p, mmu-miR-709, mmu-miR-182-5p, mmu-miR-214-3p and mmu-miR-467a-3p were up-regulated in HCC-activated Tregs, mmu-miR-142-5p, mmu-miR-30b-5p, mmu-miR-409-3p and mmu-miR-129-5p were down-regulated (P < 0.01), while miR-344e-5p did not change significantly, as shown in Figure 1C.
[score:7]
There were four up-regulated miRNAs (mmu-miR-709, mmu-miR-467a-3p, mmu-miR-182-5p and mmu-miR-25-5p) and seven down-regulated miRNAs (mmu-miR-615-3p, mmu-miR-409-3p, mmu-miR-680, mmu-miR-129-5p, mmu-miR-151-5p, mmu-miR-142-5p and mmu-miR-30b-5p), as the values presented in Table 1. Then we performed unsupervised hierarchical clustering of the eleven miRNAs.
[score:7]
In control Tregs, mmu-miR-487b-5p, mmu-miR-214-3p, mmu-miR-30b-5p and mmu-miR-129-5p showed significant down-regulation while mmu-miR-409-3p showed significant up-regulation (Figure 2C, left).
[score:7]
Control) P -valuemmu-miR-25-5p2.210.04mmu-miR-7091.980.02mmu-miR-467a-3p1.820.04mmu-miR-182-5p1.540.05mmu-miR-129-5p0.290.02mmu-miR-6800.340.02mmu-miR-615-3p0.360.00mmu-miR-409-3p0.440.02mmu-miR-30b-5p0.510.05mmu-miR-151-5p0.610.03 mmu-miR-142-5p 0.63 0.04By TargetScan, we found that mmu-miR-25-5p, mmu-miR-615-3p, mmu-miR-151-5p and mmu-miR-680 had few target genes directly relating with Tregs in MeSH database, so we excluded the four miRNAs for further exploration.
[score:6]
Compared with control Tregs, although mmu-miR-487b-5p and mmu-miR-129-5p showed similar down-regulation in HCC-activated Tregs, mmu-miR-409-3p was actually significantly down-regulated; mmu-miR-214-3p and mmu-miR-30b-5p did not exhibit significant changes (Figure 2C, right).
[score:6]
Compared with the healthy controls, the expression levels of hsa-miR-182-5p, hsa-miR-214-3p, hsa-miR-129-5p and hsa-miR-30b-5p were significantly up-regulated in Tregs from HCC patients while the hsa-miR-409-3p and hsa-miR-142-5p did not show significant changes (Figure 3).
[score:5]
Tregs from HCC patients and healthy controls finally confirmed the up-regulation of four miRNAs (hsa-miR-182-5p, hsa-miR-214-3p, hsa-miR-129-5p and hsa-miR-30b-5p).
[score:4]
indicated the four miRNAs (hsa-miR-182-5p, hsa-miR-214-3p, hsa-miR-129-5p and hsa-miR-30b-5p) targeted eight signaling pathways involved in Tregs.
[score:3]
Interestingly, compared with data from the murine mo del, two of the four miRNAs (hsa-miR-182-5p and hsa-miR-214-3p) showed the similar up-regulation while the other two miRNAs (hsa-miR-129-5p and hsa-miR-30b-5p) showed reverse changes.
[score:3]
The functions of these four miRNAs (hsa-miR-182-5p, hsa-miR-214-3p, hsa-miR-129-5p and hsa-miR-30b-5p) in human Tregs are not clear.
[score:1]
[1 to 20 of 10 sentences]
|
10 |
![]()
Other miRNAs from this paper: mmu-mir-30a, mmu-mir-30b, mmu-mir-150, mmu-mir-30e, mmu-mir-290a, mmu-mir-291a, mmu-mir-292a, mmu-mir-30c-1, mmu-mir-30c-2, mmu-mir-30d, mmu-mir-129-2, mmu-mir-17, mmu-mir-291b, mmu-mir-30f, mmu-mir-129b, mmu-mir-292b, mmu-mir-290b
3B, C. qPCR analysis of (B) κGT or (C) Rag1 expression in RNA purified from wild-type primary pro-B cells transduced with either a miR129-2_3p control knockdown sponge, or a miR290-5p or miR292-5p knockdown sponge.
[score:5]
analysis of HF4 AMuLV cells expressing His-FLAG-E2A, at endogenous levels, and over -expressing either miR129-2_3p, miR290-5p, or mir292-5p.
[score:5]
analysis of E2A+/+ AMuLV cells over -expressing either miR129-2_3p, miR290-5p, or mir292-5p, in the absence or presence of STI571 (1 µM, 16 hr).
[score:3]
Data was normalized to the expression of miR129-2_3p.
[score:3]
miR129-2_3p is expressed at similar levels as miR290-5p and miR292-5p at the pre-B stage, and is not induced at the pro-to pre-B stage in primary B cells or upon STI571 treatment of AMuLV-transformed pro-B cells (data not shown).
[score:3]
We stably expressed miR129-2_3p, miR290-5p, or miR292-5p in this cell line and performed with anti-FLAG or anti-IgG antibodies.
[score:3]
We observed indistinguishable induction of Rag1 gene expression upon IL7 withdrawals in miR292-5p as compared to miR129-2_3p negative control sponge cultures (Fig. 3c).
[score:2]
E2A+/+ AMuLV cells were stably transduced with tandem tomato marked sponge constructs for miR129-2_3p, mir290-5p, or miR292-5p.
[score:1]
Binding sites were as follows: miR129-2_3p: ATGCTTTTTGTTTGAAGGGCTT, miR290-5p: AAAGTGCCCCACCCGTTTGAGT, miR292-5p: CAAAAGAGCCAAACGTTTGAGT.
[score:1]
We also cloned a sponge construct for a different miRNA, miR129-2_3p (723953), to use as a negative control.
[score:1]
The miR30 cassette was replaced with either miR129-2_3p, miR290-5p, or miR292-5p.
[score:1]
[1 to 20 of 11 sentences]
|
11 |
![]()
Other miRNAs from this paper: hsa-mir-29a, mmu-mir-124-3, mmu-mir-9-2, mmu-mir-200b, mmu-mir-202, mmu-mir-203, hsa-mir-129-1, hsa-mir-203a, hsa-mir-200b, mmu-mir-302a, hsa-mir-124-1, hsa-mir-124-2, hsa-mir-124-3, hsa-mir-9-1, hsa-mir-9-2, hsa-mir-9-3, hsa-mir-129-2, mmu-mir-29a, mmu-mir-129-2, mmu-mir-124-1, mmu-mir-124-2, mmu-mir-9-1, mmu-mir-9-3, hsa-mir-302a, hsa-mir-302b, hsa-mir-302c, hsa-mir-302d, mmu-mir-409, hsa-mir-409, mmu-mir-467a-1, hsa-mir-202, hsa-mir-499a, mmu-mir-302b, mmu-mir-302c, mmu-mir-302d, mmu-mir-467b, mmu-mir-499, mmu-mir-467c, mmu-mir-467d, mmu-mir-467e, mmu-mir-467f, mmu-mir-467g, mmu-mir-467h, hsa-mir-302e, hsa-mir-302f, mmu-mir-467a-2, mmu-mir-467a-3, mmu-mir-467a-4, mmu-mir-467a-5, mmu-mir-467a-6, mmu-mir-467a-7, mmu-mir-467a-8, mmu-mir-467a-9, mmu-mir-467a-10, hsa-mir-203b, hsa-mir-499b, mmu-mir-129b, mmu-mir-9b-2, mmu-mir-124b, mmu-mir-9b-1, mmu-mir-9b-3
Thus, miR-129 and miR-499 expression was downregulated upon induction of Aire among mature mTECs, yet both miRNAs were also downregulated in mature mTECs in Aire null mice as compared with WT.
[score:8]
Mir-129, miR-499 and miR-302b were expressed at similar levels in immature mTECs of mutant and control littermates, but were significantly downregulated in mature mTECs of Aire null mutants (Fig. 2B).
[score:6]
In the context of a putative role of miRNA in pGE, it is noteworthy that several mRNAs, upregulated upon mTEC maturation, showed tissue-specific expression patterns, i. e. being restricted to brain (miR-124 and miR-129), heart (miR-499), testis (miR-202), skin (miR-203) or embryo (miR-467 and miR-302).
[score:6]
miR-124, miR-129, miR-202, miR-203, miR-302b and miR-467a were stably expressed at two- to tenfold higher level in the mTEC [high] subset independent of the maturation marker used for sorting the cells (Fig. 1C).
[score:3]
Interestingly, miR-124, miR-129, miR-202, miR-203, miR-302b and miR-467a were differentially regulated in immature and mature Aire [neg] versus mature Aire [pos] mTEC subsets.
[score:2]
[1 to 20 of 5 sentences]
|
12 |
![]()
Other miRNAs from this paper: mmu-mir-134, mmu-mir-135a-1, mmu-mir-138-2, mmu-mir-145a, mmu-mir-203, mmu-mir-290a, mmu-mir-291a, mmu-mir-296, mmu-mir-302a, mmu-mir-34c, mmu-mir-34b, mmu-mir-23a, mmu-mir-34a, mmu-mir-129-2, mmu-mir-340, mmu-mir-135b, mmu-mir-135a-2, mmu-mir-138-1, mmu-mir-381, mmu-mir-434, mmu-mir-449a, mmu-mir-291b, mmu-mir-302b, mmu-mir-302c, mmu-mir-302d, mmu-mir-449c, mmu-mir-145b, mmu-mir-129b, mmu-mir-290b
Increased miR-129-1 and mir-129-2 expression was partly responsible for the reduced Sox4 expression, which was up-regulated during ES cell differentiation into neural stem cell [26].
[score:8]
Similarly, the expression miR-129 and miR-434 was increased and their targets (i. e., Sox4 and Ccnl1, respectively) were down-regulated [26] (Figures 2G and 2H).
[score:8]
By contrast, some miRNAs that are significantly up-regulated were also observed, including miR-290 cluster members, miR-291a and miR-291b, miR-129-1-3p, miR-129-2-3p, miR-23a-3p, miR-434-3p, miR-145-5p, and miR-203-3p.
[score:4]
[1 to 20 of 3 sentences]
|
13 |
![]()
Other miRNAs from this paper: mmu-mir-125a, mmu-mir-125b-2, mmu-mir-145a, mmu-mir-150, mmu-mir-155, mmu-mir-129-2, mmu-mir-351, mmu-mir-210, mmu-mir-125b-1, mmu-mir-375, mmu-mir-762, mmu-mir-145b, mmu-mir-129b
Eight miRNAs (miR-351, -762, -210, -145, -486, -339, -34c, and -155) were substantially up-regulated (b), and nine miRNAs (miR-129-5p, -150, -375, -203, -239-3p, -449a, -383, -1907 and -409) were substantially down-regulated in OIR retinas (c).
[score:7]
This comparison demonstrated different groups of miRNAs preferentially altered at different time points in OIR, yet several miRNAs, including miR-150, miR-375, miR-129-5p and miR-129-3p showed consistent pattern of down-regulation at both P15 and P17.
[score:4]
Moreover, we found that ten miRNAs were down-regulated while nine of these (mmu-miR-129-5p, -150, -375, -203, 129-3p, -449a, -383, -1907 and -409) were mature miRNAs shown in the heat map and bar graph (Fig. 2a,c).
[score:4]
Among these, mmu-miR-129-5p and -150 were the two most substantially decreased miRNAs, showing more than 40% of down-regulation (log [2] ratio < −0.7, representing <0.6-fold change) compared with the age-matched normoxic retinas (Fig. 2a,c and Table 1).
[score:3]
[1 to 20 of 4 sentences]
|
14 |
![]()
Other miRNAs from this paper: hsa-let-7a-1, hsa-let-7a-2, hsa-let-7a-3, hsa-let-7b, hsa-let-7c, hsa-let-7d, hsa-let-7e, hsa-let-7f-1, hsa-let-7f-2, hsa-mir-16-1, hsa-mir-17, hsa-mir-21, hsa-mir-16-2, mmu-let-7g, mmu-let-7i, mmu-mir-124-3, mmu-mir-127, mmu-mir-9-2, mmu-mir-137, mmu-mir-10b, hsa-mir-129-1, hsa-mir-139, hsa-mir-7-1, hsa-mir-7-2, hsa-mir-7-3, hsa-mir-10b, hsa-mir-218-1, hsa-mir-218-2, hsa-mir-221, mmu-let-7d, hsa-let-7g, hsa-let-7i, hsa-mir-124-1, hsa-mir-124-2, hsa-mir-124-3, hsa-mir-137, hsa-mir-9-1, hsa-mir-9-2, hsa-mir-9-3, hsa-mir-127, hsa-mir-129-2, mmu-let-7a-1, mmu-let-7a-2, mmu-let-7b, mmu-let-7c-1, mmu-let-7c-2, mmu-let-7e, mmu-let-7f-1, mmu-let-7f-2, mmu-mir-16-1, mmu-mir-16-2, mmu-mir-21a, mmu-mir-129-2, mmu-mir-346, mmu-mir-17, mmu-mir-139, mmu-mir-218-1, mmu-mir-218-2, mmu-mir-221, mmu-mir-124-1, mmu-mir-124-2, mmu-mir-9-1, mmu-mir-9-3, mmu-mir-7a-1, mmu-mir-7a-2, mmu-mir-7b, hsa-mir-346, hsa-mir-451a, mmu-mir-451a, hsa-mir-488, mmu-mir-488, hsa-mir-451b, mmu-mir-21b, mmu-let-7j, mmu-mir-21c, mmu-mir-451b, mmu-let-7k, mmu-mir-129b, mmu-mir-9b-2, mmu-mir-124b, mmu-mir-9b-1, mmu-mir-9b-3
Expression of miR-124 and miR-137, respectively, increased up to 8- and 24-fold, expression of miR-129 and miR-139, respectively, decreased up to 2- and 4-fold, and expression of miR-7 and miR-218 did not change appreciably.
[score:7]
Of the 35 miRNAs, we identified six HGA-miRNAs, which were down-regulated in both AA and GBM tumors at a more stringent degree of significance (P < 0.01): miR-7, miR-124, miR-129, miR-137, miR-139 and miR-218.
[score:4]
We identified six miRNAs of particular interest, miR-7, miR-124, miR-129, miR-137, miR-139 and miR-218, which were down-regulated in both AAs and GBMs (Figure 1A, Additional file 8 and Table 1) at a more stringent level of significance (P ≤ 0.01).
[score:4]
[1 to 20 of 3 sentences]
|
15 |
![]()
Other miRNAs from this paper: mmu-mir-30a, mmu-mir-99b, mmu-mir-125a, mmu-mir-125b-2, mmu-mir-191, mmu-mir-199a-1, mmu-mir-122, mmu-mir-143, mmu-mir-298, mmu-mir-30c-2, mmu-let-7a-1, mmu-let-7a-2, mmu-mir-16-1, mmu-mir-16-2, mmu-mir-34a, mmu-mir-129-2, mmu-mir-340, mmu-mir-17, mmu-mir-223, mmu-mir-221, mmu-mir-222, mmu-mir-224, mmu-mir-199a-2, mmu-mir-125b-1, mmu-mir-365-1, mmu-mir-335, mmu-mir-455, mmu-mir-708, mmu-mir-181d, mmu-mir-193b, mmu-mir-5130, mmu-mir-6240, mmu-mir-129b
Additionally, miR-129-5p which is down-regulated during 3T3-L1 preadipocyte proliferation [21], had lower expression in VAT than BAT of HFD fed mice in our study.
[score:6]
The top 10 differentially expressed miRNAs included miR-193b-5p, miR-365-1-5p, miR-129-5p, miR-122-5p, miR-6240 and miR-5130 which had lower expression in both SAT and VAT (WAT) than in BAT.
[score:5]
Furthermore, miR-129-5p which is involved in browning process [28] had higher expression in BAT than VAT of the HFD mice in our study.
[score:3]
[1 to 20 of 3 sentences]
|
16 |
![]()
Other miRNAs from this paper: hsa-let-7a-1, hsa-let-7a-2, hsa-let-7a-3, hsa-let-7b, hsa-let-7c, hsa-let-7d, hsa-let-7e, hsa-let-7f-1, hsa-let-7f-2, hsa-mir-17, hsa-mir-18a, hsa-mir-20a, hsa-mir-21, hsa-mir-22, hsa-mir-26a-1, hsa-mir-99a, hsa-mir-103a-2, hsa-mir-103a-1, hsa-mir-106a, hsa-mir-107, mmu-let-7g, mmu-let-7i, mmu-mir-99a, mmu-mir-101a, mmu-mir-125a, mmu-mir-125b-2, mmu-mir-126a, mmu-mir-127, mmu-mir-145a, mmu-mir-146a, mmu-mir-206, hsa-mir-129-1, hsa-mir-148a, mmu-mir-122, mmu-mir-143, hsa-mir-139, hsa-mir-221, hsa-mir-222, hsa-mir-223, mmu-let-7d, mmu-mir-106a, hsa-let-7g, hsa-let-7i, hsa-mir-122, hsa-mir-125b-1, hsa-mir-143, hsa-mir-145, hsa-mir-125a, hsa-mir-125b-2, hsa-mir-126, hsa-mir-127, hsa-mir-129-2, hsa-mir-146a, hsa-mir-206, mmu-mir-148a, mmu-let-7a-1, mmu-let-7a-2, mmu-let-7b, mmu-let-7c-1, mmu-let-7c-2, mmu-let-7e, mmu-let-7f-1, mmu-let-7f-2, mmu-mir-18a, mmu-mir-20a, mmu-mir-21a, mmu-mir-22, mmu-mir-26a-1, mmu-mir-129-2, mmu-mir-103-1, mmu-mir-103-2, rno-let-7d, rno-mir-335, rno-mir-129-2, rno-mir-20a, mmu-mir-107, mmu-mir-17, mmu-mir-139, mmu-mir-223, mmu-mir-26a-2, mmu-mir-221, mmu-mir-222, mmu-mir-125b-1, hsa-mir-26a-2, hsa-mir-335, mmu-mir-335, rno-let-7a-1, rno-let-7a-2, rno-let-7b, rno-let-7c-1, rno-let-7c-2, rno-let-7e, rno-let-7f-1, rno-let-7f-2, rno-let-7i, rno-mir-17-1, rno-mir-18a, rno-mir-21, rno-mir-22, rno-mir-26a, rno-mir-99a, rno-mir-101a, rno-mir-103-2, rno-mir-103-1, rno-mir-107, rno-mir-122, rno-mir-125a, rno-mir-125b-1, rno-mir-125b-2, rno-mir-126a, rno-mir-127, rno-mir-129-1, rno-mir-139, rno-mir-143, rno-mir-145, rno-mir-146a, rno-mir-206, rno-mir-221, rno-mir-222, rno-mir-223, hsa-mir-196b, mmu-mir-196b, rno-mir-196b-1, hsa-mir-20b, hsa-mir-451a, mmu-mir-451a, rno-mir-451, hsa-mir-486-1, hsa-mir-499a, mmu-mir-486a, mmu-mir-20b, rno-mir-20b, rno-mir-499, mmu-mir-499, mmu-mir-708, hsa-mir-708, rno-mir-17-2, rno-mir-708, hsa-mir-103b-1, hsa-mir-103b-2, mmu-mir-486b, rno-mir-126b, hsa-mir-451b, hsa-mir-499b, mmu-mir-145b, mmu-mir-21b, mmu-let-7j, mmu-mir-130c, mmu-mir-21c, mmu-mir-451b, mmu-let-7k, hsa-mir-486-2, mmu-mir-129b, mmu-mir-126b, rno-let-7g, rno-mir-148a, rno-mir-196b-2, rno-mir-486
After 6 and 12 wks of E [2] exposure, 15 miRNAs were down-regulated, e. g., miR-22, miR-99a, miR-106a, miR-127, miR-499, and 19 miRNAs were-up-regulated, e. g., miR-17-5p, miR-20a, miR-21, miR-129-3p, miR-106a, miR-22, and miR-127.
[score:7]
By 18 wks of E [2] treatment, the mammary glands were characterized by lobular involution and hyperplasia, and only 1 miRNA was down-regulated (miR-139) and 5 miRNAs were up-regulated (miR-20b, miR-21, miR-103, mir-107, miR-129-3p, and miR-148a).
[score:5]
[1 to 20 of 2 sentences]
|
17 |
![]()
Other miRNAs from this paper: mmu-mir-101a, mmu-mir-203, mmu-mir-129-2, mmu-mir-101b, mmu-mir-101c, mmu-mir-129b
For example, miR-129-5p has an oncogenic role in LSCC and directly inhibits the tumour suppressor APC [19].
[score:6]
Consequently, miR-129-5p has been identified as a potential target for therapeutic intervention in LSCC.
[score:3]
Previously, we demonstrated that miR-129-5p could regulate tumourigenesis progression in LSCC by regulating of the Wnt signalling pathway [19].
[score:3]
[1 to 20 of 3 sentences]
|
18 |
![]()
Other miRNAs from this paper: mmu-let-7g, mmu-let-7i, mmu-mir-1a-1, mmu-mir-23b, mmu-mir-124-3, mmu-mir-125a, mmu-mir-9-2, mmu-mir-133a-1, mmu-mir-136, mmu-mir-138-2, mmu-mir-140, mmu-mir-146a, mmu-mir-181a-2, mmu-mir-182, mmu-mir-183, mmu-mir-184, mmu-mir-204, mmu-let-7d, mmu-mir-106a, mmu-mir-106b, mmu-let-7a-1, mmu-let-7a-2, mmu-let-7b, mmu-let-7c-1, mmu-let-7c-2, mmu-let-7e, mmu-let-7f-1, mmu-let-7f-2, mmu-mir-21a, mmu-mir-23a, mmu-mir-26b, mmu-mir-29c, mmu-mir-31, mmu-mir-96, mmu-mir-129-2, mmu-mir-338, mmu-mir-1a-2, mmu-mir-181a-1, mmu-mir-216a, mmu-mir-124-1, mmu-mir-124-2, mmu-mir-9-1, mmu-mir-9-3, mmu-mir-138-1, mmu-mir-181b-1, mmu-mir-181c, mmu-mir-7a-1, mmu-mir-7a-2, mmu-mir-7b, mmu-mir-217, mmu-mir-376a, mmu-mir-335, mmu-mir-133a-2, mmu-mir-133b, mmu-mir-181b-2, mmu-mir-451a, mmu-mir-216b, mmu-mir-691, mmu-mir-181d, mmu-mir-1b, mmu-mir-133c, mmu-mir-21b, mmu-let-7j, mmu-mir-21c, mmu-mir-451b, mmu-let-7k, mmu-mir-129b, mmu-mir-216c, mmu-mir-9b-2, mmu-mir-124b, mmu-mir-9b-1, mmu-mir-9b-3
Additionally, retinal preference/specificity was determined for miR-9*, miR-335, miR-31, miR-106, miR-129-3p, miR-691 and miR-26b by microarray analysis, and expression levels of miR-129-3p, miR-335 and miR-31 were also validated using qPCR.
[score:3]
Recently described retinal miRs, such as miR-129-3p, also exhibited remarkable preference, with expressed being more than 250 times higher in the retina than in the mouse platform (Figure 2c).
[score:3]
Expressions of miR-1, miR-9*, miR-26b, miR-96, miR-129-3p, miR-133, miR-138, miR-181a, miR-182, miR-335 and let7-d were explored by in situ hybridization (ISH) using locked nucleic acid (LNA) probes (Exiqon).
[score:3]
For example, miR-9*, miR-335, miR-31, miR-106b, miR-129-3p, miR-691, and miR-26b exhibited a relatively high level of expression in the retina when compared with the brain or the mouse platform.
[score:2]
MiR-129-3p was first cloned using a mouse pancreatic beta-cell line [47], whereas miR-691 was cloned from mouse embryo [48].
[score:1]
[1 to 20 of 5 sentences]
|
19 |
![]()
Other miRNAs from this paper: hsa-let-7a-1, hsa-let-7a-2, hsa-let-7a-3, hsa-mir-15a, hsa-mir-17, mmu-mir-1a-1, mmu-mir-134, hsa-mir-129-1, mmu-mir-296, hsa-mir-1-2, hsa-mir-129-2, hsa-mir-134, mmu-let-7a-1, mmu-let-7a-2, mmu-mir-15a, mmu-mir-129-2, mmu-mir-324, hsa-mir-1-1, mmu-mir-1a-2, mmu-mir-17, hsa-mir-296, hsa-mir-375, hsa-mir-378a, mmu-mir-375, mmu-mir-378a, hsa-mir-324, hsa-mir-378d-2, mmu-mir-1b, hsa-mir-378b, hsa-mir-378c, hsa-mir-378d-1, hsa-mir-378e, hsa-mir-378f, hsa-mir-378g, hsa-mir-378h, hsa-mir-378i, mmu-mir-378b, hsa-mir-378j, mmu-mir-378c, mmu-mir-378d, mmu-mir-129b
In some cases the true miRNA found more target sites than did, on average, the corresponding controls (miR-324-3p, Figure 1D), whereas in other cases each control, on average, found more targets than did the miRNA (miR-129, Figure 1E).
[score:5]
0005745.g001 Figure 1Numbers of predicted target sites per miRNA and its control sequences for (A) miR-1 and its controls with WC nt 2–8; if miR-1 hybridized with perfect WC complementarity this would yield −30.8 kcal/mol (see Methods); (B) let-7a and imposing only the requirement of WC base pairs within nucleotide positions 2–8; let-7a perfect WC complementarity would yield −33.2 kcal/mol; (C) miR-17-5p and its controls with WC nt 2–8; perfect WC complementarity would yield −44.5 kcal/mol; (D) miR-324-3p and its controls with WC nt 2–8; perfect WC complementarity would yield −52.8 kcal/mol; and (E) miR-129 and its controls with WC nt 2–8; perfect WC complementarity would yield −41.4 kcal/mol.
[score:3]
Numbers of predicted target sites per miRNA and its control sequences for (A) miR-1 and its controls with WC nt 2–8; if miR-1 hybridized with perfect WC complementarity this would yield −30.8 kcal/mol (see Methods); (B) let-7a and imposing only the requirement of WC base pairs within nucleotide positions 2–8; let-7a perfect WC complementarity would yield −33.2 kcal/mol; (C) miR-17-5p and its controls with WC nt 2–8; perfect WC complementarity would yield −44.5 kcal/mol; (D) miR-324-3p and its controls with WC nt 2–8; perfect WC complementarity would yield −52.8 kcal/mol; and (E) miR-129 and its controls with WC nt 2–8; perfect WC complementarity would yield −41.4 kcal/mol.
[score:3]
[1 to 20 of 3 sentences]
|
20 |
![]()
Other miRNAs from this paper: mmu-let-7g, mmu-let-7i, mmu-mir-30a, mmu-mir-30b, mmu-mir-151, mmu-mir-203, mmu-let-7d, mmu-mir-106b, mmu-let-7a-1, mmu-let-7a-2, mmu-let-7b, mmu-let-7c-1, mmu-let-7c-2, mmu-let-7e, mmu-let-7f-1, mmu-let-7f-2, mmu-mir-20a, mmu-mir-21a, mmu-mir-22, mmu-mir-29c, mmu-mir-34a, mmu-mir-345, mmu-mir-25, mmu-mir-223, mmu-mir-7a-1, mmu-mir-7a-2, mmu-mir-378a, mmu-mir-335, mmu-mir-802, mmu-mir-455, mmu-mir-874, mmu-mir-378b, mmu-mir-3473b, mmu-let-7j, mmu-mir-378c, mmu-mir-378d, mmu-let-7k
The expression of a miR-let-7k, b miR-129-1-3p, c miR-378d, d miR-21a-5p, e miR-29c-3p, f miR-203-3p, g miR-7a-5p in DB/DB groups (white column), db-/db-H [2]O (gray column) and db-/db-AOE (black column) detected by QRT-PCR consist with sequencing.
[score:3]
Interestingly, 7 miRNAs (let-7k, miR-378d, miR-129-1-3p, miR-21a-5p, miR-29c-3p, miR-203-3p, and miR-7a-5p) expression was significantly restored after AOE treatment.
[score:3]
Moreover, there is also the first demonstrated elevated levels of miR-874-3p, miR-7a-5p, miR-455-5p, miR-129-1-3p, miR-151-5p, miR-3473b, and down regulated levels of miR-345-3p, novel_mir_8 and let-7 k in the kidneys of db-/db- mice.
[score:2]
7 miRNAs (mmu-let-7k, mmu-miR-378d, mmu-miR-129-1-3p, mmu-miR-21a-5p, mmu-miR-29c-3p, mmu-miR-203-3p, and mmu-miR-7a-5p) were selected as candidate and quantified by qRT-PCR.
[score:1]
In them, 7 miRNAs (mmu-let-7k, mmu-miR-378d, mmu-miR-129-1-3p, mmu-miR-21a-5p, mmu-miR-29c-3p, mmu-miR-203-3p, and mmu-miR-7a-5p) were identified in both comparison groups (Fig. 2).
[score:1]
[1 to 20 of 5 sentences]
|
21 |
![]()
Other miRNAs from this paper: mmu-mir-29b-1, mmu-mir-124-3, mmu-mir-128-1, mmu-mir-146a, mmu-mir-152, mmu-mir-10b, mmu-mir-181a-2, mmu-mir-204, mmu-mir-301a, mmu-mir-21a, mmu-mir-22, mmu-mir-24-2, mmu-mir-29a, mmu-mir-29c, mmu-mir-34a, mmu-mir-129-2, mmu-mir-323, mmu-mir-326, mmu-mir-28a, mmu-mir-181a-1, mmu-mir-218-1, mmu-mir-218-2, mmu-mir-320, mmu-mir-33, mmu-mir-29b-2, mmu-mir-124-1, mmu-mir-124-2, mmu-mir-128-2, mmu-mir-449a, mmu-mir-467a-1, mmu-mir-543, mmu-mir-369, mmu-mir-675, mmu-mir-497a, mmu-mir-680-1, mmu-mir-680-2, mmu-mir-680-3, mmu-mir-449c, mmu-mir-455, mmu-mir-450b, mmu-mir-449b, mmu-mir-872, mmu-mir-467a-2, mmu-mir-467a-3, mmu-mir-467a-4, mmu-mir-467a-5, mmu-mir-467a-6, mmu-mir-467a-7, mmu-mir-467a-8, mmu-mir-467a-9, mmu-mir-467a-10, mmu-mir-28c, mmu-mir-28b, mmu-mir-21b, mmu-mir-21c, mmu-mir-129b, mmu-mir-497b, mmu-mir-124b
Additionally, because miR-129-5p was the only miRNA dysregulated in the comparison of our most senescent to least senescent cells, we examined expression of this miRNA via qRT-PCR and confirmed that it is over-expressed in P7 Ercc1 [−/−] MEFs in 20% O [2] compared to P3 WT MEFs in 3% O [2] (Supplemental Figure 4).
[score:5]
This revealed significant upregulation of one miRNA, miR-129-5p, which was increased 603-fold in Ercc1 [−/−] MEFs.
[score:4]
[1 to 20 of 2 sentences]
|
22 |
![]()
Other miRNAs from this paper: mmu-let-7g, mmu-let-7i, mmu-mir-15b, mmu-mir-29b-1, mmu-mir-34b, mmu-let-7d, mmu-let-7a-1, mmu-let-7a-2, mmu-let-7b, mmu-let-7c-1, mmu-let-7c-2, mmu-let-7e, mmu-let-7f-1, mmu-let-7f-2, mmu-mir-15a, mmu-mir-16-1, mmu-mir-16-2, mmu-mir-18a, mmu-mir-20a, mmu-mir-26b, mmu-mir-92a-2, mmu-mir-93, mmu-mir-129-2, mmu-mir-98, mmu-mir-10a, mmu-mir-19a, mmu-mir-25, mmu-mir-320, mmu-mir-221, mmu-mir-29b-2, mmu-mir-92a-1, mmu-mir-181d, mmu-mir-18b, mmu-mir-92b, mmu-let-7j, mmu-let-7k, mmu-mir-129b
To address this issue, we first screened the miRNAs whose expressions are modulated in 4T1 cells by miRNA microarray analysis using both total cellular miRNA and exosomal miRNA after treatment with 100 μM of EGCG for 24 h. In brief, a set of miRNAs including let-7, miR-16, miR-18b, miR-20a, miR-25, miR-92, miR-93, miR-221, and miR-320 were up-regulated, and dozens of miRNAs including miR-10a, miR-18a, miR-19a, miR-26b, miR-29b, miR-34b, miR-98, miR-129, miR-181d were down-regulated in both total cellular and exosomal fraction by EGCG treatment (data not shown).
[score:9]
[1 to 20 of 1 sentences]
|
23 |
![]()
Other miRNAs from this paper: mmu-let-7g, mmu-let-7i, mmu-mir-29b-1, mmu-mir-30a, mmu-mir-30b, mmu-mir-125a, mmu-mir-152, mmu-mir-155, mmu-mir-181a-2, mmu-mir-199a-1, mmu-mir-143, mmu-mir-30e, mmu-mir-299a, mmu-let-7d, mmu-mir-30c-1, mmu-mir-30c-2, mmu-mir-30d, mmu-mir-148a, mmu-let-7a-1, mmu-let-7a-2, mmu-let-7b, mmu-let-7c-1, mmu-let-7c-2, mmu-let-7e, mmu-let-7f-1, mmu-let-7f-2, mmu-mir-21a, mmu-mir-29a, mmu-mir-29c, mmu-mir-27a, mmu-mir-34a, mmu-mir-129-2, mmu-mir-103-1, mmu-mir-103-2, mmu-mir-181a-1, mmu-mir-214, mmu-mir-29b-2, mmu-mir-199a-2, mmu-mir-199b, mmu-mir-181b-1, mmu-mir-7a-1, mmu-mir-7a-2, mmu-mir-7b, mmu-mir-181b-2, mmu-mir-411, mmu-mir-466a, mmu-mir-467a-1, mmu-mir-592, mmu-mir-146b, mmu-mir-467b, mmu-mir-455, mmu-mir-702, mmu-mir-703, mmu-mir-421, mmu-mir-467c, mmu-mir-467d, mmu-mir-467e, mmu-mir-467f, mmu-mir-1192, mmu-mir-467g, mmu-mir-467h, mmu-mir-467a-2, mmu-mir-467a-3, mmu-mir-467a-4, mmu-mir-467a-5, mmu-mir-467a-6, mmu-mir-467a-7, mmu-mir-467a-8, mmu-mir-467a-9, mmu-mir-467a-10, mmu-mir-299b, mmu-mir-21b, mmu-let-7j, mmu-mir-21c, mmu-let-7k, mmu-mir-129b
Whereas miR-411 and miR-703 were regulated late during the adipocyte differentiation process and miR-129-3p was up-regulated in growth-arrested NIH/3T3 cells but down-regulated in MSCs, indicating that these three miRNAs play different roles in NIH/3T3 cells and differentiating MSCs.
[score:8]
[1 to 20 of 1 sentences]
|
24 |
![]()
Other miRNAs from this paper: mmu-mir-99b, mmu-mir-130a, mmu-mir-132, mmu-mir-134, mmu-mir-135a-1, mmu-mir-140, mmu-mir-145a, mmu-mir-149, mmu-mir-152, mmu-mir-155, mmu-mir-182, mmu-mir-183, mmu-mir-185, mmu-mir-194-1, mmu-mir-298, mmu-let-7d, mmu-let-7f-1, mmu-let-7f-2, mmu-mir-16-1, mmu-mir-16-2, mmu-mir-20a, mmu-mir-21a, mmu-mir-31, mmu-mir-129-2, mmu-mir-98, mmu-mir-103-1, mmu-mir-103-2, mmu-mir-135b, mmu-mir-210, mmu-mir-214, mmu-mir-135a-2, mmu-mir-194-2, mmu-mir-363, mmu-mir-20b, mmu-mir-147, mmu-mir-18b, mmu-mir-145b, mmu-mir-21b, mmu-mir-21c, mmu-mir-129b
Mature ID Fold Regulation miR-135b −2.6965 miR-363 −2.5995 miR-98 −2.543 miR-132 −2.355 miR-103 −2.1776 miR-99b −2.044 miR-135a −1.8734 let-7d −1.7861 miR-130a −1.6538 miR-152 −1.6246 miR-129-5p −1.6232 miR-298 −1.6169 miR-185 −1.6035 miR-214 −1.5746 miR-140 −1.5688 miR-134 −1.5667 miR-18b −1.5607 miR-194 −1.5509 let-7f −1.5107 miR-149 −1.51 A. Scatterplot showing relative expression of miRNAs by macroarray.
[score:4]
Mature ID Fold Regulation miR-135b −2.6965 miR-363 −2.5995 miR-98 −2.543 miR-132 −2.355 miR-103 −2.1776 miR-99b −2.044 miR-135a −1.8734 let-7d −1.7861 miR-130a −1.6538 miR-152 −1.6246 miR-129-5p −1.6232 miR-298 −1.6169 miR-185 −1.6035 miR-214 −1.5746 miR-140 −1.5688 miR-134 −1.5667 miR-18b −1.5607 miR-194 −1.5509 let-7f −1.5107 miR-149 −1.51 Because miRNAs typically regulate translation in animal cells, we compared CXCL10 and STAT1 protein levels in both control and Dicer [d/d] animals and cells.
[score:4]
[1 to 20 of 2 sentences]
|
25 |
![]()
Other miRNAs from this paper: mmu-mir-124-3, mmu-mir-9-2, mmu-mir-137, mmu-mir-142a, mmu-mir-155, mmu-mir-191, mmu-mir-205, mmu-let-7b, mmu-mir-21a, mmu-mir-129-2, mmu-mir-124-1, mmu-mir-124-2, mmu-mir-9-1, mmu-mir-9-3, mmu-mir-7a-1, mmu-mir-7a-2, mmu-mir-7b, mmu-mir-376c, mmu-mir-767, mmu-mir-21b, mmu-mir-21c, mmu-mir-129b, mmu-mir-142b, mmu-mir-9b-2, mmu-mir-124b, mmu-mir-9b-1, mmu-mir-9b-3
We found that silencing of TALNEC2 in U87 cells resulted in an increased expression of miRNAs associated with tumor suppression [38, 39] (e. g., let-7b, miR-7, miR-124, miR-137, miR-129-3p, miR-142-3p, miR-205, miR-376c, miR-492, miR-562 and miR-3144) and in a decrease in the expression of miRNAs associated with tumor promotion [38– 40] (e. g., miR-9, miR-21 miR-33b, miR-155, miR-191, miR-525-3p, and miR-767-3p).
[score:7]
[1 to 20 of 1 sentences]
|
26 |
![]()
Other miRNAs from this paper: mmu-mir-125b-2, mmu-mir-203, mmu-mir-19b-2, mmu-mir-18a, mmu-mir-20a, mmu-mir-21a, mmu-mir-17, mmu-mir-19a, mmu-mir-19b-1, mmu-mir-125b-1, mmu-mir-7a-1, mmu-mir-7a-2, mmu-mir-7b, mmu-mir-20b, mmu-mir-509, mmu-mir-3960, mmu-mir-21b, mmu-mir-21c
Seventeen miRNAs were found which had 2-folds or greater differences in levels in VemR A375 melanoma cells as compared with parental A375 cells by microarray (Figure 1B and Supplementary Table S1), with 7 down-regulated miRNAs including miR-7 (40.3-fold), miR-18a-5p (5.2-fold), miR-19a-3p (3.6-fold), miR-20b-5p (3.4-fold), miR-17-5p (3.2-fold), miR-20a-5p (3.1-fold), and miR-19b-3p (2.8-fold) and 10 up-regulated miRNAs including miR-514a-3p (116-fold), miR-129-1-3p (87-fold), miR-509-3p (83-fold), miR-629-3p (22-fold), miR-937-5p (4.6-fold), miR-3960 (4.3-fold), miR-1915-3p (3.2-fold), miR-6090 (3.1-fold), miR-4281 (2.6-fold) and miR-4634 (2-fold).
[score:6]
[1 to 20 of 1 sentences]
|
27 |
![]()
Other miRNAs from this paper: mmu-mir-129-2, mmu-mir-129b
Interestingly, a previous study showed that mTOR activity mediates local repression of dendritic Kv1.1 mRNA translation in rat hippocampus by microRNA miR-129–5p binding.
[score:3]
When mTOR activity was reduced, miR-129-5p binding was relieved and dendritic Kv1.1 mRNA translation was promoted 14, 34.
[score:3]
[1 to 20 of 2 sentences]
|
28 |
![]()
Other miRNAs from this paper: mmu-mir-129-2, dre-mir-129-2, dre-mir-129-1, mmu-mir-129b, dre-mir-129-3, dre-mir-129-4
Furthermore, the microRNA miR-129 promotes primary ciliogenesis by inhibiting both expression of the centriolar-capping protein CP110 and the formation of branched F-actin structures [57].
[score:5]
[1 to 20 of 1 sentences]
|
29 |
![]()
Other miRNAs from this paper: mmu-mir-99b, mmu-mir-127, mmu-mir-130a, mmu-mir-9-2, mmu-mir-132, mmu-mir-145a, mmu-mir-149, mmu-mir-181a-2, mmu-mir-182, mmu-mir-183, mmu-mir-184, mmu-mir-188, mmu-mir-199a-1, mmu-mir-200b, mmu-mir-203, mmu-mir-122, mmu-mir-143, mmu-mir-296, mmu-mir-297a-1, mmu-mir-297a-2, mmu-mir-106a, mmu-mir-130b, mmu-mir-30d, mmu-mir-200a, mmu-let-7a-1, mmu-let-7a-2, mmu-let-7c-2, mmu-mir-29c, mmu-mir-31, mmu-mir-96, mmu-mir-129-2, mmu-mir-200c, mmu-mir-181a-1, mmu-mir-199a-2, mmu-mir-199b, mmu-mir-9-1, mmu-mir-9-3, mmu-mir-381, mmu-mir-409, mmu-mir-425, mmu-mir-433, mmu-mir-466a, mmu-mir-467a-1, mmu-mir-468, mmu-mir-541, mmu-mir-542, mmu-mir-494, mmu-mir-770, mmu-mir-680-1, mmu-mir-680-2, mmu-mir-680-3, mmu-mir-681, mmu-mir-297b, mmu-mir-742, mmu-mir-883b, mmu-mir-874, mmu-mir-297a-3, mmu-mir-297a-4, mmu-mir-297c, mmu-mir-466b-1, mmu-mir-466b-2, mmu-mir-466b-3, mmu-mir-466c-1, mmu-mir-466e, mmu-mir-467d, mmu-mir-467a-2, mmu-mir-467a-3, mmu-mir-466c-2, mmu-mir-467a-4, mmu-mir-466b-4, mmu-mir-467a-5, mmu-mir-466b-5, mmu-mir-467a-6, mmu-mir-466b-6, mmu-mir-467a-7, mmu-mir-466b-7, mmu-mir-467a-8, mmu-mir-467a-9, mmu-mir-467a-10, mmu-mir-466b-8, mmu-mir-145b, mmu-mir-129b, mmu-mir-466c-3, mmu-mir-9b-2, mmu-mir-9b-1, mmu-mir-9b-3
Collectively, our results confirm the cornea expression of miRNAs already reported in literature [27, 31, 32] and reveal the corneal-enrichment of others that had not been previously described to be expressed in the eye (e. g. miR-130a, miR-130b, miR-132, miR-129-3p, the miR-200 family, miR-468, miR-874).
[score:5]
[1 to 20 of 1 sentences]
|
30 |
![]()
Other miRNAs from this paper: mmu-let-7g, mmu-let-7i, mmu-mir-99a, mmu-mir-125a, mmu-mir-125b-2, mmu-mir-126a, mmu-mir-128-1, mmu-mir-144, mmu-mir-181a-2, mmu-mir-188, mmu-let-7d, mmu-let-7a-1, mmu-let-7a-2, mmu-let-7b, mmu-let-7c-1, mmu-let-7c-2, mmu-let-7e, mmu-let-7f-1, mmu-let-7f-2, mmu-mir-34a, mmu-mir-129-2, mmu-mir-342, mmu-mir-100, mmu-mir-181a-1, mmu-mir-33, mmu-mir-211, mmu-mir-222, mmu-mir-224, mmu-mir-181b-1, mmu-mir-181c, mmu-mir-125b-1, mmu-mir-181b-2, mmu-mir-196b, mmu-mir-451a, mmu-mir-592, mmu-mir-455, mmu-mir-181d, mmu-mir-504, mmu-mir-5107, mmu-mir-5120, mmu-let-7j, mmu-mir-451b, mmu-let-7k, mmu-mir-129b, mmu-mir-126b
Hedstrom G. Thunberg U. Berglund M. Simonsson M. Amini R. M. Enblad G. Low expression of microRNA-129–5p predicts poor clinical outcome in diffuse large B cell lymphoma (DLBCL) Int.
[score:3]
MiR-129-5p and miR-100 were obviously different between patients with acute myeloid leukemia (AML) and normal controls [39, 44].
[score:1]
[1 to 20 of 2 sentences]
|
31 |
![]()
Other miRNAs from this paper: mmu-mir-21a, mmu-mir-129-2, mmu-mir-369, mmu-mir-299b, mmu-mir-21b, mmu-mir-21c, mmu-mir-129b
Moreover, latest studies reported that H [2]S participated in regulating the expression of microRNAs (miR-129, miR-299b, and miR-369) in Ang II -induced hypertensive kidney (Weber et al., 2017).
[score:4]
[1 to 20 of 1 sentences]
|
32 |
![]()
Other miRNAs from this paper: mmu-let-7g, mmu-let-7i, mmu-mir-15b, mmu-mir-23b, mmu-mir-30a, mmu-mir-30b, mmu-mir-99a, mmu-mir-125a, mmu-mir-126a, mmu-mir-9-2, mmu-mir-146a, mmu-mir-10b, mmu-mir-181a-2, mmu-mir-185, mmu-mir-194-1, mmu-mir-195a, mmu-mir-200b, mmu-mir-204, mmu-mir-206, mmu-mir-122, mmu-mir-30e, mmu-mir-34c, mmu-mir-34b, mmu-let-7d, mmu-mir-30c-1, mmu-mir-30c-2, mmu-mir-30d, mmu-mir-148a, mmu-mir-192, mmu-mir-200a, mmu-let-7a-1, mmu-let-7a-2, mmu-let-7b, mmu-let-7c-1, mmu-let-7c-2, mmu-let-7e, mmu-let-7f-1, mmu-let-7f-2, mmu-mir-15a, mmu-mir-16-1, mmu-mir-16-2, mmu-mir-21a, mmu-mir-22, mmu-mir-23a, mmu-mir-26a-1, mmu-mir-26b, mmu-mir-29a, mmu-mir-29c, mmu-mir-27a, mmu-mir-34a, mmu-mir-129-2, mmu-mir-98, mmu-mir-101b, mmu-mir-10a, mmu-mir-139, mmu-mir-200c, mmu-mir-181a-1, mmu-mir-218-1, mmu-mir-218-2, mmu-mir-26a-2, mmu-mir-222, mmu-mir-9-1, mmu-mir-9-3, mmu-mir-181b-1, mmu-mir-181c, mmu-mir-194-2, mmu-mir-361, mmu-mir-181b-2, mmu-mir-451a, mmu-mir-762, mmu-mir-802, mmu-mir-497a, mmu-mir-423, mmu-mir-690, mmu-mir-146b, mmu-mir-709, mmu-mir-712, mmu-mir-181d, mmu-mir-466f-1, mmu-mir-466f-2, mmu-mir-466f-3, mmu-mir-574, mmu-mir-466f-4, mmu-mir-195b, mmu-mir-21b, mmu-let-7j, mmu-mir-21c, mmu-mir-451b, mmu-mir-30f, mmu-let-7k, mmu-mir-129b, mmu-mir-126b, mmu-mir-497b, mmu-mir-9b-2, mmu-mir-9b-1, mmu-mir-9b-3
Some of these miRNAs, for example, miR-9, miR-9*, miR-218, miR-204, and miR-129-3p, are highly expressed in the brain with signals higher than 40,000.
[score:3]
[1 to 20 of 1 sentences]
|
33 |
![]()
Other miRNAs from this paper: mmu-mir-129-2, mmu-mir-129b
Inhibiting branched actin network formation by a microRNA mir-129-3p promotes ciliogenesis 58.
[score:3]
[1 to 20 of 1 sentences]
|
34 |
![]()
Other miRNAs from this paper: hsa-mir-101-1, mmu-mir-101a, hsa-mir-129-1, hsa-mir-221, hsa-mir-129-2, mmu-mir-129-2, mmu-mir-101b, mmu-mir-221, hsa-mir-101-2, mmu-mir-101c, mmu-mir-129b
The 3′ UTR of FMR1 mRNA is a target of miR-101, miR-129-5p and miR-221: implications for the molecular pathology of FXTAS at the synapse.
[score:3]
[1 to 20 of 1 sentences]
|
35 |
![]()
Leptin elongates hypothalamic cilia via transcriptional regulation and actin destabilization (Kang et al., 2015), whereas the microRNA miR-129-3p regulates cilia assembly through the concomitant transcriptional silencing of centrosomal proteins and repression of actin filament formation (Cao et al., 2012).
[score:3]
[1 to 20 of 1 sentences]
|
36 |
![]()
Other miRNAs from this paper: mmu-mir-101a, mmu-mir-152, mmu-mir-148a, mmu-mir-192, mmu-mir-15a, mmu-mir-16-1, mmu-mir-16-2, mmu-mir-129-2, mmu-mir-148b, mmu-mir-101b, mmu-mir-215, mmu-mir-101c, mmu-mir-129b
Lars et al. documented a direct link between miR-129 and 2 putative targets GALNT1 and SOX4 by luciferase activity assay in HEK293 cells [11].
[score:3]
[1 to 20 of 1 sentences]
|
37 |
![]()
Other miRNAs from this paper: mmu-let-7g, mmu-let-7i, mmu-mir-124-3, mmu-mir-125a, mmu-mir-125b-2, mmu-mir-128-1, mmu-mir-9-2, mmu-mir-132, mmu-mir-134, mmu-mir-137, mmu-mir-138-2, mmu-mir-146a, mmu-mir-181a-2, mmu-mir-185, mmu-mir-188, mmu-mir-200b, mmu-mir-34c, mmu-let-7d, mmu-mir-200a, mmu-let-7a-1, mmu-let-7a-2, mmu-let-7b, mmu-let-7c-1, mmu-let-7c-2, mmu-let-7e, mmu-let-7f-1, mmu-let-7f-2, mmu-mir-29a, mmu-mir-34a, mmu-mir-129-2, mmu-mir-17, mmu-mir-200c, mmu-mir-181a-1, mmu-mir-124-1, mmu-mir-124-2, mmu-mir-9-1, mmu-mir-9-3, mmu-mir-138-1, mmu-mir-125b-1, mmu-mir-128-2, mmu-mir-7a-1, mmu-mir-7a-2, mmu-mir-375, mmu-mir-483, mmu-mir-541, mmu-mir-92b, mmu-let-7j, mmu-let-7k, mmu-mir-129b, mmu-mir-9b-2, mmu-mir-124b, mmu-mir-9b-1, mmu-mir-9b-3
Degradation of high affinity HuD targets releases Kv1.1 mRNA from miR-129 repression by mTORC1.
[score:3]
[1 to 20 of 1 sentences]
|
38 |
![]()
Other miRNAs from this paper: mmu-let-7g, mmu-let-7i, mmu-mir-23b, mmu-mir-295, mmu-let-7d, mmu-let-7a-1, mmu-let-7a-2, mmu-let-7b, mmu-let-7c-1, mmu-let-7c-2, mmu-let-7e, mmu-let-7f-1, mmu-let-7f-2, mmu-mir-27a, mmu-mir-129-2, mmu-mir-196b, mmu-let-7j, mmu-let-7k, mmu-mir-129b
Chen X Zhang Y Shi Y Lian H Tu H Han S Yin J Peng B Zhou B He X MiR-129 triggers autophagic flux by regulating a novel Notch-1/E2F7/Beclin-1 axis to impair the viability of human malignant glioma cellsOncotarget.
[score:3]
[1 to 20 of 1 sentences]
|
39 |
![]()
Other miRNAs from this paper: mmu-mir-30b, mmu-mir-132, mmu-mir-134, mmu-mir-135a-1, mmu-mir-146a, mmu-mir-154, mmu-mir-183, mmu-mir-143, mmu-mir-30c-1, mmu-mir-30c-2, mmu-let-7e, mmu-mir-96, mmu-mir-34a, mmu-mir-129-2, mmu-mir-17, mmu-mir-135a-2, mmu-mir-129b
But only 13 miRNAs had significantly differential expression, they were let-7e, miR-30b, miR-30c, miR-34a, miR-96, miR-129-3p, miR-132, miR-134, miR-135a, miR-143, miR-146a, mkiR-154 and miR-183, respectively (Fig. 1C).
[score:3]
[1 to 20 of 1 sentences]
|
40 |
![]()
Other miRNAs from this paper: mmu-let-7g, mmu-mir-15b, mmu-mir-99a, mmu-mir-99b, mmu-mir-101a, mmu-mir-146a, mmu-mir-151, mmu-mir-155, mmu-mir-106a, mmu-mir-16-1, mmu-mir-16-2, mmu-mir-129-2, mmu-mir-101b, mmu-mir-17, mmu-mir-221, mmu-mir-382, mmu-mir-802, mmu-mir-654, mmu-mir-101c, mmu-mir-129b
Zongaro S, Hukema R, D'Antoni S, Davidovic L, Barbry P, Catania MV, et al. The 3′ UTR of FMR1 mRNA is a target of miR-101, miR-129-5p and miR-221: implications for the molecular pathology of FXTAS at the synapse.
[score:3]
[1 to 20 of 1 sentences]
|
41 |
![]()
Other miRNAs from this paper: mmu-mir-135a-1, mmu-mir-142a, mmu-mir-153, mmu-mir-183, mmu-mir-186, mmu-mir-187, mmu-mir-206, mmu-mir-207, mmu-mir-296, mmu-mir-298, mmu-mir-301a, mmu-mir-129-2, rno-mir-301a, rno-mir-129-2, mmu-mir-19a, mmu-mir-135a-2, mmu-mir-380, rno-mir-19a, rno-mir-129-1, rno-mir-135a, rno-mir-142, rno-mir-153, rno-mir-183, rno-mir-186, rno-mir-187, rno-mir-206, rno-mir-296, rno-mir-298, mmu-mir-433, rno-mir-433, rno-mir-207, mmu-mir-301b, mmu-mir-761, mmu-mir-705, mmu-mir-449b, rno-mir-301b, rno-mir-380, rno-mir-761, mmu-mir-129b, mmu-mir-142b
Majority of the dysregulated microRNAs e. g. miR-380, miR-207, miR-79, miR-129, miR-153, miR-183, etc.
[score:2]
Circulating levels of miR-129 and miR-142 were reduced in congestive heart failure [59, 60].
[score:1]
[1 to 20 of 2 sentences]
|
42 |
![]()
Other miRNAs from this paper: hsa-mir-129-1, hsa-mir-34a, hsa-mir-129-2, mmu-mir-34a, mmu-mir-129-2, hsa-mir-1291, mmu-mir-129b, mmu-mir-1291
The protein levels of AKT2 and MeCP2 were indeed reduced in miR-129 -expressing PANC-1 cells (unpublished data) or MCF-7 cells transiently transfected with miR-1291 agent [31].
[score:3]
[1 to 20 of 1 sentences]
|
43 |
![]()
Other miRNAs from this paper: mmu-mir-1a-1, mmu-mir-29b-1, mmu-mir-133a-1, mmu-mir-24-1, mmu-mir-195a, mmu-mir-199a-1, mmu-mir-208a, mmu-mir-21a, mmu-mir-23a, mmu-mir-24-2, mmu-mir-29a, mmu-mir-29c, mmu-mir-129-2, mmu-mir-1a-2, mmu-mir-210, mmu-mir-29b-2, mmu-mir-199a-2, mmu-mir-199b, mmu-mir-133a-2, mmu-mir-133b, mmu-mir-494, mmu-mir-455, mmu-mir-208b, mmu-mir-1b, mmu-mir-195b, mmu-mir-133c, mmu-mir-21b, mmu-mir-21c, mmu-mir-129b
For example, miRNA-21, miRNA-23a, miRNA-24, miRNA-133, miRNA-208/miRNA-195 and miRNA-199 have been shown to be involved in cardiac hypertrophy (15- 17), miRNA-1 in arrhythmia (18), miRNA-29 and miRNA-21 in cardiac fibrosis (19, 20), miRNA-210 and miRNA-494 in ischemic heart disease (21) and miRNA-129 in heart failure (22).
[score:3]
[1 to 20 of 1 sentences]
|
44 |
![]()
Other miRNAs from this paper: mmu-mir-126a, mmu-mir-146a, mmu-mir-155, hsa-mir-129-1, mmu-mir-122, hsa-mir-210, mmu-mir-294, hsa-mir-122, hsa-mir-126, hsa-mir-129-2, hsa-mir-146a, mmu-mir-129-2, mmu-mir-346, hsa-mir-155, mmu-mir-210, hsa-mir-346, mmu-mir-721, mmu-mir-101c, mmu-mir-129b, mmu-mir-126b
Autophagic digestion of Leishmania major by host macrophages is associated with differential expression of BNIP3, CTSE, and the miRNAs miR-101c, miR-129, and miR-210.
[score:3]
[1 to 20 of 1 sentences]
|
45 |
![]()
Other miRNAs from this paper: mmu-mir-134, mmu-mir-138-2, mmu-mir-142a, mmu-mir-34c, mmu-mir-34b, mmu-mir-26a-1, mmu-mir-34a, mmu-mir-129-2, mmu-mir-338, mmu-mir-340, mmu-mir-139, mmu-mir-26a-2, mmu-mir-222, mmu-mir-138-1, mmu-mir-448, mmu-mir-146b, mmu-mir-3095, mmu-mir-3470a, mmu-mir-129b, mmu-mir-142b
ADAM10 is a predicted target of miR-129 and miR-448 and is involved in CX3CL1 cleavage.
[score:3]
[1 to 20 of 1 sentences]
|
46 |
![]()
Other miRNAs from this paper: mmu-mir-9-2, mmu-mir-122, mmu-mir-34c, mmu-mir-34b, mmu-mir-21a, mmu-mir-92a-2, mmu-mir-34a, mmu-mir-129-2, mmu-mir-103-1, mmu-mir-103-2, mmu-mir-17, mmu-mir-19a, mmu-mir-25, mmu-mir-28a, mmu-mir-214, mmu-mir-9-1, mmu-mir-9-3, mmu-mir-28c, mmu-mir-28b, mmu-mir-21b, mmu-mir-21c, mmu-mir-129b, mmu-mir-9b-2, mmu-mir-9b-1, mmu-mir-9b-3
MiR-129 was suggested to participate in the anti-CRC action of piceatannol, a naturally occurring analog of Res, by targeting Bcl-2 [33].
[score:2]
[1 to 20 of 1 sentences]
|
47 |
![]()
Li X, Wang S, Li Z, Long X, Guo Z, Zhang G, Zu J, Chen Y, Wen L. NEAT1 induces epithelial-mesenchymal transition and 5-FU resistance through the miR-129/ZEB2 axis in breast cancer.
[score:1]
[1 to 20 of 1 sentences]
|
48 |
![]()
Other miRNAs from this paper: mmu-mir-30a, mmu-mir-30b, mmu-mir-140, mmu-mir-141, mmu-mir-30e, mmu-mir-30c-1, mmu-mir-30c-2, mmu-mir-30d, mmu-mir-200a, mmu-mir-92a-2, mmu-mir-96, mmu-mir-129-2, mmu-mir-32, mmu-mir-218-1, mmu-mir-218-2, mmu-mir-92a-1, mmu-mir-92b, mmu-mir-129b, mmu-mir-1271
Using significant microarray genes with a p < 0.01, ToppCluster identified 7 different miRNA binding sites, with 9 different miRNAs listed: MIR-32, MIR-92, MIR-96, MIR-129-5p, MIR-140-3p, MIR-141, MIR-200A, MIR-218, and MIR-1271.
[score:1]
[1 to 20 of 1 sentences]
|
49 |
![]()
Other miRNAs from this paper: mmu-mir-128-1, mmu-mir-9-2, mmu-mir-132, mmu-mir-141, mmu-mir-182, mmu-mir-183, mmu-mir-200b, mmu-mir-34c, mmu-mir-34b, mmu-mir-200a, mmu-let-7a-1, mmu-let-7a-2, mmu-let-7c-1, mmu-let-7c-2, mmu-mir-26a-1, mmu-mir-92a-2, mmu-mir-96, mmu-mir-34a, mmu-mir-129-2, mmu-mir-344-1, mmu-mir-17, mmu-mir-200c, mmu-mir-212, mmu-mir-26a-2, mmu-mir-92a-1, mmu-mir-9-1, mmu-mir-9-3, mmu-mir-128-2, mmu-mir-7a-1, mmu-mir-7a-2, mmu-mir-429, mmu-mir-344d-3, mmu-mir-344d-1, mmu-mir-344d-2, mmu-mir-495, mmu-mir-709, mmu-mir-676, mmu-mir-344-2, mmu-mir-92b, mmu-mir-344e, mmu-mir-344b, mmu-mir-344c, mmu-mir-344g, mmu-mir-344f, mmu-mir-344h-1, mmu-mir-344h-2, mmu-mir-344i, mmu-mir-129b, mmu-mir-9b-2, mmu-mir-9b-1, mmu-mir-9b-3
Three miRNAs in FCx (miR-128, miR-129-5p, and miR-344) and one miRNA in HP (miR-7a) map to two chromosomal loci (Table S1).
[score:1]
[1 to 20 of 1 sentences]
|
50 |
![]()
Other miRNAs from this paper: mmu-mir-125a, mmu-mir-125b-2, mmu-mir-146a, mmu-mir-150, mmu-mir-186, mmu-mir-188, mmu-mir-206, mmu-mir-16-1, mmu-mir-16-2, mmu-mir-26a-1, mmu-mir-27a, mmu-mir-129-2, mmu-mir-223, mmu-mir-26a-2, mmu-mir-222, mmu-mir-125b-1, mmu-mir-146b, mmu-mir-129b
For some of the miRNAs (miR-129, 151, 184, 185, 202, 212 and 351), we could not obtain any hybridization signal on Northern blots, so we were unable to compare Northern and array data.
[score:1]
[1 to 20 of 1 sentences]
|
51 |
![]()
Other miRNAs from this paper: mmu-let-7g, mmu-let-7i, mmu-mir-124-3, mmu-mir-134, mmu-mir-137, mmu-mir-194-1, mmu-let-7d, mmu-mir-192, mmu-mir-196a-1, mmu-mir-196a-2, mmu-let-7a-1, mmu-let-7a-2, mmu-let-7b, mmu-let-7c-1, mmu-let-7c-2, mmu-let-7e, mmu-let-7f-1, mmu-let-7f-2, mmu-mir-20a, mmu-mir-93, mmu-mir-129-2, mmu-mir-100, mmu-mir-210, mmu-mir-223, mmu-mir-33, mmu-mir-222, mmu-mir-124-1, mmu-mir-124-2, mmu-mir-194-2, mmu-mir-215, mmu-mir-429, mmu-mir-452, mmu-let-7j, mmu-let-7k, mmu-mir-129b, mmu-mir-124b
41 mmu-miR-33 −59.71 mmu-miR-222 1.23 mmu-miR-93 −1.52 mmu-miR-124 −97.01 mmu-miR-429 1.07 mmu-miR-192 −1.52 mmu-miR-129-5p −111.43 mmu-miR-100 −1.74 mmu-miR-210 −157.59 mmu-miR-20a −2 mmu-miR-134 −194.01 mmu-miR-137 −2 mmu-miR-215 −222.86 mmu-miR-194 −2.14 mmu-miR-452 −675.59 mmu-miR-196a −2.64 mmu-miR-223 −955.43 Differentiated sample versus control sample [DIF EBs d8/CONTROL EBs d8].
[score:1]
[1 to 20 of 1 sentences]
|
52 |
![]()
Other miRNAs from this paper: hsa-let-7a-1, hsa-let-7a-2, hsa-let-7a-3, hsa-let-7b, hsa-let-7c, hsa-let-7d, hsa-let-7e, hsa-let-7f-1, hsa-let-7f-2, hsa-mir-21, hsa-mir-22, hsa-mir-25, hsa-mir-33a, hsa-mir-96, mmu-let-7g, mmu-let-7i, mmu-mir-1a-1, mmu-mir-125a, mmu-mir-125b-2, mmu-mir-9-2, mmu-mir-133a-1, mmu-mir-141, mmu-mir-155, mmu-mir-10b, mmu-mir-181a-2, mmu-mir-183, mmu-mir-184, hsa-mir-192, mmu-mir-200b, hsa-mir-129-1, mmu-mir-122, hsa-mir-7-1, hsa-mir-7-2, hsa-mir-7-3, hsa-mir-10a, hsa-mir-10b, hsa-mir-34a, hsa-mir-181a-2, hsa-mir-183, hsa-mir-210, hsa-mir-181a-1, hsa-mir-216a, hsa-mir-217, hsa-mir-223, hsa-mir-200b, mmu-mir-34c, mmu-mir-34b, mmu-let-7d, hsa-let-7g, hsa-let-7i, hsa-mir-1-2, hsa-mir-122, hsa-mir-125b-1, hsa-mir-133a-1, hsa-mir-133a-2, hsa-mir-141, hsa-mir-9-1, hsa-mir-9-2, hsa-mir-9-3, hsa-mir-125a, hsa-mir-125b-2, hsa-mir-129-2, hsa-mir-184, mmu-mir-192, mmu-mir-200a, mmu-let-7a-1, mmu-let-7a-2, mmu-let-7b, mmu-let-7c-1, mmu-let-7c-2, mmu-let-7e, mmu-let-7f-1, mmu-let-7f-2, mmu-mir-21a, mmu-mir-22, mmu-mir-96, mmu-mir-34a, mmu-mir-129-2, hsa-mir-1-1, mmu-mir-1a-2, hsa-mir-155, mmu-mir-10a, mmu-mir-25, mmu-mir-210, mmu-mir-181a-1, mmu-mir-216a, mmu-mir-223, mmu-mir-33, mmu-mir-9-1, mmu-mir-9-3, mmu-mir-125b-1, mmu-mir-7a-1, mmu-mir-7a-2, mmu-mir-7b, mmu-mir-217, hsa-mir-200a, hsa-mir-34b, hsa-mir-34c, hsa-mir-375, mmu-mir-375, mmu-mir-133a-2, mmu-mir-133b, hsa-mir-133b, hsa-mir-33b, mmu-mir-216b, hsa-mir-216b, mmu-mir-1b, mmu-mir-133c, mmu-mir-21b, mmu-let-7j, mmu-mir-21c, mmu-let-7k, mmu-mir-129b, mmu-mir-216c, bbe-let-7a-1, bbe-let-7a-2, bbe-mir-10a, bbe-mir-10b, bbe-mir-10c, bbe-mir-125a, bbe-mir-125b, bbe-mir-129a, bbe-mir-129b, bbe-mir-133, bbe-mir-1, bbe-mir-183, bbe-mir-184, bbe-mir-200a, bbe-mir-200b, bbe-mir-210, bbe-mir-216, bbe-mir-217, bbe-mir-22, bbe-mir-252a, bbe-mir-252b, bbe-mir-278, bbe-mir-281, bbe-mir-33-1, bbe-mir-33-2, bbe-mir-34a, bbe-mir-34b, bbe-mir-34c, bbe-mir-34d, bbe-mir-34f, bbe-mir-375, bbe-mir-7, bbe-mir-71, bbe-mir-9, bbe-mir-96, bbe-mir-34g, bbe-mir-34h, mmu-mir-9b-2, mmu-mir-9b-1, mmu-mir-9b-3
In contrast, the sequencing frequency of miR-129, miR-s53, miR-s26, miR-s31, miR-s46, and so on was extremely low in our library.
[score:1]
[1 to 20 of 1 sentences]
|