![]() |
miRBase |
![]() |
![]() |
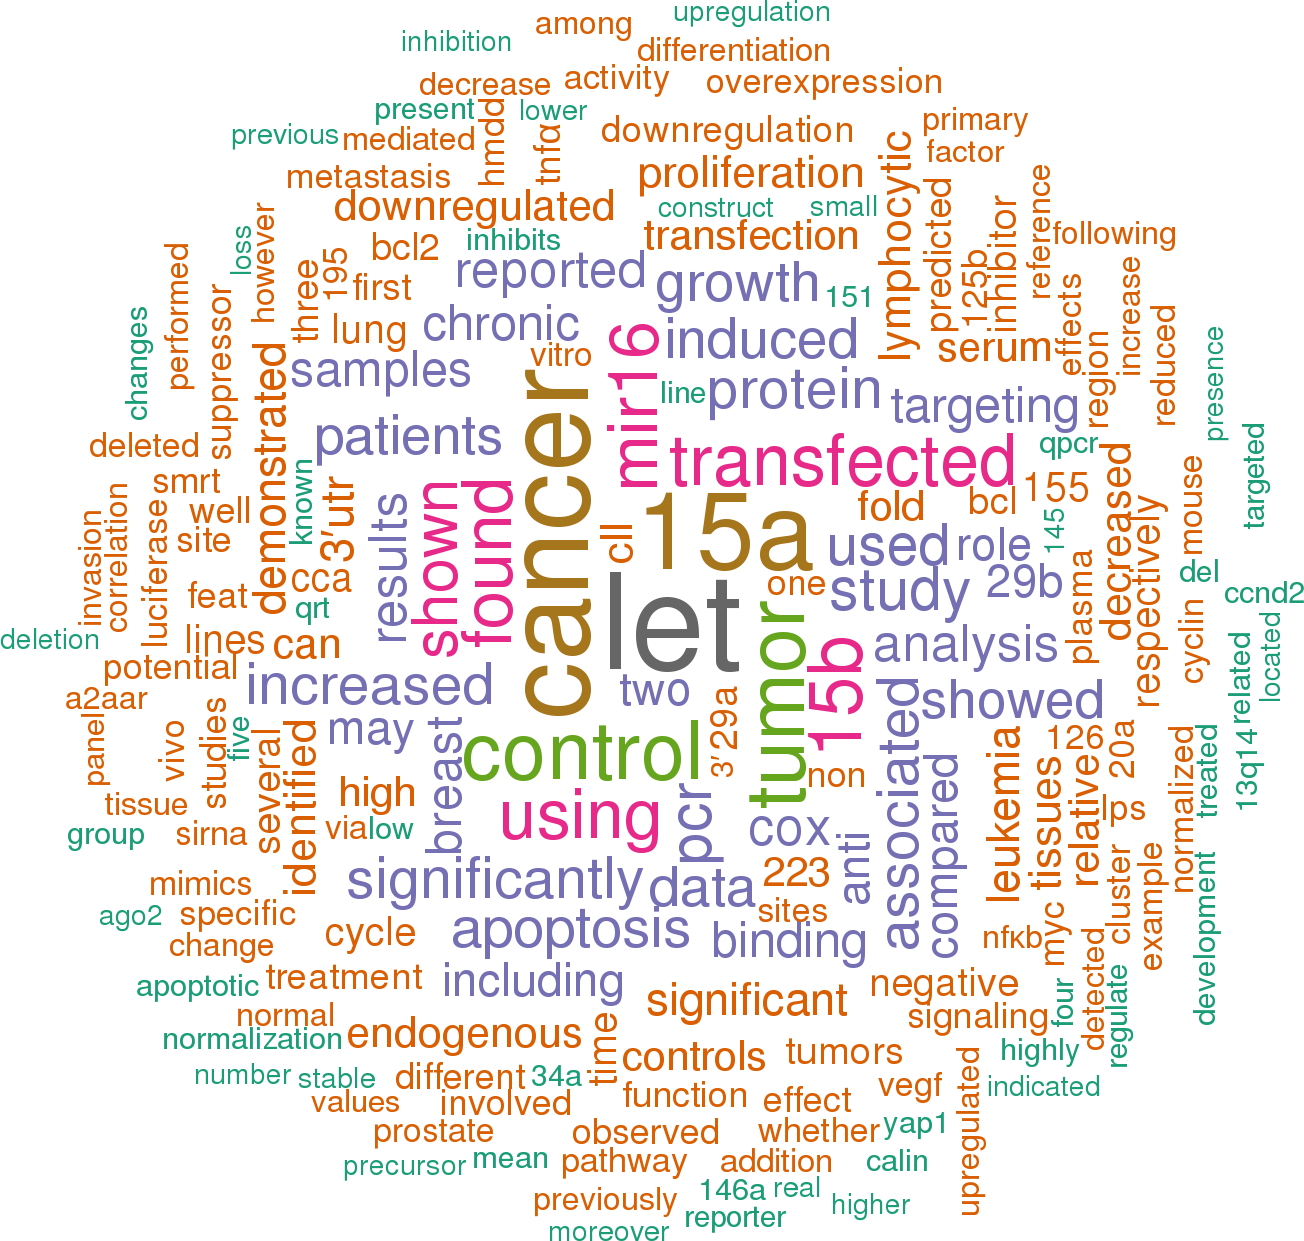
![]() 730 publications mentioning hsa-mir-16-1 (showing top 100)Open access articles that are associated with the species Homo sapiens and mention the gene name mir-16-1. Click the [+] symbols to view sentences that include the gene name, or the word cloud on the right for a summary. |
|
1 |
![]()
Other miRNAs from this paper: hsa-mir-15a, hsa-mir-17, hsa-mir-21, hsa-mir-22, hsa-mir-23a, hsa-mir-29a, hsa-mir-29b-1, hsa-mir-29b-2, hsa-mir-16-2, mmu-mir-15b, mmu-mir-29b-1, mmu-mir-191, hsa-mir-197, hsa-mir-221, hsa-mir-222, hsa-mir-224, hsa-mir-15b, hsa-mir-191, mmu-mir-15a, mmu-mir-16-1, mmu-mir-16-2, mmu-mir-21a, mmu-mir-22, mmu-mir-23a, mmu-mir-29a, mmu-mir-29c, mmu-mir-17, mmu-mir-221, mmu-mir-222, mmu-mir-224, mmu-mir-29b-2, hsa-mir-29c, hsa-mir-376a-1, hsa-mir-378a, mmu-mir-376a, mmu-mir-378a, mmu-mir-410, mmu-mir-434, hsa-mir-451a, mmu-mir-451a, hsa-mir-410, hsa-mir-485, hsa-mir-493, mmu-mir-485, hsa-mir-376a-2, hsa-mir-378d-2, mmu-mir-702, mmu-mir-190b, mmu-mir-493, hsa-mir-190b, hsa-mir-378b, hsa-mir-378c, hsa-mir-378d-1, hsa-mir-378e, hsa-mir-378f, hsa-mir-378g, hsa-mir-378h, hsa-mir-378i, mmu-mir-378b, hsa-mir-451b, hsa-mir-378j, mmu-mir-21b, mmu-mir-378c, mmu-mir-21c, mmu-mir-378d, mmu-mir-451b
To explore whether HRG regulation of miR-16 was mediated via c-Myc and Stat3 expression, we silenced the expression of both proteins by the use of siRNAs and found that, comparable to our findings with MPA, silencing of Stat3 or of c-Myc both impair HRG -induced miR-16 downregulation in BT-474 cells (Figure 6G), suggesting that HRG and MPA share some of the signaling molecules in the mechanism of downregulation of miR-16.
[score:12]
Among the downregulated miRNAs in leiomyomas, the authors identified miR-16, miR-197 and miR-224, three miRNAs we observed to be downregulated in progestin -induced breast cancer [82], highlighting the importance of miR-16 as a tumor suppressor in different cellular contexts.
[score:9]
As shown in Figure 4F, MPA did not induce cyclin E upregulation in miR-16 -overexpressing C4HD cells, indicating that CCNE1 mRNA is indeed a direct target of miR-16.
[score:9]
In advanced prostate cancer, for instance, miR-15a and miR-16 are significantly downregulated, whereas the expression of BCL2, CCND1 and WNT3A is concomitantly upregulated [37].
[score:9]
Moreover, overexpression of miR-16 abrogated the ability of progestin to induce cyclin E upregulation, revealing that cyclin E is a novel target of miR-16 in breast cancer.
[score:8]
Among the differentially expressed miRNAs, we were particularly interested in miR-16, a previously reported tumor suppressor in leukemia [67, 68], which was downregulated by treatment with MPA.
[score:8]
Importantly, the tumor suppressor miR-16 was among the downregulated miRNAs, and the cell cycle promoter protein cyclin E was identified as one of its targets (Figure 7).
[score:8]
Our present findings showed that indeed the knockdown of Stat3 expression resulted in a complete abrogation of MPA -induced miR-16 downregulation (Figure 3C).
[score:7]
Our present results indicate that the synthetic progestin MPA, a potent mitogen in C4HD and T47D cells, regulates a subset of miRNAs in mammary tumor cells including the tumor suppressor miR-16, which is downregulated.
[score:7]
The comparison between control- and MPA -treated cells revealed that 16 miRNAs were significantly modulated by more than two-fold (P < 0.05, Figure 1A), nine miRNAs were upregulated (miR-191*, miR-17*, miR- 470*, miR-451, miR-702, miR-434-3p, miR-493, miR-23a* and miR-485*) and seven were downregulated (miR-378*, miR-376a, miR-224, miR-190b, miR-16, miR-410 and miR-197) (Figure 1B).
[score:7]
In the current study, we found that transfection with a precursor of miR-16 (pre-miR-16) resulted in the inhibition of MPA -induced cyclin D1 expression in C4HD cells, indicating that cyclin D1 is also a downstream target of miR-16 in breast tumor cells (Figure 4A, upper panel).
[score:7]
Overexpression of miR-16 also inhibited progestin -induced breast tumor growth in vitro and in vivo, demonstrating for the first time, a role for miR-16 as a tumor suppressor in mammary tumorigenesis.
[score:7]
To predict novel targets for miR-16, we used miRecords, a publicly available miRNA target prediction tool that integrates the predicted targets of the most commonly used search engines.
[score:7]
Our results demonstrate that HRG induces a similar mechanism to the one induced by progestins upstream of miR-16 downregulation, that is, activation of Stat3 and upregulation of c-Myc.
[score:7]
To explore the direct involvement of c-Myc in the molecular mechanism of MPA -induced miR-16 downregulation, we silenced c-Myc expression using siRNAs.
[score:7]
Treatment of C4HD cells with the anti-progestin RU486 or silencing of PR expression using siRNAs overcame the MPA -induced miR-16 downregulation, indicating that this effect is mediated through the classical PR (Figure 2B).
[score:6]
A search for miR-16 targets showed that the CCNE1 gene, encoding the cell cycle regulator cyclin E, contains conserved putative miR-16 target sites in its mRNA 3' UTR region.
[score:6]
As demonstrated for C4HD and T47D cells, the miR-16 decrease was preceded by the upregulation of c-Myc oncogene (Figure 6C, left panel) and was coincident with an increase in cyclin E expression levels (Figure 6C, right panel).
[score:6]
As shown in Figure 6D, we found that HRG treatment induced a significant downregulation of miR-16 expression in BT-474 cells.
[score:6]
Our findings indicate that progestins, acting through the classical PR and via Stat3 and c-Myc, downregulate miR-16, which is a potent tumor suppressor in breast cancer.
[score:6]
These inhibitory effects on proliferation may be due, at least in part, to the capacity of miR-16 to inhibit cyclin E. In fact, we observed via immunohistochemistry that pre-miR-16-C4HD tumors expressed significantly lower levels of cyclin E as compared to pre-miR-CTRL-C4HD tumors.
[score:6]
Figure 3B (left panel) shows that knockdown of c-Myc resulted in the inhibition of MPA -induced effects on miR-16 expression.
[score:6]
The latter event results in the upregulation of the oncogenic transcription factor c-Myc (Step 4), which represses miR-16 expression by binding to E-box response elements and inducing chromatin remo deling (decrease of AcH4 and increase of H3K9me [3], Step 5) [36, 73, 74].
[score:6]
Pro-tumor effects of miR-16 downregulation in breast cancer are mediated by cyclin E. miR-16 acts as a tumor suppressor in both in vivo and in vitro progestin -induced breast cancer growth.
[score:6]
miR-16, whose function as a tumor suppressor in leukemia has already been shown, was identified as one of the downregulated miRNAs in murine and human breast cancer cells.
[score:6]
In this study, we reveal the first progestin-regulated miRNA expression profile and identify a novel role for miR-16 as a tumor suppressor in progestin- and growth factor -induced growth in breast cancer.
[score:6]
We also found that the ErbB ligand heregulin (HRG) downregulated the expression of miR-16, which then participates in the proliferative activity of HRG in breast tumor cells.
[score:6]
This decrease in the levels of intracellular miR-16 would result in increased expression of its targets, including cyclin D1 and E, and would lead to cell growth (Step 6).
[score:5]
B, C4HD cells were treated with MPA or pretreated with 10 nM RU486 before MPA stimulation, and mRNA expression levels of candidate miR-16 target genes were determined by RT-qPCR.
[score:5]
In accordance with the results presented here, overexpression of miR-16 was shown to suppress the self-renewal and growth of mouse mammary tumor stem cells and to sensitize MCF-7 human breast cancer cells to the chemotherapeutic drug doxorubicin [85].
[score:5]
Decreased levels of miR-16 would result in an increased expression of its targets, including cyclin D1 and cyclin E, and would lead to cell growth (Step 6).
[score:5]
We found that, similar to the molecular mechanism underlying progestin-modulated miR-16 expression, Stat3 and c-Myc participated in the induction of cyclin E expression by progestin.
[score:5]
The above results support a role for MPA as a repressor of miR-16 expression via c-Myc, inducing the recruitment of proteins with activity of chromatin remo delers which modulate gene expression.
[score:5]
Furthermore, overexpression of miR-16 resulted in significant inhibition of HRG -induced stimulation of BT-474 cell growth (Figure 6E, left panel).
[score:5]
The PR/Stat3 transcriptional complex and possibly also Stat3 bound to GAS sites, induce the expression of c-Myc, which would in turn associate with the DLEU2 promoter and repress the expression of miR-16 (Step 5).
[score:5]
Target genes of miR-16 were searched through a bioinformatical approach, and the study was focused on cyclin E. Reporter gene assays were performed to confirm that cyclin E 3'UTR is a direct target of miR-16.
[score:5]
As shown in Figure 2D, MPA induces a strong proliferative response in both cell lines, which correlates with its ability to induce the downregulation of miR-16 levels (Figure 2A).
[score:4]
Because Stat3 was found to be directly involved [55] in these mechanisms, we reasoned that Stat3 may constitute an interesting gene whose participation in progestin -mediated miR-16 expression was worth studying.
[score:4]
This paucity indicates that miR-16 downregulation is most likely driven not by PR loading at the DLEU2 promoter, but rather by nonclassical PR tethering mechanisms.
[score:4]
No modulation of miR-16 levels was observed following the sole addition of RU486 or after knockdown of PR expression in unstimulated cells (Figure 2B).
[score:4]
Reconstitution of PR-B levels in T47D-Y cells [55] restored MPA capacity to downregulate miR-16 (Figure 2C).
[score:4]
Downregulation of miR-16 was also associated with resistance to the chemotherapeutic drug docetaxel in human breast cancer cells [86].
[score:4]
In the past several years, miR-16 has been shown to be frequently downregulated in chronic lymphocytic leukemia [67].
[score:4]
Progestins downregulate miR-16 via the classical PR and a hierarchical interplay between Stat3 and c-Myc.
[score:4]
Figure 7 illustrates our proposed mo del of progestin -mediated regulation of miR-16 expression leading to breast cancer growth, based on our previous and present findings.
[score:4]
In order to explore whether rapid signaling through PR and/or genomic effects participate in the MPA-downregulation of miR-16, we transfected T47D-Y cells with a PR mutant, PR-BmPro, in which three prolines (P422A, P423A, P427A) were converted to alanines (T47D-Y-PR-BmPro cells).
[score:4]
Progestins downregulate miR-16 in breast cancer cells via the classical PR and a hierarchical interplay between Stat3 and c-Myc.
[score:4]
These findings demonstrate the participation of both rapid (nongenomic) and transcriptional PR effects in progestin -induced miR-16 downregulation.
[score:4]
Figure 3 Progestin induces miR-16 downregulation via c-Myc and Stat3.
[score:4]
Figure 2 Progestins induce miR-16 downregulation via the classical PR.
[score:4]
In vitro proliferation was abolished by transfection with a miR-16 precursor and, more importantly, in vivo expression of miR-16 resulted in the development of smaller tumors, with a growth rate significantly lower than those of the tumors from the control group.
[score:4]
To explore the upstream effectors involved in the MPA -mediated downregulation of miR-16, we first conducted an in silico analysis.
[score:4]
In this sense, it is worth mentioning a study which came out during the preparation of this manuscript showing that estradiol induces proliferation and upregulation of survival genes in breast cancer cells, through the repression of several miRNA, among them miR-16 [96].
[score:4]
Remarkably, we demonstrated that miR-16 is significantly downregulated by MPA treatment in an in vivo setting.
[score:4]
Our findings show that progestins downregulate miR-16 via the classical PR and a hierarchical interplay between Stat3 and c-Myc.
[score:4]
We propose that the requirement for both the rapid and genomic functions of PR during the regulation of miR-16 expression by progestins, as demonstrated in our study, may be explained by the fact that after being rapidly activated by PR, Stat3 is recruited, along with PR, to the PRE at the c-Myc promoter, where it acts as a PR co-activator (Step 3).
[score:4]
The role of c-Myc as a transcriptional repressor of miR-16 has previously been shown [36, 73] and we here also demonstrate its involvement in mR-16 downregulation upon progestin treatment.
[score:4]
Therefore, we hypothesized that c-Myc, long known to be an immediate early gene for several proliferative signal cascades and whose induction by PR is well acknowledged [13, 69, 70], may also be an upstream effector in MPA -induced miR-16 downregulation.
[score:4]
We identified Stat3 as a key player in the downregulation of miR-16 by progestin.
[score:4]
Figure 7 Mo del of MPA -induced miR-16 downregulation and cell-cycle control.
[score:4]
We showed, for the first time, that miR-16 is involved in progestin -induced tumor growth in vitro and in vivo, having the cell-cycle promoter cyclin E as a target.
[score:3]
To generalize our discovery of the role of miR-16 as a tumor suppressor, we decided to explore its involvement in the proliferation of breast cancer induced by growth factors, which along with estradiol and progestin are the major mitogens in breast cancer.
[score:3]
In A to C, miR-16 expression levels were determined by RT-qPCR.
[score:3]
These findings constitute the first piece of evidence to suggest a role for miR-16 as a tumor suppressor in progestin -induced breast cancer growth.
[score:3]
Interestingly, we also demonstrated the involvement of miR-16 in HRG -induced breast cancer cell proliferation, confirming the ability of miR-16 to act as a tumor suppressor during breast cancer cell proliferation.
[score:3]
A variety of targets for miR-16 has already been reported, including the cell-cycle promoter cyclin D1 and the anti-apoptotic protein Bcl-2 [37].
[score:3]
The results presented here indicate for the first time a role for miR-16 as a tumor suppressor in breast cancer.
[score:3]
miR-16 targets were searched using the search engine miRecords [58, 59].
[score:3]
miR-16 expression was studied by RT-qPCR in cancer cell lines with silenced PR, signal transducer and activator of transcription 3 (Stat3) or c-Myc, treated or not with progestins.
[score:3]
The official name and the function of the predicted miR-16 target genes that were assessed by RT-qPCR are shown.
[score:3]
As shown in Figures 5A and 5B, transfection with pre-miR-16 significantly inhibited MPA -induced proliferation in C4HD and T47D cells.
[score:3]
Validated targets of miR-16 include many genes related to the control of cell-cycle progression, such as cyclin D1 [37] and cyclin E [38], among others [39- 41].
[score:3]
Candidate miR-16 target genes assessed by RT-qPCR.
[score:3]
Figure 6 miR-16 is a tumor suppressor in HRG -induced breast cancer growth.
[score:3]
A, miR-16 inhibits in vitro progestin -induced breast cancer growth.
[score:3]
We consider that the wide range of mRNAs and, therefore, proteins, presumably targeted by miR-16 explains the large effects that a relatively modest decrease in its levels has on cell fate.
[score:3]
Inset, levels of pre-miR-16 in pre-miR-CTRL-C4HD and pre-miR16-C4HD tumors were studied by RT-qPCR at day 14; data analysis was performed as described in Figure 2. D, Cyclin E is an in vivo target of miR-16.
[score:3]
To validate cyclin E as a target of miR-16 action in breast cancer, we transiently transfected primary cultures of C4HD cells with pre-miR-16.
[score:3]
miR-16 levels were studied by RT-qPCR, and data analysis was performed as described in Figure 2. The WB in the right side of the figure shows the effects of siRNAs on c-Myc expression in C4HD cells.
[score:3]
In addition, MPA was unable to modulate miR-16 in the T47D-Y cell line, a variant of the parental T47D cell line that lacks PR expression (Figure 2C).
[score:3]
The role of miR-16 as a tumor suppressor in HRG -induced breast cancer growth.
[score:3]
Figure 4 Cyclin E is a target of miR-16 in breast cancer cells.
[score:3]
In order to further elucidate the mechanism of c-Myc induced miR-16 downregulation by MPA, we conducted chromatin immunoprecipitation assays (ChIP) on the DLEU2 promoter.
[score:3]
Thus, rapid PR signaling is conceivably required to activate Stat3, which would then modulate the transcriptional function of PR to repress miR-16 expression.
[score:3]
CCNE1 mRNA contains two highly conserved target sites for miR-16, one at position 485-491 and the other at position 241-247 of its 3' UTR.
[score:3]
A miR-16 -based treatment would have the potential to target multiple genes and pathways, thereby amplifying the antiproliferative response.
[score:3]
Moreover, we found that miR-16 is a suppressor not only of progestin -induced breast cancer growth but also of heregulin (HRG) -induced breast cancer cell proliferation.
[score:3]
Progestin -mediated modulation of miR-16 expression requires an intact PR-signaling function (Figure 2C, PR-B-mPro -transfected T47D-Y cells), the same as Stat3, and also appears to be modulated by PR -mediated transcriptional tethering mechanisms (Figure 2C, C587A-PR -transfected T47D-Y cells).
[score:3]
In the first place, we confirmed that also in BT-474, MPA induced an increase in in vitro cell proliferation at 24 hours of treatment (Figure 6A) and that such increase correlated with a decrease in the expression levels of miR-16 (Figure 6B).
[score:3]
Forced expression of miR-16 in tumor cells proved to be an efficient means to slow down tumor growth.
[score:3]
The authors showed that the miR-16 target protein responsible for the proliferative effect in ovarian cancer was the oncogenic protein Bmi-1 [95].
[score:3]
In addition, c-Myc recruitment to the DLEU2 triggers a chromatin remo deling program which results in a decrease of AcH4 and an increase in H3K9me, which ultimately translate into repression of the DLEU2 locus and miR-16 decrease.
[score:3]
C, miR-16 inhibits in vivo progestin -induced breast cancer growth.
[score:3]
Thus, we reasoned that cyclin E might be a true target of miR-16 in breast cancer cells.
[score:3]
In the absence of progestin stimulation, steady state levels of miR-16 repress the translation of key mRNAs required for cell-cycle progression, such as cyclin D1 and cyclin E mRNAs (left panel).
[score:3]
We performed RT-qPCR to amplify those mRNAs (Figure 4B) and, interestingly, we observed that CCNE1 mRNA, encoding the cell cycle regulator cyclin E, and RAP2C mRNA, encoding a member of the RAS oncogene family [75], showed a profile in response to MPA that mimicked MPA -induced proliferation; these mRNAs were also regulated inversely from miR-16.
[score:3]
Click here for file Candidate miR-16 target genes assessed by RT-qPCR.
[score:3]
miR-16 expression levels were determined by RT-qPCR, and data analysis was performed as described in Figure 2A.
[score:3]
Other authors have already shown that cyclin E is a target of miR-16 [38] in different mo dels.
[score:3]
Noticeably, although not responsive to the endogenous changes of miR-16 levels, a higher basal luciferase activity was observed for the luc-3' mTS construct as compared to luc-3' 1 xTS or CCNE1-3'UTR, adding further evidence for a negative role of miR-16 response sites on cyclin E expression.
[score:2]
These results suggest that miR-16 is regulated as part of the ligand -induced PR effects observed in breast cancer, but would not be involved in PR modulation of breast cancer growth in the absence of the ligand.
[score:2]
Treatment with MPA of luc-3' CCNE1 -transfected C4HD cells resulted in a significant increase of luciferase activity, in line with our hypothesis that miR-16 is a negative regulator of cyclin E (Figure 4G, right panel).
[score:2]
Consistent with the role of PR, Stat3 and c-Myc as upstream regulators of miR-16, the MPA -induced cyclin E increase was blocked by the silencing of PR (Figure 4C), Stat3 (Figure 4D) or c-Myc using siRNAs (Figure 4E).
[score:2]
In addition to identifying a new mechanism of action for progestin in breast cancer, our results suggest that miR-16 may be considered a candidate for targeted breast cancer treatment.
[score:2]
In contrast, pre-miR-16-C4HD tumors stained weakly for cyclin E (Figure 5D, right column and inset, H-index: 61 ± 32), showing miR-16 efficiency in vivo negatively regulated cyclin E. Table 1Tumor growth rates [a].
[score:2]
In addition, we studied miR-16 regulation of cyclin E levels in a system in which miR-16 was not being transfected but modulated endogenously by the presence of MPA.
[score:2]
Our results suggest that miR-16 is a common regulator of cell fate in the mechanisms of steroid hormone or growth factor modulation of breast cancer cell proliferation.
[score:2]
Our present findings demonstrated that at least from six hours (Figure 2C) to 24 hours (data not shown) later, miR-16 levels were not regulated in response to MPA in T47D-Y-PR-BmPro cells.
[score:2]
The full list of primers used to amplify miR-16 candidate target genes is shown in Additional file 2. qPCR was performed with 15 seconds of denaturing at 95°C followed by 40 amplification cycles of annealing and extension at 60°C for one minute.
[score:2]
In contrast, pre-miR-16-C4HD tumors stained weakly for cyclin E (Figure 5D, right column and inset, H-index: 61 ± 32), showing miR-16 efficiency in vivo negatively regulated cyclin E. Table 1Tumor growth rates [a].
[score:2]
We chose to explore the regulation of CCNE1 mRNA by miR-16 due to its acknowledged role in breast cancer [76].
[score:2]
Neither pre-miR-CTRL nor pre-miR-16 modified luciferase activity in the luc-3'EMPTY cells.
[score:1]
miR-16 levels were studied by RT-qPCR, and data analysis was performed as described in Figure 2. The experiment shown was performed with Stat3 siRNA #1, but the same results were obtained with PR siRNA #3. D, C4HD and T47D cells were transfected with Stat3 siRNAs or CTRL siRNAs before MPA stimulation and WBs were performed with anti-c-Myc antibodies.
[score:1]
Cells were co -transfected with pre-miR-16 or pre-miR-CTRL (middle panel) or treated with 10 nM MPA for 24 hours (right panel).
[score:1]
We next conducted a preclinical trial to test the role of miR-16 in the MPA -induced growth of C4HD tumors in vivo.
[score:1]
Bottom panel, as a control of transfection efficiency, miR-16 levels are shown in pre-miR-16-C4HD and pre-miR-CTRL-C4HD cells.
[score:1]
Inset, average H-score, used to quantify the levels of cyclin E in pre-miR-CTRL-C4HD and pre-miR-16-C4HD tumors.
[score:1]
miR-16 levels in pre-miR-16-C4HD were augmented two-fold at day 14, in comparison to pre-miR-CTRL-C4HD tumors (Figure 5C, inset).
[score:1]
A therapeutic strategy is underway that involves the usage of atelocollagen for the delivery of synthetic miR-16 into advanced prostate tumors [84].
[score:1]
As shown in Figure 2C, MPA had no effect on miR-16 levels in T47D-Y-C587A-PR cells.
[score:1]
C4HD cells were transfected with pre-miR-CTRL or pre-miR-16 for 48 hours and then injected subcutaneously (s. c. ) into BALB/c mice at 2 × 10 [6 ]cells/mouse.
[score:1]
In the right panel, as a control for transfection efficiency, miR-16 levels are shown in pre-miR-16- and pre-miR-CTRL -transfected BT-474 cells.
[score:1]
Moreover, a recent study demonstrates that c-Myc induces the recruitment of the histone deacetylase 3 to the DLEU2 locus, causing the decrease of AcH4 and, hence, repression of miR-16 [74].
[score:1]
The mean volume (Figure 5C) and growth rates (Table 1) of the tumors developed from the pre-miR-16-C4HD cells were significantly lower than those of the tumors from the control group.
[score:1]
C4HD cells (2 × 10 [6 ]cells per mouse) were transiently transfected with the precursor of miR-16 (pre-miR-16) or with a control precursor (pre-miR-CTRL) and were then injected s. c. into animals treated with a 40 mg MPA depot in the opposite flank to the cell inoculum.
[score:1]
C4HD cells were transfected with a construct carrying the CCNE1 3' UTR cloned downstream of the firefly luciferase reporter gene (luc-3'CCNE1), middle panel, or with a construct that carried a minimal region of CCNE1 3'UTR which comprised only one of the miR-16 responding sites either wild type (luc-3' 1×TS) or mutated (luc-3' mTS), right panel.
[score:1]
In vivo tumor growthC4HD cells (2 × 10 [6 ]cells per mouse) were transiently transfected with the precursor of miR-16 (pre-miR-16) or with a control precursor (pre-miR-CTRL) and were then injected s. c. into animals treated with a 40 mg MPA depot in the opposite flank to the cell inoculum.
[score:1]
Interestingly, tumors growing in the presence of MPA displayed lower levels of miR-16, which correlated with higher levels of both c-Myc and cyclin E (Figure 5F).
[score:1]
After 48 hours, cells were re -transfected with either pre-miR-16 or pre-miR-CTRL following the protocol described above.
[score:1]
Interestingly, miR-16 was among the miRNAs repressed by c-Myc.
[score:1]
Using experimental mo dels, these authors showed that the restoration of miR-16 in prostate cancer cells results in growth arrest, apoptosis and in a marked regression of prostate tumor xenografts [37].
[score:1]
Briefly, 6 nM pre-miR-16 or a pre-miR-control (pre-miR-CTRL) that does not form any known mammalian miRNA, were transfected using the transfection reagent siPORT NeoFx (Ambion).
[score:1]
For this purpose, C4HD cells were transfected with pre-miR-CTRL (pre-miR-CTRL-C4HD) or pre-miR-16 (pre-miR-16-C4HD) cells and 2 × 10 [6 ]cells were injected subcutaneously (s. c. ) into mice treated with MPA.
[score:1]
A role for miR-16 has also been shown in ovarian cancer.
[score:1]
miR-16 and U6 snRNA qPCR.
[score:1]
B, C4HD cells were transfected with pre-miR-CTRL or pre-miR-16.
[score:1]
We did not find canonical or half PREs at the proximal promoter of DLEU, the miR-16 host gene.
[score:1]
It has been demonstrated that miR-16 is located in a chromosomal region commonly deleted in leukemia and that its deletion correlates with an increase in anti-apoptotic and cell-cycle-promoting proteins [83].
[score:1]
Nevertheless, little is known about the role of miR-16 in solid malignancies.
[score:1]
Progestin induced a decrease in miR-16 levels via the classical PR and through a hierarchical interplay between Stat3 and the oncogenic transcription factor c-Myc.
[score:1]
RNA from C4HD cells treated for 0 to 24 hours was reverse transcribed and analyzed by RT-qPCR to detect the presence of miR-16.
[score:1]
The volume, percentage of growth inhibition, and delay in tumor growth (days) in tumors from mice injected with pre-miR16-C4HD cells relative to mice injected with pre-miR-CTRL-C4HD cells were calculated at day 28, as described in.
[score:1]
TreatmentMean tumor volume(mm [3])Growth rate(mm [3]/day)Growth inhibition(%)Delay in tumor growth(days) pre-miR-CTRL-C4HD 683.6 ± 192.2* 26.1* pre-miR-16-C4HD231.1 ± 107.9 [#]9.6 [#]66.2 [b]5 [b] [a]Growth rates were calculated as the slopes of growth curves.
[score:1]
However, our study is the first to show the relevance of miR-16 modulation in breast cancer mo dels throughout a stimulus that is relevant to breast cancer pathophysiology.
[score:1]
Moreover, we found an inverse relationship between the levels of miR-16 and the proliferative state of C4HD and T47D cells.
[score:1]
After one week, tumors were excised and studied for miR-16, c-Myc and cyclin E levels.
[score:1]
In line with a role for c-Myc as a repressor of miR-16, the addition of MPA caused a significant decrease of the levels of acetylation of histone H4 (AcH4), a chromatin modification already reported to be an activation mark for the DLEU2 locus [74] (Figure 3E, middle panel).
[score:1]
Our findings support the notion that Stat3 integrates the rapid and transcriptional effects of PR, leading to a decrease in miR-16 levels.
[score:1]
Other authors demonstrated that transfection of tamoxifen-sensitive MCF-7 cells with a clinically important oncogenic isoform of ErbB-2, HER2Δ16, caused a decrease in miR-16 levels and a concomitant increase in Bcl-2 that rendered cells resistant to the treatment with tamoxifen [41].
[score:1]
C4HD or T47D cells were transfected with pre-miR-CTRL or pre-miR-16.
[score:1]
Here, we have also demonstrated the role of miR-16 in progestin -induced breast cancer cell proliferation.
[score:1]
The experiment shown was performed with c-Myc siRNA #5, but the same results were obtained with c-Myc siRNA #6. F, C4HD cells were transfected with pre-miR-16 or pre-miR-CTRL before MPA stimulation and WB was performed as in C. G, A scheme depicting the different constructions used is shown in the left panel.
[score:1]
A, Upper panel, C4HD cells were transfected with pre-miR-16 or pre-miR-control (CTRL) before MPA stimulation.
[score:1]
This decrease in miR-16 levels, from at least 16 to 24 hours after treatment, correlated inversely with the proliferative effects of HRG at this time point (Figure 6E, left panel).
[score:1]
Additional constructs carrying the wild-type CCNE1 3' UTR, or a minimal region from the CCNE1 3'-UTR which has a response site for miR-16 (luc-3' 1×TS), or the mutated response site for miR-16 (luc-3' mTS) were kindly provided by Dr.
[score:1]
In addition to the constructs described above, we used a construct in which only a minimal region of the CCNE1 3' UTR encompassing a miR-16 responding site was included (luc-3' 1×TS) and another in which the same site was mutated (luc-3' mTS, Figure 4G, left panel) [62].
[score:1]
miR-16 belongs to the miR-15/miR-16 cluster that is located on the noncoding gene deleted in leukemia 2 (DLEU2) [36].
[score:1]
Recently, a few papers suggested a role for miR-16 in breast cancer, although none of them studied its modulation by steroid hormones.
[score:1]
This result highlights the importance of miR-16 in progestin-promoted human breast cancer growth in vivo.
[score:1]
In this sense, comprehensive characterization of the genes modulated by MPA through miRNAs would be necessary to completely elucidate the mechanism responsible for miR-16 -mediated tumor suppression.
[score:1]
In this study, we also showed evidence that HRG modulates miR-16 in the context of HRG -induced breast cancer cell proliferation.
[score:1]
miR-16 levels were studied by RT-qPCR, and data analysis was performed as described in Figure 2. The experiment shown was performed with Stat3 siRNA #3 and c-Myc siRNA #5, but the same results were obtained with Stat3 siRNA #1 and c-Myc siRNA #6. Experiments shown in A to G were repeated in triplicate with similar results.
[score:1]
[1 to 20 of 162 sentences]
|
2 |
![]()
Other miRNAs from this paper: hsa-mir-16-2, hsa-mir-138-2, hsa-mir-138-1, hsa-mir-186, hsa-mir-375, hsa-mir-506
Additionally, YAP1 overexpression significantly antagonized the inhibitory effects of miR-16 up-regulation on CCA invasion while YAP1 down-regulation obviously reversed miR-16 knockdown -induced invasion potential of CCA cells (Figure 8).
[score:12]
As expected, the inhibitory effect of miR-16 up-regulation on CCA cell growth and invasion was significantly rescued by the YAP1 -overexpressing plasmid, although the recovery was not 100% efficient compared with control cells, while the promoting role of miR-16 down-regulation on CCA cells was almost completely abolished by YAP1 knockdown.
[score:11]
In addition, miR-16 overexpression dramatically suppressed CCA cell proliferation, growth and migration through inhibiting YAP1 expression.
[score:9]
miR-16, as a novel tumor suppressor in CCA through directly targeting YAP1, might be a promising therapeutic target or prognosis biomarker for CCA.
[score:8]
Result showed that YAP1 expression was markedly decreased by overexpressing of miR-16 and significantly increased by down-regulation of miR-16 (Figure 5D and 5E).
[score:8]
revealed that upregulation of miR-16 significantly inhibited the invasion capacity and silencing miR-16 expression notably increased the invasion abilities in both HUCCT-1 and QBC-939 cells (Figure 4).
[score:8]
Interestingly, YAP1 overexpression dramatically rescued the suppressing effects of miR-16 up-regulation on CCA cell proliferation.
[score:8]
In conclusion, we for the first time discovered that that miR-16, as a tumor suppressor in CCA via targeting YAP1, may serve as a promising therapeutic target for CCA.
[score:7]
It can be seen that patients with low expression of miR-16 exhibited a worse disease-free survival (DFS) than those with high expression of miR-16 (Figure 11A).
[score:7]
In the present study, we verified the significant downregulation of miR-16 and upregulation of YAP1 in CCA cell lines and tissues.
[score:7]
In summary, we infer that YAP1 is involved in miR-16 -mediated CCA cell growth and metastasis and up-regulation of YAP1 may due to the down-regulation of miR-16 in CCA.
[score:7]
These findings demonstrated that YAP1 is a target gene of miR-16 in CCA cells, indicating that miR-16 negatively regulates YAP1 expression in CCA cells via directly binding to the 3′-UTR of its mRNA.
[score:7]
The candidate targets of miR-16 were predicted in multiple databases including miRbase, Targetscan, Pictar and miRNA target.
[score:7]
Overexpression of miR-16 remarkably suppressed CCA cell proliferation, while knockdown of miR-16 significantly enhanced CCA cell proliferation as determined by the CCK-8 (Figure 2B and 2C) and colony formation (Figure 3A and 3B).
[score:6]
Collectively, these results suggested that miR-16 expression is down-regulated in human CCA tissues and cell lines.
[score:6]
Analogously, miR-16 expression level was also down-regulated in 4 wi dely used CCA cell lines (HUCCT1, QBC939, RBE, 9810) relative to normal biliary epithelial cell line (HIBEC) (Figure 1C).
[score:6]
Therefore, our results demonstrated a direct interaction between miR-16 and YAP1 and their critical role in CCA, which demonstrated that the targeting and inhibition of YAP1 by miR-16 may be a feasible therapeutic treatment for CCA.
[score:6]
Statistical results showed that miR-16 expression was remarkably associated with tumor size (P=0.004), metastasis (P=0.002), and AJCC TNM stage (P < 0.001) in CCA patients, suggesting that down-regulation of miR-16 may contribute to the malignant progression of CCA (Table 1).
[score:6]
Figure 2MiR-16 suppresses CCA cell proliferation in vitro by CCK8 assay (A) Real-time RT-PCR was conducted to examine the expression levels of miR-16 in CCA cells transfected with miR-16 mimic or inhibitor, respectively.
[score:6]
Moreover, CCA tissues with large tumor size, metastasis, or advanced TNM stage showed a significant down-regulation of miR-16 expression, which suggested that miR-16 might be involved in CCA carcinogenesis.
[score:6]
Figure 4MiR-16 inhibits CCA cell invasion in vitro Transwell assay was conducted to assess the effect of miR-16 overexpression or knockdown on CCA cell invasion capacity.
[score:5]
A volume of 0.1 mL of suspended QBC939 cells, miR-16 inhibited and overexpressed QBC939 cells were injected into the tail veins.
[score:5]
Second, pathological data demonstrated that YAP1 expression was inversely correlated with miR-16 expression in clinical CCA samples.
[score:5]
45 CCA samples were divided into miR-16 high expression group (n=35) and low expression group (n=35), while median was used as cut off.
[score:5]
He et al. found that miR-16 suppressed carcinogenesis and progression of nasopharyngeal carcinoma via targeting fibroblast growth factor 2(FGF2), inactivating the PI3K/AKT and MAPK signaling pathways [22].
[score:5]
Moreover, Chatterjee also demonstrated that overexpression of miR-16 could sensitize paclitaxel resistant lung cancer cells to paclitaxel by inducing apoptosis via inhibiting anti-apoptotic protein Bcl-2 [13].
[score:5]
We further identified YAP1 as a direct target gene of miR-16 and found that miR-16 could regulate CCA cell growth and invasion in a YAP1 -dependent manner.
[score:5]
To clarify the molecular mechanism underlying miR-16 induced CCA proliferation and metastasis, we used bioinformatics analysis to predict the potential targets of miR-16 and YAP1 was indicated as a theoretical miR-16 target.
[score:5]
Moreover, we found that ectopic expression of miR-16 was markedly capable of preventing proliferation and invasion in CCA cells both in vitro and in vivo, while knockdown of miR-16 enhanced CCA cell growth and invasion, which suggested that miR-16 played a crucial role in cellular homeostasis that contributes to the development of CCA.
[score:5]
Figure 9 (A) Nude mice were subcutaneously transplanted with cells stably expressed with miR-16 mimics/inhibitor or control (n=5).
[score:5]
In turn, collectively data support that YAP1 acts as a direct down-stream target of miR-16 in regulating CCA cell growth and invasion.
[score:5]
For example, Ke et al. showed that miR-16 could inhibit growth and motility in non-small cell lung cancer cells by targeting hepatoma-derived growth factor (HDGF) [21].
[score:5]
Protein expression of YAP1 was detected in cells treated with either miR-16 mimics or inhibitor.
[score:5]
Therefore, we speculated that miR-16 was capable of suppressing CCA cell proliferation and invasion by enhancing YAP1 expression.
[score:5]
MiR-16 overexpression in QBC939 cells resulted in observable decrease of the number of mice with lung metastasisand fewer metastatic nodules in the pulmonary tissues of each mouse, compared with their control group whereas miR-16 down-regulation led to the promotion results (Figure 10).
[score:5]
However, the promotion of tumor growth could be abolished by either co -treated cells with miR-16 mimics and YAP1 overexpression lentivirus or co -treated with miR-16 inhibitor and YAP1 shRNA lentivirus, indicating the function induced by miR-16 might be in a YAP1- dependent behavior.
[score:5]
Given that YAP1 is an oncogene in many cancers, we conclude that miR-16 inhibits the growth and invasion of CCA cells at least partially by targeting YAP1.
[score:5]
All these CCA samples were divided into miR-16 high expression group (n=22) and low expression group (n=23), median was used as cut-off value.
[score:5]
In the present study, we revealed that miR-16 expression was significantly down-regulated in CCA tissues compared with the corresponding non-CCA tissues.
[score:5]
MiR-16 inhibits CCA cell proliferation and invasion in vitroTo reveal the role of miR-16 in CCA, miR-16 level in HUCCT-1 and QBC939 cells transfected with miR-16 mimic or inhibitor, was examined using qRT-PCR.
[score:5]
To further assess the mechanism of miR-16 -induced CCA cell growth and invasion suppression, bioinformatic analysis was performed to identify the potential down-stream target of miR-16.
[score:5]
Compared with the control group, miR-16 overexpressed mice resulted in a significant reduce of tumor weight and tumor volume while miR-16 inhibited mice presented tumors with increased weight and size (Figure 9).
[score:4]
Down-regulation of miR-16 is remarkably associated with tumor progression and poor survival in CCA patients.
[score:4]
To confirm our speculation, we assessed the colony formation and transwell assay when miR-16 -overexpressing cells were further transfected with YAP1 -overexpressing lentivirus.
[score:4]
In addition, YAP1 was markedly upregulated in CCA tissues, which was reversely correlated with miR-16 level in tissue samples.
[score:4]
Taken together, these results implied that down-regulation of miR-16 can predict poor survival of CCA.
[score:4]
YAP1 is a direct target of miR-16 in CCA cells.
[score:4]
Many studies have shown that miR-16 is down-regulated in many cancers.
[score:4]
YAP1 is a down-stream target and negatively regulated by miR-16 in CCA cells.
[score:4]
As showed in Figure 2A, cells treated with miR-16 mimic showed a significant increase in the miR-16 level, while transfection of miR-16 inhibitor notably inhibited the miR-16 level, compared to the negative control group.
[score:4]
The results showed that overexpressing of miR-16 promoted HUCCT-1 cell apoptosis from 6.81% to 12.11%, and knockdown of miR-16 decreased cell apoptosis from 9.64% to 3.41% (Supplementary Figure 1A and 1B).
[score:4]
Besides, Down-regulation of miR-16 was remarkably associated with tumor progression and poor survival in CCA patients through a Kaplan–Meier survival analysis.
[score:4]
Down-regulation of miR-16 is associated with CCA poor prognosis.
[score:4]
Furthermore, we explored the potential mechanism of miR-16 and found that YAP1 was a direct target of miR-16 in CCA.
[score:4]
On the contrary, RNAi against YAP1 almost completely abolished the promoting role of miR-16 down-regulation on CCA cell proliferation (Figure 7).
[score:4]
Thus, our findings enriched the tumor suppressive role of miR-16 in CCA.
[score:3]
Further, in vitro and in vivo experiments demonstrated that miR-16 could inhibit CCA cell proliferation, colony formation ability and decreased cell invasion.
[score:3]
MiR-16 is significantly down-regulated in CCA tissues and cell lines.
[score:3]
MiR-16 is pronouncedly down-regulated in human CCA tissues and cell lines.
[score:3]
The clinicopathological relevance analysis of miR-16 expression in cholangiocarcinoma patients.
[score:3]
Finally, we observed an obvious up-regulation of YAP1 in CCA tissues compared to their matched non-CCA tissues, as well as a negative correlation between YAP1 and miR-16 levels in the examined CCA tissues.
[score:3]
These observations provided evidence that miR-16 is a potent inhibitor of CCA metastasis.
[score:3]
Transwell assay was conducted to assess the effect of miR-16 overexpression or knockdown on CCA cell invasion capacity.
[score:3]
As is known to all, the tumor suppressor miR-16 is observably decreased and its function has been studied all the time in different cancers, including lung cancer, osteosarcoma, breast cancer, glioma, laryngeal carcinoma and so on [13– 15].
[score:3]
Moreover, YAP1, as a candidate human oncogene in multiple tumors, was identified as a down-stream target gene of miR-16 for the first time.
[score:3]
MiR-16 was notably downregulated in CCA tissues, which was associated with tumor size, metastasis, and TNM stage.
[score:3]
To reveal the role of miR-16 in CCA, miR-16 level in HUCCT-1 and QBC939 cells transfected with miR-16 mimic or inhibitor, was examined using qRT-PCR.
[score:3]
Both in vitro and in vivo studies demonstrated that miR-16 could suppress proliferation, invasion and metastasis throughout the progression of CCA.
[score:3]
Likewise, a statistically significant association between low miR-16 expression and short overall survival (OS) was also demonstrated in CCA patients (Figure 11B).
[score:3]
Figure 8Transwell assay was conducted to assess the effect of miR-16 overexpression or knockdown on CCA cell invasion capacity.
[score:3]
In the present study, we found that the miR-16 expression was remarkably decreased in CCA tissues and cell lines, and loss of miR-16 was tightly associated with the advanced malignancy of CCA that was involved in the progression of CCA.
[score:3]
First, western blot analysis showed that miR-16 decreased expression levels of YAP1.
[score:3]
Moreover, the effect of miR-16 on YAP1 expression was examined in CCA cells.
[score:3]
In addition, to analyze the prognostic significance of miR-16 expression, Kaplan–Meier survival curve was carried out in a set of 45 CCA patients with integral follow-up data.
[score:3]
Finally, YAP1 expression markedly antagonized the function of miR-16 on CCA cell proliferation and invasion.
[score:3]
As indicated in Figure 1B, miR-16 was pronouncedly downregulated in 45 CCA tissues when compared to their corresponding non-CCA tissues.
[score:3]
Cell apoptosis was detected upon miR-16 gain- and loss -expression using flow cytometry.
[score:3]
Briefly, after 48 h of transfection with miR-16 mimics or inhibitors, the cells were harvested, washed twice with phosphate-buffered saline (PBS), resuspended in 100 μl Annexin -binding buffer and subsequently incubated with 5 μl Annexin V-FITC and 3 μl PI (50 μg/ml) for 30 min in the dark at room temperature.
[score:3]
QBC939-miR-16 mimic, QBC939-miR-16 inhibitor, and their control cells were injected into nude mice via the tail vein respectively.
[score:3]
MiR-16 mimic, inhibitor and respectively corresponding negative control were purchased from Gene Pharma (Shanghai, China).
[score:2]
MiR-16 inhibits CCA cell proliferation and invasion in vitro.
[score:2]
MiR-16 inhibits CCA metastasis in vivo through the YAP1 -dependent manner.
[score:2]
Mir-16 inhibits tumor growth through the YAP1 -dependent manner.
[score:2]
Thus, our data indicated that miR-16 regulates CCA cell growth and invasion in a YAP1 -dependent manner.
[score:2]
In cutaneous T-cell and other non-Hodgkin lymphomas, miR-16 was suggested to mediate the regulation of a senescence-apoptosis switch and induce cellular senescence [23].
[score:2]
Third, the luciferase reporter assay with 3′UTR revealed miR-16 repressed YAP1 expression via interaction with YAP1-3′UTR elements.
[score:2]
Mir-16 inhibits cell proliferation through the YAP1 -dependent manner.
[score:2]
Besides, decreased expression of miR-16 was also found across a panel of CCA cells compared to normal bile duct epithelial cell.
[score:2]
MiR-16 has been reported to play a suppressive role in different human cancers.
[score:2]
MiR-16 inhibits CCA cell invasion in vitro.
[score:2]
Mir-16 inhibits cell invasion through the YAP1 -dependent manner.
[score:2]
Figure 5 (A) The sequence alignment of human miR-16 with 3′ UTR of YAP1.
[score:1]
Figure 6 Cells were co -transfected with miR-16 mimics or Control, Renilla luciferase vector pGL3-SV40 and YAP1 3′UTR luciferase reporters for 48h.
[score:1]
MiR-16 regulates CCA cell growth and metastasis in a YAP1- dependent manner.
[score:1]
We also validated the gain-and-loss function of miR-16 in tumor metastasis.
[score:1]
Based on the above data, we speculated that YAP1 might be involved in miR-16 -mediated CCA cell growth and invasion.
[score:1]
However, to this end, we have poor understanding of the detailed role of miR-16 in cholangiocarcinoma.
[score:1]
However, whether and how miR-16 is involved in CCA progression is still unknown.
[score:1]
MiR-16 suppresses CCA cell proliferation in vitro by CCK8 assay.
[score:1]
Cells were co -transfected with miR-16 mimics or Control, Renilla luciferase vector pGL3-SV40 and YAP1 3′UTR luciferase reporters for 48h.
[score:1]
Further Pearson analysis revealed that YAP1 was reversely correlated with the miR-16 level in CCA tissues (Figure 5C).
[score:1]
To further confirm the expression significance of miR-16 in CCA, we evaluated the correlation between clinicopathological characteristics of these CCA patients and miR-16 expression.
[score:1]
The binding sites for miR-16 in the 3′UTR of human YAP1 was inserted into the pMIR-REPORT vector.
[score:1]
MiR-16 suppresses CCA cell proliferation in vitro by colony formation assay.
[score:1]
It can be seen that the luciferase activity was significantly decreased in CCA cells co -transfected with miR-16 mimic and wild type of YAP1 3′UTR.
[score:1]
Quantitative real-time PCR (qRT-PCR) was developed to measure miR-16 expression in CCA tissues and cell lines.
[score:1]
[1 to 20 of 106 sentences]
|
3 |
![]()
Indeed, NF-κB and MAPK inhibitors had no effects on LPS-stimulated upregulation of pri-miR-16-1. In contrast, MAPK inhibitors, but not an NF-κB inhibitor, attenuated LPS-stimulated upregulation of pri-miR-16-2. In a previous report by Shin et al., upregulation of miR-16 was demonstrated to be dependent on the activation of NF-κB signaling in gastric cells following nicotine treatment [36].
[score:16]
Although miR-16 may have additional targets that could influence LPS -mediated gene expression, our data suggest that miR-16 modulates LPS -induced expression of these genes by targeting SMRT, as SMRT overexpression attenuated the effects of the miR-16 precursor on IL-6, IL-8, and IL-1α expression.
[score:13]
Coupled with miR-16 -mediated translational suppression of SMRT mRNA, our data suggest that miR-16 represses SMRT expression through translational suppression, not RNA degradation.
[score:11]
Using a luciferase construct containing the sequence in the SMRT 3′UTR predicted to bind to miR-16, we observed translational suppression of SMRT, indicating that miR-16 binding translationally suppresses SMRT.
[score:9]
Treatment of cells with a specific IKK2 inhibitor, SC-514, inhibits p65 -associated transcriptional activation of the NF-κB pathway (Fig. S1) [30], but had no inhibitory effect on the expression of pri-miR-16-1 and pri-miR-16-2 (Fig. 1D).
[score:9]
Overexpression of miR-16 promotes NF-κB transcriptional activation induced by LPS through suppression of SMRT, resulting in enhanced production of inflammatory cytokines and chemokines, such as IL-8. These data suggest that miR-16 targets SMRT to modulate TLR/NF-κB -mediated transcription of inflammatory genes, a process that may be involved in the regulation of inflammatory responses during microbial infection of innate immune cells.
[score:8]
The above data suggest that miR-16 upregulation is required for LPS -induced downregulation of SMRT protein in H69 and U937 cells.
[score:7]
To clarify whether TLR4 is required for LPS -induced pri-miR-16 expression, we tested the expression of pri-miR-16-1 and pri-miR-16-2 in H69 cells stably expressing the dominant negative (DN) functionally defective mutant of TLR4 [23].
[score:7]
From a physiological viewpoint, LPS -induced downregulation of SMRT through MAPK -dependent upregulation of miR-16 and its subsequent effects on NF-κB -mediated transcriptional activity may serve as one component in the network responsible for fine-tuning inflammatory responses in innate immune cells.
[score:7]
miR-16 targets the SMRT 3′UTR, resulting in translational suppression of SMRT.
[score:7]
To test the impact of miR-16 levels on LPS-regulated expression of inflammatory cytokines and chemokines in H69 cells, we overexpressed miR-16 in H69 cells by transfection of the cells with the miR-16 precursor, and measured the expression of selected cytokines and chemokines following LPS stimulation.
[score:6]
We then assessed SMRT expression in H69 and U937 cells following LPS stimulation and its correlation to LPS -induced upregulation of miR-16.
[score:6]
LPS stimulation of U937 and H69 cells decreases SMRT expression through upregulation of miR-16.
[score:6]
To clarify whether miR-16 -mediated SMRT translational repression is involved in downregulating SMRT in cells following LPS stimulation, we transfected H69 and U937 cells with anti-miR-16 for 48 h and then exposed the cells to LPS for 24 h, followed by Western blot using an antibody to SMRT.
[score:6]
LPS stimulation decreases SMRT expression by upregulating miR-16.
[score:6]
The data we report here demonstrate that LPS stimulation decreased cellular expression of SMRT by upregulating miR-16 in a MAPK -dependent manner.
[score:6]
Our results are consistent with a recent report by Li et al, showing that miR-16 is downregulated during human monocyte-macrophage differentiation, and a decrease in miR-16 prevents macrophage hyperactivation, repressing the activation of NF-κB target genes [28].
[score:6]
In contrast, Li et al. recently reported that miR-16 is downregulated during human monocyte-macrophage differentiation, and a decrease in miR-16 levels prevents macrophage hyperactivation by acting to repress the activation of NF-κB target genes [28].
[score:6]
To test whether miRNA -mediated translational repression of SMRT is directly relevant to SMRT protein expression, we treated H69 and U937 cells with anti-miR-16 or miR-16 precursor for 48 h and then measured SMRT protein expression by Western blot.
[score:6]
miR-16 targets SMRT 3′UTR and causes translational repression.
[score:5]
The miR-16 precursor had no effect on luciferase activity in cells transfected with the mutant SMRT 3′UTR construct in H69 cells, suggesting that miR-16 may suppress translation of SMRT mRNA by binding to the 3′UTR region of SMRT.
[score:5]
Of these upregulated miRNAs, miR-16 is predicted to be a critical regulator of TLR -mediated inflammatory responses.
[score:5]
SMRT is a target for miR-16, and LPS stimulation decreases expression of SMRT via induction of miR-16.
[score:5]
To further test whether miR-16 can bind to the 3′UTR of SMRT and result in translational suppression of SMRT, we generated a pMIR-REPORT luciferase construct containing the SMRT 3′UTR with the putative miR-16 binding site (Fig. S5).
[score:5]
In contrast, transfection of H69 cells with anti-miR-16 to inhibit miR-16 function attenuated LPS -induced upregulation of IL-8, IL-1α, and IL-6 mRNAs, compared to cells transfected with the non-specific control anti-miR (Fig. 2D).
[score:5]
Given the correlation of the dynamic kinetics between the mature and primary transcript forms of miR-16, transactivation of the miR-16 genes may account for the upregulation of miR-16 in cells following LPS stimulation.
[score:4]
Anti-miR-16 significantly attenuated the downregulation of LPS -induced SMRT protein in H69 and U937 cells (Fig. 6D).
[score:4]
Anti-miR-16 significantly attenuated LPS -induced downregulation of SMRT in the cells.
[score:4]
Induction of miR-16 showed no effects on the mRNA stability of selected inflammatory cytokines and chemokines, but promoted NF-κB-regulated transactivation of the IL-8 gene through suppression of SMRT.
[score:4]
We also detected the upregulation of both pri-miR-16-1 and pri-miR-16-2, primary transcripts of mature miR-16 from two miR-16 genes, mir-15a-16-1 and mir-15b-16-2, respectively [24], [26], [35].
[score:4]
Together, these data suggest that miR-16 targets SMRT to modulate NF-κB-regulated inflammatory responses in human monocytes and biliary epithelial cells.
[score:4]
Consistent with previous results [24], we detected upregulation of mature miR-16 in human monocytes and epithelial cells following LPS treatment.
[score:4]
In this study, we did not detect a significant impact of miR-16 upregulation on the RNA stability of these mRNAs (IL-6 and IL-8) in human H69 epithelial cells and U937 cells (data not shown) in response to LPS stimulation.
[score:4]
miR-16 regulates LPS-stimulated expression of IL-8, IL-6, and IL-1α.
[score:4]
To further elucidate the mechanisms underlying the promotion of NF-κB-regulated transcriptional activation in response to LPS by miR-16, we used Targetscan 5.1 (www.
[score:4]
Increased expression of mature miR-16 following LPS stimulation was further confirmed by in both cell lines (Fig. 1B).
[score:3]
Taken together, these data demonstrate that miR-16 promotes LPS -induced expression of IL-8, IL-1α, and IL-6 at the mRNA and protein levels in H69 and U937 cells.
[score:3]
Notably, overexpression of SMRT attenuated the effects of the miR-16 precursor on LPS -induced NF-κB transcriptional activation (Fig. 7C).
[score:3]
In the current study, we assessed the kinetics of miR-16 expression in both its mature and primary transcript forms, in H69 and U937 cells following LPS stimulation using real-time PCR.
[score:3]
To test whether SMRT is regulated by miR-16, H69 cells were transfected with a specific siRNA to knockdown Drosha, which is required for miRNA maturation [32].
[score:3]
In this study, we investigated the expression of miR-16 in human monocytes and biliary epithelial cells in response to LPS stimulation, and the potential role of miR-16 in controlling LPS-stimulated expression of inflammatory genes.
[score:3]
Because mature miR-16 is encoded by two separate genes located on chromosomes 13 and 3, which are transcribed to produce pri-miR-16-1 and pri-miR-16-2, respectively (Fig. 1C), we analyzed the kinetics of altered pri-miR-16-1 and pri-miR-16-2 expression in H69 and U937 cells following LPS stimulation.
[score:3]
Because induction of miR-16 and subsequent suppression of SMRT happen at later time points following primary stimulation, such a mechanism may be responsible for resetting chromatin for subsequent rounds of transcription, relevant to cellular inflammatory responses in general.
[score:3]
0030772.g001 Figure 1. (A) Alterations in mature miRNA-16 expression in H69 and U937 cells after exposure to LPS for various periods of time as assessed by real-time PCR.
[score:3]
Data are expressed as the amount of mature miR-16 in LPS-stimulated samples relative to the control non-stimulated samples.
[score:3]
Complementary 40-mer DNA oligonucleotides containing the putative miR-16 target site within the 3′UTR of human SMRT were synthesized with flanking SpeI and HindIII restriction enzyme digestion sites (Table S1).
[score:3]
Indeed, miR-16 induces rapid degradation of RNAs, which contain AU-rich elements (AREs) in their 3′-untranslated regions (3′UTRs) in HeLa cells [26].
[score:3]
The expression of mature miR-16 did not significantly increase at early time points after LPS exposure in either cell line.
[score:3]
Expression of pri-miR-16-1 and pri-miR-16-2 was increased at 4 h after LPS challenge and declined to basal levels by 12 h after LPS stimulation (Fig. 1C).
[score:3]
Transfection of H69 cells with the miR-16 precursor also significantly increased LPS-stimulated expression of IL-8, IL-1α, and IL-6 at the mRNA levels in a dose -dependent manner (Fig. 2B).
[score:3]
No significant increase of pri-miR-16-1 and pri-miR-16-2 was detected in cells expressing TLR4-DN following LPS stimulation (Fig. S2).
[score:3]
In this study, we demonstrated that LPS stimulation increases miR-16 expression in human U937 monocytes and H69 epithelial cells partially through MAPK -mediated transcription of the mir-15b-16-2 gene.
[score:3]
Of these specific miRNAs expressed in H69 cells, miR-16 increased following LPS stimulation for 8 h [24].
[score:3]
Functional manipulation of miR-16 impacts LPS-stimulated expression of IL-6, IL-8, and IL-1α.
[score:3]
org) [31] to identify predicted miR-16 targets, focusing on known co-repressors of NF-κB signaling.
[score:3]
Figure S2 LPS stimulation does not increase expression of pri-miR-16-1 and pri-miR-16-2 in TLR4-DN H69 cells.
[score:3]
In contrast, transfection with the miR-16 precursor significantly decreased luciferase reporter translation (Fig. 5C).
[score:3]
MAPK -mediated expression of SMRT through modulation of miR-16 and its subsequent effects on NF-κB -mediated transcriptional activity may provide a new area of exploration for fine-tuning TLR/NF-κB -mediated host reactions in response to microbial challenge.
[score:3]
The expression of pri-miR-16-1 and pri-miR-16-2 was measured by real-time PCR in H69 cells stably expressing TLR4-DN following LPS stimulation (1 µg/ml) for 4 h. Data shown are averages of three independent experiments.
[score:3]
In contrast, cells treated with LPS in the presence of a mix of MAPK inhibitors (50 µM of PD98059, 10 µM of SB203580, and 20 µM of SP600125) showed a significant decrease in pri-miR-16-2, but not pri-miR-16-1, in both cell lines (Fig. 1E).
[score:3]
Binding of miR-16 to the AREs of these mRNAs promotes ARE -mediated RNA degradation, resulting in destabilization of the targeted mRNAs [26].
[score:3]
Instead, we identified SMRT as a target for miR-16.
[score:3]
To test whether miR-16 -mediated SMRT translational repression can abolish SMRT -induced repression of NF-κB activity after LPS treatment, H69 cells were co -transfected with the NF-κB -driven IL-8 luciferase reporter construct with or without the miR-16 precursor for 24 h followed by exposure to LPS for 6 h. H69 cells transfected with the miR-16 precursor had increased LPS-stimulated NF-κB transcriptional activity.
[score:3]
miR-16 -mediated degradation of mRNAs requires the miRNA processing components, Dicer, Ago/eiF2C family members, and the ARE binding protein, tristetraprolin, and involves interactions between the sequence UAAUAUU of miR-16 and AREs within the 3′UTRs of targeted mRNAs [26].
[score:3]
Together, the above data suggest that miR-16 enhances NF-κB-regulated transcriptional activation and promotes production of IL-8, IL-6, and IL-1α in H69 and U937 cells in response to LPS stimulation.
[score:2]
miR-16 enhances NF-κB-regulated transcriptional activity induced by LPS in H69 cells.
[score:2]
Together, these data suggest that miR-16 regulates LPS-stimulated NF-κB transcriptional activation through repression of SMRT.
[score:2]
In addition, a pMIR-REPORT luciferase construct containing the SMRT 3′UTR with a mutation at the putative miR-16 binding site (CTG to GAC) was generated as the control construct (Fig. S5).
[score:2]
Complementarily, knockdown of miR-16 using anti-miR-16 caused a decrease in the associated luciferase activity (Fig. 4B).
[score:2]
Increased mature miR-16 expression was initially detected in cells after exposure to LPS for 8 h (2.0-fold increase), which lasted up to 24 h (4.5-fold increase) as compared to non-LPS treated control cells (Fig. 1A).
[score:2]
mRNA levels of IL-8, IL-6, and IL-1α were measured by real-time PCR in cells transfected with the pre-control or miR-16 precursor for 48 h, followed by exposure to LPS for 6 h. (D) Effects of anti-miR-16 on LPS -induced upregulation of mRNAs for IL-8, IL-6, and IL-1α in H69 cells.
[score:2]
As an additional control, a pMIR-REPORT Luciferase construct was generated containing SMRT 3′UTR with two mutations (both CTG to GAC) in the putative seed regions for miR-16.
[score:2]
The annealed oligonucleotides were ligated into the SpeI- HindIII sites of the pMIR-REPORT Luciferase vector (Ambion) for studies examining the potential post-transcriptional luciferase regulation by miR-16 interaction with the SMRT 3′UTR, as we previously reported [22], [23].
[score:2]
The SMRT 3′UTR sequence encoding the potential miR-16 binding site was inserted into the pMIR-REPORT luciferase plasmid.
[score:1]
0030772.g005 Figure 5(A) Binding of SMRT 3′UTR by miR-16 as assessed by a modified RT-PCR approach.
[score:1]
The level of mature miR-16 was obtained by normalizing the reactions to the level of snRNA RNU6B.
[score:1]
As shown in Fig. 3A, the miR-16 precursor had no influence on the mRNA stability of IL-8, IL-1α, and IL-6 after treatment with LPS.
[score:1]
Cells were transfected with each reporter construct, as well as anti-miR-16 or miR-16 precursor (Ambion), followed by assessment of luciferase activity 24 h after transfection.
[score:1]
In addition, anti-miR-16 markedly increased SMRT 3′UTR -associated luciferase activity, but did not impact luciferase activity in H69 cells transfected with the mutant SMRT 3′UTR construct (Fig. 5C).
[score:1]
Figure S5 The schematic of SMRT mRNA indicates a potential binding site for miR-16 in the 3′UTR.
[score:1]
To address whether miR-16 can directly bind to SMRT 3′UTR, we took a PCR -based approach as previously reported [29], using the miR-16 oligonucleotide as a primer in a reverse transcription reaction to examine whether it would prime the SMRT mRNA harvested from H69 cells.
[score:1]
Using HeLa cells, previous studies reported that miR-16 induced degradation of several mRNAs by binding to the AREs of 3′UTRs of the mRNAs [26].
[score:1]
H69 and U937 cells were transfected 0–30 nM of the precursors of miR-16 (Ambion), or anti-miR-16 (Ambion), using the lipofectamine [TM] 2000 reagent (Invitrogen).
[score:1]
Functional manipulation of miR-16 caused reciprocal alterations in SMRT protein but not SMRT mRNA levels.
[score:1]
LNA DIG-probes for miR-16 (Exiqon, Vedbaek, Denmark) were hybridized using UltraHyb reagents (Ambion) according to the manufacturer's instructions, with snRNA RNU6B blotted as a control.
[score:1]
These data suggest that LPS stimulation increases miR-16 gene transcription in H69 and U937 cells through MAPK -dependent but NF-κB-independent mechanisms.
[score:1]
To determine the role of these signaling pathways in LPS -induced transactivation of miR-16-encoding genes, we measured the levels of pri-miRNA-16-1 and pri-miR-16-2 in H69 and U937 cells in response to LPS in the presence or absence of pharmacological inhibitors to NF-κB or MAPK pathways.
[score:1]
Levels of both pri-miR-16-1 and pri-miR-16-2 showed a time -dependent increase in cells following LPS stimulation (Fig. 1C).
[score:1]
0030772.g002 Figure 2(A) Multiplex bead array analysis of IL-6, IL-8, and IL-1α proteins in H69 cells transfected with pre-control or miR-16 precursor for 48 h, followed by exposure to LPS for 12 h. Data shown are averages of three independent experiments.
[score:1]
For real-time PCR analysis of mature miR-16, total RNAs were extracted using the mirVana™ miRNA Isolation Kit (Ambion).
[score:1]
H69 cells were transfected with pre-control or miR-16 precursor (30 nM) for 24 h, followed by exposure to LPS for 2 h. Act D was then added to the cultures, and cells were collected for real-time PCR analysis.
[score:1]
Cells were treated with various doses of miR-16 precursor or anti-miR-16 for 48 h, followed by Western blotting for the SMRT protein and real-time PCR for SMRT mRNA.
[score:1]
Binding of miR-16 to SMRT 3′UTR.
[score:1]
Transfection of H69 cells with the miR-16 precursor resulted in a significant increase in LPS -induced luciferase activity (Fig. 4A).
[score:1]
A similar increase in IL-8, IL-1α, and IL-6 mRNA levels was evident in U937 cells transfected with the miR-16 precursor (Fig. 2C).
[score:1]
Previous studies demonstrated that miR-16 restricted production of cytokines and chemokines in HeLa cells [26].
[score:1]
In contrast, a dose -dependent decrease of SMRT protein content was observed in cells treated with the miR-16 precursor (Fig. 5D).
[score:1]
H69 cells were transfected with miR-16 precursors (30 nM) or anti-miR-16 (30 nM) for 24 h, then treated with LPS (1 µg/ml) for 2 h. Transcription was stopped using actinomycin D (10 µg/ml), and RNAs were prepared either immediately or at 0.5, 1, and 2 h post-actinomycin D treatment.
[score:1]
In silico analysis revealed that a miR-16 seed sequence was predicted in one of the highly conserved regions of the 3′UTR of SMRT (Fig. S5).
[score:1]
The schematic diagrams show the structure of two miR-16 genes encoding pri-miR-16-1 and pri-miR-16-2, respectively.
[score:1]
LPS stimulation increases miR-16 gene transcription in a MAPK -dependent but NF-κB-independent manner.
[score:1]
Nevertheless, no significant change in SMRT mRNA levels was detected between the control cells and cells treated with miR-16 precursor or anti-miR-16 (Fig. 5D).
[score:1]
The oligonucleotide corresponding to miR-16, but not miR-143-3p, primed first strand synthesis from the SMRT mRNA (Fig. 5A), suggesting that a miR-16 binding site exists in the SMRT 3′UTR.
[score:1]
Reverse transcription was primed with DNA oligonucleotides corresponding to miR-16 sequence (5′-TAGCAGCACGTAAATATTGGCG-3′).
[score:1]
The schematic shows the approach using a miR-16 oligonucleotide to prime first-strand synthesis from SMRT mRNA.
[score:1]
Cells were transfected with the pMIR-REPORT luciferase construct containing the miR-16 binding site in the SMRT 3′UTR, and treated with the anti-miR-16 or miR-16 precursor, followed by luciferase analysis.
[score:1]
Cells were transfected with anti-control (30 nM) or anti-miR-16 (30 nM) for 24 h and cultured for an additional 24 h in the presence or absence of LPS (1 µg/ml).
[score:1]
H69 and U937 cells were exposed to LPS for 4 h to 24 h, and pri-miR-16-1 and pri-miR-16-2 levels were quantified by real-time PCR.
[score:1]
analysis was used to assess IL-8, IL-6, and IL-1α mRNA levels in H69 cells transfected with anti-control or anti-miR-16 for 48 h, followed by exposure to LPS for 6 h. Data are averages of three independent experiments.
[score:1]
Transfection of H69 and U937 cells with anti-miR-16 caused a dose -dependent increase of SMRT protein content (Fig. 5D).
[score:1]
miR-16 contains a UAAAUAUU sequence that is complementary to the 3′UTR AREs of mRNAs for many inflammatory cytokines and chemokines, such as IL-8, IL-6, and tumor necrosis factor-alpha [26], [27].
[score:1]
Similarly, anti-miR-16 did not influence IL-8, IL-1α, and IL-6 mRNA stability in LPS-stimulated cells (Fig. 3B).
[score:1]
Accordingly, functional manipulation of miR-16 had a significant impact on LPS -induced production of IL-8, IL-6, and IL-1α.
[score:1]
0030772.g003 Figure 3 (A) Effects of the miR-16 precursor on the stability of IL-6, IL-8, and IL-1α mRNAs in cells following LPS stimulation.
[score:1]
Functional manipulation of miR-16 does not affect the stability of IL-6, IL-8, and IL-1α mRNAs.
[score:1]
[1 to 20 of 115 sentences]
|
4 |
![]()
Other miRNAs from this paper: hsa-let-7a-1, hsa-let-7a-2, hsa-let-7a-3, hsa-mir-17, hsa-mir-18a, hsa-mir-20a, hsa-mir-21, hsa-mir-23a, hsa-mir-26b, hsa-mir-92a-1, hsa-mir-92a-2, hsa-mir-101-1, hsa-mir-106a, hsa-mir-16-2, mmu-mir-23b, mmu-mir-101a, mmu-mir-130a, mmu-mir-199a-1, hsa-mir-199a-1, mmu-mir-122, hsa-mir-199a-2, hsa-mir-222, mmu-mir-106a, mmu-mir-130b, hsa-mir-23b, hsa-mir-122, hsa-mir-130a, mmu-let-7a-1, mmu-let-7a-2, mmu-mir-16-1, mmu-mir-16-2, mmu-mir-18a, mmu-mir-20a, mmu-mir-21a, mmu-mir-23a, mmu-mir-26b, mmu-mir-92a-2, mmu-mir-101b, mmu-mir-17, mmu-mir-222, mmu-mir-199a-2, mmu-mir-92a-1, hsa-mir-101-2, hsa-mir-130b, hsa-mir-18b, hsa-mir-20b, mmu-mir-20b, hsa-mir-92b, mmu-mir-18b, mmu-mir-92b, hsa-mir-23c, mmu-mir-101c, mmu-mir-21b, mmu-mir-130c, mmu-mir-21c
These results agree with the in vitro data (Fig. 7A) and suggest that miR-16 inhibits the proliferation of hepatoma cells, among other mechanisms, through downregulation of COX-2. Since miR-16 regulates COX-2 expression by binding to the MRE in the 3′-UTR COX-2 and by inhibition of HuR in HCC cell lines, we evaluated the relationship between miR-16, HuR and COX-2 mRNA/protein expression in individual tumoral (T) and paired non-tumoral (NT) HCC human samples.
[score:11]
To further support the hypothesis that miR-16 is involved in the down-regulation of COX-2 translation, we tested the expression of COX-2 in Hep3B cells after transfection with siCOX-2 or miR-16, in the presence of the transcription inhibitor actinomycin-D. We found a decrease of COX-2 protein in both cases (Fig. 4A–B).
[score:10]
miRNA-16 is able to inhibit cell proliferation, to promote cell apoptosis and to suppress the ability of WRL68 hepatoma cell line to develop tumors in nude mice partially through targeting COX-2 expression.
[score:9]
The present results demonstrate that miR-16 regulates COX-2 expression in HCC cells by binding directly to the MRE response element in the COX-2 3′UTR and this binding inhibits mainly COX-2 translation without affecting significantly mRNA decay.
[score:9]
Recent works have reported that miR-101 downregulation is involved in COX-2 overexpression in human colon cancer cells (CRC) [24], miRNA-26b regulates the expression of COX-2 in desferrioxamine -treated carcinoma of nasopharyngeal epithelial cells [25] and binding of miR-16 to AREs of TNF-α, IL-6, IL-9 and COX-2 mRNA transcripts could promote their degradation [20], [26].
[score:9]
Our results show that miR-16 directly silences COX-2 expression in hepatoma cells and indirectly through the downregulation of HuR.
[score:8]
Therefore, the reduced expression of miR-16 in those HCC with a high COX-2 expression may contribute to the promotion of cell proliferation and the inhibition of apoptosis and consequently facilitate the development of these types of tumors.
[score:8]
Indeed, Dixon et al. [37] reported a direct interaction between HuR and miR-16 promoting the downregulation of miR-16 and targeting COX-2 in colon cancer cells.
[score:7]
As shown in Fig. 5E–F, miR-16 inhibited the COX-2 and HuR protein levels in both cellular types; however, in the presence of HuR, the ability of miR-16 to downregulate COX-2 protein levels was partially abolished.
[score:6]
HuR antagonizes the downregulation of COX-2 expression caused by miR-16 in hepatoma cell lines.
[score:6]
The results suggest that miR-16 could specifically bind to the 3′UTR region of COX-2 and represses COX-2 translation reinforcing the hypothesis that COX-2 mRNA is a direct target for miR-16.
[score:6]
WRL68 and Hep3B cells were transfected with: 30 nM siRNA anti-COX2 (siCOX-2) or 50 nM of miR-16, miR-16 inhibitor (In-miR-16), miR negative control (miR-NC) or miR negative control inhibitor (In-miR-NC).
[score:5]
Corresponding densitometric analysis is shown and the relative expression of each sample is related to the value at 0 h as 1. F) Hep3B cells were transfected with 50 nM miR-16, miR-16 inhibitor (In-miR-16) or lipofectamine and permeabilized with digitonine to obtain soluble and pellet fractions enriched in PB as described in Methods.
[score:5]
Our data are in agreement with the proposed interaction between miR-16 and HuR mRNA in HCC cells and suggest two different mechanisms for miR-16 to inhibit COX-2: by binding directly to the MRE response element in the COX-2 3′-UTR and by decreasing the levels of HuR through a direct interaction.
[score:5]
The miRNAs (miR-16, miR-26b, miR-101, miR-199a, miR-122 and miR-21) were selected by using miRWalk computational analyses, that covers miRNA-targets interactions information produced by 8 established miRNA prediction programs on 3' UTRs of all known genes of Human, Mouse and Rat, i. e., RNA22, miRanda, miRDB, TargetScan, RNAhybrid, PITA, PICTAR, and Diana-microT, and comparing the obtained results with data collected from the literature.
[score:5]
Furthermore, when Hep3B cells were treated with digitonin and fractionated after transfection with miR-16 in order to localize COX-2 mRNA in soluble or P-bodies (PB) fractions [34], the amount of COX-2 mRNA present in PB was more than 90%, suggesting inhibition of translation.
[score:5]
Our results clearly show that COX-2 mRNA was located in P-bodies (>90%) after transfection with miR-16, inhibiting its translation.
[score:5]
Young et al. [36] demonstrated that miR-16 binds the COX-2 3′UTR and inhibits COX-2 expression by promoting mRNA decay in colon cancer.
[score:5]
Moreover, miR-16 is also present in the HuR immunoprecipitated and the analysis of miR-16 predicted target genes determined by using the algorithms miRWalk showed that among miR-16 target genes one is HuR.
[score:5]
0050935.g002 Figure 2WRL68 and Hep3B cells were transfected with: 30 nM siRNA anti-COX2 (siCOX-2) or 50 nM of miR-16, miR-16 inhibitor (In-miR-16), miR negative control (miR-NC) or miR negative control inhibitor (In-miR-NC).
[score:5]
miR-16 binds COX-2 mRNA and inhibits its translation.
[score:5]
The miR-16 precursor (PM10339), which was a double-stranded RNA mimicking the endogenous mature miRNA, the miR-16 inhibitor (In-miR-16, AM10339) which was a single stranded nucleic acid designed to specifically bind to and inhibit endogenous microRNA molecule, their negative controls (miR-NC, AM17110; In-miR-NC, AM17010) and anti-COX-2 siRNA (siCOX-2) (positive control, forward 5′- GGGCUGUCCCUUUACUUCAtt -3′and reverse 5′- UGAAGUAAAGGGACAGCCCtt-3′) were purchased from Ambion (Austin, TX, USA).
[score:5]
To determine whether miR-16 -mediated COX-2 protein loss was due in part to a decrease in HuR expression, Hep3B and WRL68 cell lines were cotransfected with miR-16 and HuR expression vectors.
[score:5]
miR-16 Binds COX-2 mRNA and Inhibits its Translation.
[score:5]
It has been described by Huang et al. that miR-16 decreased the association of its target mRNA with polysomes in 293T and HeLa cells by mediating the association of mRNA with processing bodies (P-bodies), since localization of mRNAs to these structures is a consequence of translational repression [34].
[score:5]
miR-16 regulates COX-2 expression in HCC cell lines.
[score:4]
To further analyze the effect of miR-16 on hepatoma cell growth in vivo, the WRL68 cells were transiently transfected with miR-16, miR-NC or miR-16 together with a human COX-2 expression vector that lacks the 3′ UTR and, therefore, it cannot be regulated by miR-16.
[score:4]
Figure S1 miR-16 downregulates COX-2 by binding its 3′UTR.
[score:4]
From a functional point of view, COX-2 down-regulation by miR-16 increased apoptosis and decreased cell proliferation in human hepatoma cell lines.
[score:4]
HuR Antagonizes miR-16 Activity in Regulating COX-2 Expression in Hepatoma Cell Lines.
[score:4]
Among the six miRNAs analyzed, the expression of miR-16 showed the highest inverse correlation with the COX-2 protein/mRNA ratio (R [2] = 0.858, p = 0.016) (Fig. 1B), suggesting that miR-16 is involved in COX-2 regulation in hepatoma cell lines.
[score:4]
Our results show that miR-16 silences COX-2 expression in hepatoma cells by two mechanisms: by binding directly to the MRE motif in the COX-2 3′-UTR and by decreasing the levels of HuR.
[score:4]
Downregulation of COX-2 by miR-16 increases apoptosis in HCC cells.
[score:4]
miR-16 Regulates COX-2 Expression in HCC Cell Lines.
[score:4]
In almost all HCC lines analyzed, miR-16 expression was lower than in control hepatocytes (HH), whereas COX-2 protein levels were higher (Fig. 1A).
[score:3]
These results suggest that miR-16 may exert its pro-apoptotic function partially through decreasing COX-2 expression.
[score:3]
We performed a similar experiment in the presence of the protein synthesis inhibitor, cycloheximide (CHX) and the results obtained reveal that both miR-16 and CHX induced a rapid decay of COX-2 protein with a synergistic effect (Fig. 4D–E).
[score:3]
WRL68 cells were transfected in vitro with 50 nM miR-NC or miR-16 and pPyCAGIP-hCOX-2 ORF (hCOX-2 expression vector lacking COX-2 3′ UTR) by using lipofectamine 2000.
[score:3]
mir-16 Suppresses the Growth of Hepatoma Cells in vitro and in vivo.
[score:3]
The results demonstrate that miR-16 interacts with COX-2 mRNA and promotes COX-2 protein decrease mostly through a translational repression mechanism.
[score:3]
miR-16 suppresses growth of hepatoma cells in vitro and tumorigenicity in vivo.
[score:3]
Inverse Correlation between miR-16 and COX-2 Expression is Observed in HCC Human Biopsies.
[score:3]
As a further control, the effect of both miR-16 and miR-NC inhibitors were analyzed.
[score:3]
Overexpression of miR-16 promoted apoptosis in Hep3B hepatoma cells.
[score:3]
Our data show that the ectopic expression of miR-16 repressed cell proliferation of hepatoma cells in vitro and tumor growth in vivo, and these effects were partially reverted by treatment with PGE [2].
[score:3]
As shown in Fig. 5C–D, overexpression of miR-16 in WRL68 and Hep3B cell lines led to a substantial decrease in HuR protein levels.
[score:3]
To establish whether the effect of miR-16 on COX-2 expression was mediated through a direct miRNA:mRNA interaction, we performed a RNA immunoprecipitation (RNA-IP) assay in WRL68 cells transfected with miR-16.
[score:3]
COX-2 mRNA amounts (white bars), normalized to the expression of 36b4 mRNA, and miR-16 expression (grey bars), normalized against U6 RNA levels, were calculated.
[score:3]
Our data suggest an important role for miR-16 in HCC and implicate the potential therapeutic application of miR-16 in those HCC with a high COX-2 expression.
[score:3]
The expression profile of six miRNAs (miR-16, miR-26b, miR-101, miR-199a, miR-122 and miR-21) was analyzed in HCC cell lines (Table 1).
[score:3]
Furthermore, COX-2 inhibition mediated by miR-16 promoted apoptosis in HCC cells by increasing apoptotic proteins such as caspase-3. Various cytoplasmic proteins have been observed to bind to the COX-2 ARE.
[score:3]
Moreover, a reduced miR-16 expression correlates with high levels of COX-2 in liver from HCC patients.
[score:3]
Moreover a reduced miR-16 expression tends to correlate to high levels of COX-2 protein in liver from patients affected by HCC.
[score:3]
As shown in Fig. 3A, COX-2 mRNA was present in the Argo2 immunoprecitation samples where miR-16 was expressed whereas capture of the negative control actin mRNA was unchanged.
[score:3]
We overexpressed miR-16 in HCC cell lines and examined whether it decreases endogenous COX-2 levels.
[score:3]
In the present report, miR-16 target site prediction for COX-2 was performed using RNAhybrid [35] and we found one predicted MRE for miR-16 at positions 1195–1217 taking as position 1 the beginning of the 3′ UTR region.
[score:3]
miR-16 interacts with HuR mRNA in the 3′UTR and represses HuR translation in human breast cancer cells [39].
[score:3]
To further establish a functional relationship between miR-16 and COX-2, we tested whether COX-2 expression was required to miR-16 -dependent induction of apoptosis.
[score:3]
COX-2 mRNA and miR-16 expression were analyzed by real-time PCR.
[score:3]
COX-2 mRNA and miR-16 expression were normalized against 36b4 mRNA and U6 RNA levels, respectively.
[score:3]
RNA immunoprecipitation (RNA-IP) was performed to determine whether HuR would associate with COX-2 and whether there is a direct interaction between HuR and miR-16 in WRL68 cell line.
[score:2]
The expression of intratumoral miR-16, measured by real-time PCR, increased in tumors injected with cells transfected with miR-16 compared with miR-NC without being modified by COX-2 overexpression (Fig. 7D).
[score:2]
mir-16 Suppresses the Growth of Hepatoma Cells in vitro and in vivo We sought to determine whether miR-16 affects the growth of hepatoma cell lines assessed by the MTT reduction assay.
[score:2]
To ensure that miR-16 can bind to this predicted region and cause translational repression, we performed a luciferase reporter gene assay in HuH-7 and HepG2 cells with low levels of miR-16.
[score:2]
Figure S2COX-2 correlates inversely with miR-16 and directly with HuR in HCC human biopsies.
[score:2]
NT samples (E) COX-2 protein levels were compared to miR-16 expression in T samples.
[score:2]
miR-16 Down Regulation of COX-2 Sensitizes HCC Cells to Apoptosis.
[score:2]
However, the functional consequences of miR-16 associated with HCC progression have not been established.
[score:1]
We cloned the 3′UTR region of COX-2 containing the miR-16 putative binding site (seed region) and a mutant variant downstream the Luc gene in pGL3-vector (pGL3-seed and pGL3-mut, respectively) (Fig. 3B).
[score:1]
A fragment of 3′UTR COX-2 mRNA (region 1195–1217, from NM_000963) which include the MRE binding site for miR-16, and a mutant variant were cloned into pGL3-Promoter vector (pGL3-empty, Promega, USA) downstream firefly luciferase gene (SacI, HindIII sites) to obtain the luciferase reporter constructs (pGL3-seed and pGL3-mut, respectively).
[score:1]
A similar distribution of COX-2 mRNA was observed upon transfection of Hep3B cells with In-miR-16 (Fig. 4F–G).
[score:1]
Moreover, the transfection of In-miR-16 induced an increase of COX-2 protein mainly in Hep3B cells.
[score:1]
The binding of miR-16 to COX-2 mRNA, HuR to COX-2 mRNA and the binding of HuR to miR-16 were analyzed by immunoprecipitation and PCR analysis.
[score:1]
the miR-16+ COX-2 condition.
[score:1]
In pGL3-mut this region was mutated in order to avoid the binding between miR-16 and Luc mRNA.
[score:1]
Using several programs (RNAhybrid, PITA, and RNA22), miR-16 was predicted to associate with the 3′UTR region of COX-2 to different MRE motifs (Table S1).
[score:1]
miR-16 caused a decrease in COX-2 protein levels within 48 h of transfection in both cell lines (Fig. 2A–B).
[score:1]
org), miR-16 was predicted to associate with the 3′UTR region of COX-2 to different MRE motifs.
[score:1]
Next, we investigated the effect of COX-2 -mediated inhibition by miR-16 in hepatocarcinogenesis.
[score:1]
miR-16 and COX-2 Correlate Inversely in Hepatoma Cell Lines.
[score:1]
These results provide further evidence that COX-2 mRNA is post-transcriptionally controlled by miR-16.
[score:1]
COX-2 -dependent production of PGE [2] increased the volume and the weight of tumors comparing with miR-16 (Fig. 7B–C).
[score:1]
Moreover, we did not observe variations of the luciferase activity in cells cotransfected with pGL3-mut and miR-16, in comparison to cells transfected only with pGL3-mut (Fig. 3C–D).
[score:1]
Transfection of the cells with miR-16 decreased cell growth up to 40%, being restored to 70% in the presence of PGE [2].
[score:1]
In pGL3-seed, the putative binding site of miR-16 on COX-2 mRNA 3′-UTR region (as detected by RNAhybrid software) was introduced downstream luciferase gene.
[score:1]
miR-16 and COX-2 correlate inversely in HCC cell lines.
[score:1]
Table S1 Several binding sites for miR-16 wihtin COX-2 3′UTR, predicted by diferent algorithms.
[score:1]
To study the relationship between miR-16 and HuR in HCC cell lines, we determined whether HuR levels were altered by miR-16 transfection.
[score:1]
However, a recent work [39] has demonstrated that miR-16 inversely correlates with HuR protein levels in human breast carcinoma.
[score:1]
Hep3B cell lines were transfected with miR-16 or In-miR16 48 hours prior to harvesting at a final concentration of 50 nM.
[score:1]
Effect of miR-16 on COX-2 mRNA and protein stability.
[score:1]
Using several programs (RNAhybrid, PITA, and RNA22), miR-16 was predicted to associate with the 3′UTR region of COX-2 to different MRE motifs (Table S1) and we found one predicted MRE for miR-16 at positions 1195–1217 taking as position 1 the beginning of the 3′ UTR region.
[score:1]
However, the effect of miR-16 on apoptosis was partially attenuated by treatment of cells with PGE [2] (Fig. 6A).
[score:1]
As indicate in Fig. 7A, the growth of Hep3B cells transfected with miR-16 was significantly decreased relative to control cells.
[score:1]
Western blot analysis of active caspase-3 showed an increase in the pro-apoptotic protein by the effect of miR-16 and this effect was also reverted in the presence of PGE [2] (Fig. 6B).
[score:1]
The 3′UTR sequence of human COX-2 was retrieved using Ensembl Data base, and miR-16 sequence for Homo Sapiens was downloaded from mirBase website.
[score:1]
miR-16 (C) Tumor weight and a representative picture of the tumors.
[score:1]
the miR-16 transfection condition.
[score:1]
We found that miR-16 led to a significant reduction in the volume and weight of the tumor comparing with the mice injected with miR-NC.
[score:1]
miR-16 condition.
[score:1]
Hep3B cells were transfected with 50 nM miR-16 or miR-NC, or 30 nM siCOX-2. 5 µg/ml actinomycin-D (Act D) or 10 µg/ml cycloheximide (CHX) were added after transfection.
[score:1]
The transfection of In-miR-16 increased the luciferase activity while the transfection of miR-NC had no effects.
[score:1]
The presence of COX-2 mRNA in WRL68 cell transfected with miR-16 or Lipofectamine after Ago2 immunoprecipitation was assessed, and fold differences were plotted.
[score:1]
Moreover, when RNA-IP was performed, miR-16 was also present in the HuR immunoprecipitates (Fig. 5B).
[score:1]
0050935.g004 Figure 4Hep3B cells were transfected with 50 nM miR-16 or miR-NC, or 30 nM siCOX-2. 5 µg/ml actinomycin-D (Act D) or 10 µg/ml cycloheximide (CHX) were added after transfection.
[score:1]
Cells (3×10 [4] cells/well) were seeded in 24-wells plate and transfected for 6–12 h with pGL3-empty (750 ng), pGL3-seed (750 ng), pGL3-mut (750 ng), pGL3-UTR (750 ng), pGL3-UTR mut (750 ng), pRL-SV40 vector (50 ng, Promega, USA), miR-16 (50 nM), In-miR-16 (50 nM) or miR-NC (50 nM) or a different combinations of them using lipofectamine 2000 reagent protocol.
[score:1]
[1 to 20 of 106 sentences]
|
5 |
![]()
Enhanced cellular expression of miR-16 using miR-16 mimics promoted the nuclear translocation of NF-κB p65 leading to the activation of the NF-κB signaling pathway associated with enhanced expression of IFN-γ and IL-8. Conversely, transfection with miR-16 inhibitor resulted in enhanced expression of the A2aAR and decreased activation of the NF-κB signaling pathway (Fig. 5).
[score:9]
The results indicated significant up-regulation of miR-16 in colonic macrophages associated with decreased expression of TNF-α and IL-12p40, specifying its role in suppressing the associated mucosal inflammation 18.
[score:8]
Conversely, in cells transfected with miR-16 inhibitor, the expression of mature miR-16 was significantly decreased (P < 0.01; Fig. 3E), while the expression of A2aAR mRNA and protein increased more than 50% compared to cells transfected with inhibitor-NC (P < 0.05; Fig. 3F–H).
[score:8]
HT-29 cells were analysed upon treatment with miR-16 inhibitor (increases the expression of the A2aAR) followed by treatment with siRNA against the A2aAR (knocks-down the expression of the A2aAR).
[score:8]
miR-16 mimics (double stranded 5′-UAGCAGCACGUAAAUAUUGGCG-3′/3′-AUCGUCGUGCAUUUAUAACCGC-5′), a universal miRNA mimics negative control (mimics-NC), miR-16 inhibitor (antisense oligonucleotides 5′-CGCCAAUAUUUACGUGCUGCUA-3′), a universal miRNA inhibitor negative control (inhibitor-NC), A2aAR-siRNA (5′-CAACUACUUUGUGGUGUCA-dTdT-3′/3′- dTdT-GUUGAUGAAACACCACAGU-5′), and a universal siRNA -negative control (siRNA-NC) were purchased from RiboBio (Guangzhou, China).
[score:7]
Accordingly, inhibition of miR-16 by its inhibitor increased the expression of the A2aAR and decreased the activation of the NF-κB signaling pathway.
[score:7]
Further, using gain-of-function (using miR-16 mimics) and loss-of-function (using miR-16 inhibitor) studies, we demonstrated that miR-16 inhibited the endogenous expression of the A2aAR at the post-transcriptional level in colonic epithelial cells (HT-29 cells).
[score:7]
To predict potential targets of miR-16, three in silico analysis programs were used for microRNA targets prediction: Micro Cosm Targets (http://www.
[score:7]
Our results imply regulation of activation of the NF-κB signaling pathway by miR-16, at least in part, by targeting the expression of the A2aAR.
[score:6]
Correspondingly, the expression of IFN-γ and IL-8 was significantly decreased in cells transfected with miR-16 inhibitor compared to cells transfected with inhibitor-NC (P < 0.05; the right two bars on Fig. 5D–G).
[score:6]
We co -transfected HT-29 cells with miR-16 inhibitor and A2aAR-siRNA (knockdown A2aAR expression).
[score:6]
Additionally, transfection with miR-16 inhibitor (blocking the activity of miR-16) significantly increased the luciferase activity of pmiR-A2aAR-wt in co -transfected HT-29 cells compared to cells transfected with miRNA inhibitor negative control (inhibitor-NC) (P < 0.05; Fig. 2C).
[score:6]
The expression of (F) A2aAR mRNA and (G,H) protein was increased in HT-29 cells transfected with miR-16 inhibitor compared to cells transfected with the inhibitor-NC (** P < 0.01, * P < 0.05), in a dose -dependent manner ([&] P < 0.01, [#] P < 0.05).
[score:6]
These results indicate that knocking down the expression of the A2aAR by siRNA could reverse the effects of miR-16 inhibitor on the activation of the NF-κB signaling pathway stimulated by TNF-α.
[score:6]
Recently, a study demonstrated that miR-16 mimics could directly target PDCD4 in macrophage-derived foam cells and could suppress the production of pro-inflammatory cytokines 19.
[score:6]
miR-16 is known to suppress TNF-α, IL-6 and COX-2 expression in tumour cell lines like HeLa cells 16, and in human THP-1 monocytic cells treated with S100b 17.
[score:5]
Left panel: Positions of miR-16 target site in the 3′-UTR of A2aAR mRNA was predicted by TargetScan, including human (hsa), chimp (ptr), rhesus (mml), dog (cfa), cow (bta) and zebrafish (dre).
[score:5]
Our results indicated that miR-16 suppressed the expression of the A2aAR and increased the activation of the NF-κB signaling pathway.
[score:5]
HT-29 cells were transfected with 150 nM of miR-16 mimics, mimics-NC, miR-16 inhibitor and/or inhibitor-NC, respectively.
[score:5]
Protein expression of the A2aAR showed inverse correlation with the expression of miR-16 in sigmoid mucosa in active UC patients (Fig. 1B,E,G).
[score:5]
Taken together, we demonstrated that miR-16 inhibited the expression of A2aAR protein at the post-transcriptional level and promoted activation of the NF-κB signaling pathway.
[score:5]
Co-transfection of miR-16 inhibitor (150 nM) with A2aAR-siRNA (150 nM) in TNF-α -treated HT-29 cells, resulted in increased translocation of NF-κB p65 protein into the nuclear area, and higher production of IFN-γ and IL-8 compared to cells co-transfection with miR-16 inhibitor and siRNA-NC (P < 0.05; Fig. 6A–G).
[score:4]
miR-16 regulates the endogenous expression of A2aAR.
[score:4]
were evaluated to determine if knocking down the expression of the A2aAR could reverse the effects of miR-16 inhibitor on the NF-κB signaling pathway.
[score:4]
Endogenous expression of A2aAR is regulated by miR-16.
[score:4]
Collectively, these data confirm that the A2aAR is a direct target of miR-16 in colonic epithelial cells.
[score:4]
Compared to inhibitor-NC, miR-16 inhibitor increased the localization of NF-κB p65 protein in the cytoplasm and decreased it in the nucleus (P < 0.05; the right two bars on Fig. 5A–C).
[score:4]
Further, we aimed to determine whether the effects of miR-16 on NF-κB signaling pathway were regulated by the expression of A2aAR.
[score:4]
These results indicate that miR-16 could negatively regulate the endogenous expression of the A2aAR in colonic epithelial cells.
[score:4]
from qRT-PCR indicated enhanced expression of mature miR-16 (P < 0.01; Fig. 3A) and decreased expression of A2aAR mRNA (P < 0.05; Fig. 3B) in a dose dependent manner in cells transfected with miR-16 mimics compared to the mimics-NC group.
[score:4]
These results indicate the role of miR-16 in inflammation and immune response that are mediated by targeting different genes in a tissue and cell specific manner.
[score:3]
Furthermore, a statistically significant inverse correlation was found between the expression of miR-16 and A2aAR protein (Pearson correlation r = −0.438, P < 0.05; Fig. 1G).
[score:3]
This co-transfection resulted in enhanced translocation NF-κB p65 into the nucleus and increased production of IFN-γ and IL-8 when stimulated with TNF-α, indicating that A2aAR-siRNA reversed the effects of miR-16 inhibitor on the NF-κB signaling pathway.
[score:3]
Expression of the A2aAR and miR-16 in tissues.
[score:3]
To determine whether miR-16 could affect the NF-κB signaling pathway in colonic epithelial cells, miR-16 mimics or miR-16 inhibitor was transfected into TNF-α -treated HT-29 cells.
[score:3]
To determine the specific effect of miR-16 on the 3′-UTR of A2aAR, HT-29 cells were cultured in 24-well plates and co -transfected with 500 ng of pmiR-A2aAR-wt or pmiR-A2aAR-mut, 150 nM miR-16 mimics, or miR-16 inhibitor, or negative controls using the lipofectamine™ 2000 reagent.
[score:3]
No significant correlation was observed between the expression of miR-16 and A2aAR mRNA levels in tissues with active UC (Pearson correlation r = 0.095, P > 0.05; Fig. 1F).
[score:3]
The cells were transfected with 150 nM of miR-16 mimics, or miR-16 inhibitor, or negative controls.
[score:3]
In order to predict the downstream putative targets of miR-16, in silico analyses was performed.
[score:3]
miR-16 targeting 3′-UTR of the A2aAR.
[score:3]
In the present study, we specifically analysed the expression of miR-16 in individual sigmoid biopsies from clinical subjects.
[score:3]
qRT-PCR reactions were performed in triplicate using SYBR [®] Premix Ex Taq [TM] II (Perfect Real Time, Takara, Japan) on LightCycler [®] (Roche Diagnostics, Nutley, NJ, USA) in a 96-well format, over 45 cycles with denaturation at 95 °C for 10 s and annealing at 60 °C for 20 s. U6 small RNA was used to normalize the levels of miR-16, and GAPDH was used to normalize the mRNA expression levels of A2aAR, IFN-γ, and IL-8. The relative expression was calculated using the 2 [−∆CT] method.
[score:3]
Our results indicated enhanced expression of miR-16 in sigmoid tissues of UC patients (n = 28) than IBS patients (n = 22) and normal controls (n = 20) (P < 0.01; Fig. 1B).
[score:3]
These results suggest that altered expression of miR-16 might be associated with IBD.
[score:3]
Different concentrations (50 nM, 100 nM, and 150 nM) of miR-16 mimics, miR-16 inhibitor, or negative controls were transfected into HT-29 cells, using lipofectamine™ 2000 reagent (Invitrogen, USA) in Opti-MEM (Gibco, USA), according to the manufacturer’s instructions.
[score:3]
The 3′-UTR of A2aAR is targeted by miR-16.
[score:3]
Luciferase reporter assay indicated that miR-16 could directly and specifically target 3′-UTR of the A2aAR.
[score:3]
The 3′-UTR of the A2aAR in a luciferase reporter vector was targeted by miR-15 together with miR-16 in human PMNs, but not in T cells 26.
[score:3]
Further, cells were co -transfected with 150 nM miR-16 inhibitor and A2aAR-siRNA or siRNA-NC (150 nM), using the lipofectamine™ 2000 reagent.
[score:3]
According to the data from in silico analysis, mature miR-16 sequences were evolutionary conserved across several species and they targeted the corresponding 3′-UTR of A2aAR mRNA (Fig. 2A).
[score:3]
How to cite this article: Tian, T. et al. MicroRNA-16 is putatively involved in the NF-κB pathway regulation in ulcerative colitis through adenosine A2a receptor (A2aAR) mRNA targeting.
[score:3]
Expression of miR-16 and A2aAR in sigmoid colon tissues.
[score:3]
Additionally, miR-16 putatively targeted the 3′-UTR of A2aAR mRNA across species (except mouse), the comparative sequence alignment data of human and other species are shown in Fig. 2A (left panel).
[score:3]
To confirm the prediction that miR-16 specifically targeted A2aAR mRNA, we constructed luciferase reporter vectors carrying the wild type sequence of the A2aAR 3′-UTR downstream of the luciferase gene (named as pmiR-A2aAR-wt), and the corresponding mutant (named as pmiR-A2aAR-mut, detailed in M&M section).
[score:3]
The expression of miR-16 and A2aAR was analysed in human sigmoid biopsies from healthy subjects, IBS, and active UC patients.
[score:3]
Effect of miR-16 on the activation of NF-κB p65 and expression of IFN-γ and IL-8..
[score:3]
Identification of potential downstream targets of miR-16.
[score:3]
A genome-wide microarray screening study had identified enhanced expression of miR-16 in UC patients 5 12.
[score:3]
HT-29 cells were co -transfected with 150 nM of miR-16 inhibitor and A2aAR-siRNA or siRNA-NC, and stimulated with TNF-α.
[score:3]
Luciferase activity of pmiR-A2aAR-mut in co -transfected HT-29 cells was not altered by transfection with either miR-16 mimics or miR-16 inhibitor (P > 0.05; Fig. 2B,C).
[score:3]
The activation of the NF-κB signaling pathway was investigated by transfecting TNF-α -treated HT-29 cells with 150 nM of miR-16 inhibitor or inhibitor-NC.
[score:3]
The expression of NF-κB p65 protein was significantly decreased in the cytoplasm and increased in the nucleus in TNF-α treated miR-16 mimics transfected cells compared to cells transfected with mimics-NC (P < 0.05; Fig. 5A–C).
[score:2]
Accordingly, the expression of IFN-γ and IL-8 mRNAs and proteins were increased in miR-16 mimics transfected cells compared to cells transfected with mimics-NC (P < 0.05; Fig. 5D–G).
[score:2]
Consistent with previous studies, our results indicated enhanced expression of miR-16 in active UC patients compared to IBS patients and healthy volunteers.
[score:2]
However, the role of miR-16 in the development of UC has not been elucidated.
[score:2]
Compared to the corresponding NC control, nuclear translocation of NF-κB p65 protein was enhanced in cells transfected with miR-16 mimics, and decreased in cells transfected with miR-16 inhibitor.
[score:2]
To investigate the role of miR-16 in the regulation of the endogenous expression of the A2aAR, miR-16 mimics and mimics-NC were transiently transfected into HT-29 cells at 50 nM, 100 nM, and 150 nM, respectively.
[score:2]
Based on our findings and those from others, both miR-16 and A2aAR are considered as potential therapeutic targets in controlling inflammation and would benefit IBD patients.
[score:2]
To investigate whether the effects of miR-16 on the activation of the NF-κB signaling pathway were though regulating the expression of the A2aAR.
[score:2]
However, there was no significant difference in the expression of miR-16 and A2aAR in samples from IBS patients compared to normal controls (P > 0.05).
[score:2]
A mutant (named as pmiR-A2aAR-mut) was created by site-directed mutagenesis to replace the miR-16 binding site TGCTGCTA with ACGACGAT.
[score:2]
It worth to note, using approaches such as Argonaute co-precipitating-complex assay to precisely determine the direct interaction between miR-16 and A2aAR mRNA in vivo would be greatly appreciated in the future.
[score:1]
In order to study the relation between miR-16 and NF-κB signaling pathway, activation of the NF-κB signaling pathway was first validated in HT-29 cells that were stimulated with TNF-α.
[score:1]
The analysis revealed the presence of a putative miRNA-16 binding site in the 3′-UTR of A2aAR mRNA (RefSeq NM_000675).
[score:1]
The sequence of mature miR-16 was found to be evolutionary conserved across several species (Fig. 2A right panel).
[score:1]
Recently, an interesting study was performed in a murine colitis mo del to evaluate the therapeutic effects of using miR-16 precursors conjugated with colonic macrophage targeting vectors (based on galactosylated low molecular weight chitosan).
[score:1]
To study the effects of miR-16 on the activation of the NF-κB signaling pathway, 150 nM of miR-16 mimics or mimics-NC were transiently transfected into HT-29 cells.
[score:1]
Real time quantitative reverse transcription polymerase chain reaction (qRT-PCR) was used to evaluate the mRNA expression of miR-16 and A2aAR.
[score:1]
Taken together, our results suggest that the effects of miR-16 on the activation of the NF-κB signaling pathway might be mediated by the A2aAR.
[score:1]
These results representing gain-of-function and loss-of-function indicate that miR-16 influenced the activation of the NF-κB signaling pathway and pro-inflammatory cytokine production in colonic epithelial cells.
[score:1]
The A2aAR mediates the effects of miR-16 on the activation of the NF-κB signaling pathway.
[score:1]
Effects of miR-16 on the activation of the NF-κB signaling pathway.
[score:1]
[1 to 20 of 82 sentences]
|
6 |
![]()
Other miRNAs from this paper: hsa-mir-15a, hsa-mir-29a, hsa-mir-29b-1, hsa-mir-29b-2, hsa-mir-103a-2, hsa-mir-103a-1, hsa-mir-16-2, mmu-mir-15b, mmu-mir-29b-1, mmu-mir-145a, mmu-mir-146a, mmu-mir-182, hsa-mir-34a, hsa-mir-182, hsa-mir-223, mmu-mir-34c, mmu-mir-34b, hsa-mir-15b, hsa-mir-145, hsa-mir-146a, mmu-mir-15a, mmu-mir-16-1, mmu-mir-16-2, mmu-mir-29a, mmu-mir-29c, mmu-mir-34a, mmu-mir-103-1, mmu-mir-103-2, mmu-mir-342, mmu-mir-223, mmu-mir-29b-2, hsa-mir-29c, hsa-mir-34b, hsa-mir-34c, hsa-mir-342, hsa-mir-511, hsa-mir-146b, mmu-mir-146b, mmu-mir-511, hsa-mir-103b-1, hsa-mir-103b-2, mmu-mir-145b
Restoration of these downregulated miRNAs in mouse primary sarcoma cell lines showed that miR-16, but not other downregulated miRNAs, was able to significantly suppress both migration and invasion in vitro, without altering cell proliferation.
[score:9]
Therefore, just as we recently demonstrated that miR-182 regulates metastasis by targeting multiple genes (Sachdeva et al., 2014), miR-16 may also regulate metastasis through a number of targets, which are differentially regulated in immunocompromised versus immunocompetent mice.
[score:8]
Previous studies have shown that miR-16 can suppress cell cycle progression by targeting multiple G1 cyclins (Bandi et al., 2009) and that miR-223 can indirectly regulate cyclin E (Xu et al., 2010).
[score:7]
miR-16 overexpression suppresses lung metastasis in a nude mouse transplant mo del in vivoTo determine whether miR-16 can suppress metastasis in vivo, we transplanted sarcoma cells into the muscle of nude mice so that the tumor cells would grow at an orthotopic site.
[score:7]
miR-16, but not other miRNAs, suppresses both migration and invasion in vitroGlobal downregulation of miRNAs has been shown to correlate with both high-grade tumors and poor patient survival (Lu et al., 2005; Martello et al., 2010).
[score:6]
We subsequently focused on proteins whose mRNA has a putative binding site for miR-16 using Targetscan and found that only 11 of the ∼170 upregulated proteins were encoded by genes containing predicted miR-16 binding sites (supplementary material Table S4).
[score:6]
Hypoxia-microRNA-16 downregulation induces VEGF expression in anaplastic lymphoma kinase (ALK) -positive anaplastic large-cell lymphomas.
[score:6]
miR-15a and miR-16 are implicated in cell cycle regulation in a Rb -dependent manner and are frequently deleted or down-regulated in non-small cell lung cancer.
[score:5]
In addition, in an orthotopic amputation mo del, miR-16 overexpression in a sarcoma cell line (KP1) suppresses both the rate and number of lung metastases.
[score:5]
This might explain the apparent discordance with the orthotopic transplant experiments in which miR-16 overexpression decreased metastasis, indicating that high levels of miR-16 suppress metastasis.
[score:5]
Fig. 3. miR-16 overexpression suppresses lung metastasis in a nude mouse transplant mo del in vivo.
[score:5]
miR-16 overexpression suppresses lung metastasis in a nude mouse transplant mo del in vivo.
[score:5]
d. (B) Cell growth assay showing that ectopic expression of miRNAs does not affect cell proliferation in vitro with the exception of miR-223, which enhances the growth at days 2 and 3, and miR-146a, which suppresses cell growth at days 2 and 3. (C,D) Quantification of Matrigel assay demonstrating that miR-16, but not any of the other miRNAs, suppresses both migration and invasion, respectively.
[score:5]
Restoration of miR-16 expression in mouse primary sarcoma cell lines significantly suppressed both migration and invasion in vitro and metastasis to the lung of sarcoma cells transplanted into the muscle of immunocompromised mice (an orthotopic mouse mo del of STS).
[score:5]
For injection, we utilized an STS cell line derived from a primary tumor that had a high base rate of metastasis (KP1), allowing us to test whether miR-16 overexpression can suppress metastasis.
[score:5]
The proteomic screen revealed that ∼300 proteins were differentially regulated at least 2-fold between the miR-16 -expressing and miR-16- deleted sarcoma cells.
[score:4]
By comparing the downregulated miRNAs in metastatic sarcomas from human and mouse, we found six miRNAs common to both: miR-16, miR-103, miR-146a, miR-223, miR-342 and miR-511 (Fig. 1D,E).
[score:4]
miR-16 was first reported to be frequently deleted and/or downregulated in chronic lymphocytic leukemia (CLL) at the 13q14.3 locus (Calin et al., 2002).
[score:4]
They report that miR-16 is downregulated in both human and mouse metastatic STS.
[score:4]
To our knowledge, our study reports for the first time that miR-16 is downregulated in both human and mouse metastatic STS.
[score:4]
miR-15a and miR-16-1 down-regulation in pituitary adenomas.
[score:4]
This finding suggests that restoration of miR-16 may downregulate gene(s) responsible for cellular migration and invasion.
[score:4]
To search for potential targets of miR-16 that can regulate metastasis, we performed a liquid chromatography/mass spectrometry (LC/MS) proteomic screen of cell lines derived from primary sarcomas with (n=3) or without (n=3) miR-16 deletion, as previously described (Sachdeva et al., 2014).
[score:4]
Therefore, one potential mechanism by which tumors might downregulate miR-16 to promote metastasis is via hypoxia.
[score:4]
However, it does not rule out the possibility that, in concert with downregulation of other miRNAs, loss of miR-16 could contribute to metastasis.
[score:4]
For example, stable overexpression of miR-16 suppresses both migration and invasion of cells in a Matrigel assay without affecting proliferation of the cells.
[score:4]
Of note, immunostaining of sarcomas with an antibody directed against Ki-67, which is a marker of cellular proliferation because it is expressed during interphase (G1, S, G2) and mitosis (M), but not in resting G0 cells (Scholzen and Gerdes, 2000), showed no difference between the two groups suggesting that miR-16 deletion had no significant impact on proliferation of sarcoma cells in vivo (Fig. 4C,D).
[score:4]
Similar analysis in mouse metastatic sarcomas revealed overlap for several downregulated miRNAs including miR-16, miR-103, miR-146a, miR-223, miR-342 and miR-511.
[score:4]
In this mo del, primary sarcoma cells with or without miR-16 overexpression are injected into the muscle of immunocompromised mice and after tumors developed they were resected and the mice were followed for the development of lung metastasis.
[score:4]
Frequent deletions and down-regulation of micro- RNA genes miR15 and miR16 at 13q14 in chronic lymphocytic leukemia.
[score:4]
Although we did not observe any deletion of the miR-16 locus in primary metastatic mouse sarcomas by comparative genomic hybridization (data not shown), there could be other factors that regulate miR-16 expression within primary sarcomas.
[score:4]
Using unbiased genomic profiling, miR-16 was found to be lost in human osteosarcoma specimens and was further shown to suppress tumor growth by activating caspase-3 in xenograft studies in nude mice.
[score:3]
Unlike the other miRNAs tested, overexpression of only miR-16 significantly decreased both migration and invasion of KP cells (Fig. 2C and D, respectively).
[score:3]
For example, 9/10 mice developed lung metastasis in the vector control group, but only 4/10 mice developed lung metastasis from the sarcoma cells overexpressing miR-16.
[score:3]
Taken together, these in vitro and in vivo results suggest that miR-16 can act as a metastasis suppressor in sarcoma.
[score:3]
The discordant results reported here between the effects of miR-16 overexpression in an orthotopic transplant mo del in immunocompromised mice and miR-16 deletion in a primary tumor mo del in immunocompetent mice demonstrate the importance of utilizing complementary gain-of-function and loss-of-function approaches and primary tumor mo del systems for the study of metastasis.
[score:3]
In addition, we demonstrate that miR-16 can suppress in vitro migration and invasion of primary STS cells.
[score:3]
To determine whether miR-16 can suppress metastasis in vivo, we transplanted sarcoma cells into the muscle of nude mice so that the tumor cells would grow at an orthotopic site.
[score:3]
Because miR-16 has been shown to suppress cell proliferation in various tissues, we next determined whether deletion of miR-16 had any effect on proliferation of sarcoma cells.
[score:3]
We generated primary sarcomas by injecting an adenovirus expressing Cre recombinase (Ad-Cre) into KP mice (miR-16 WT) and into KP miR-16 [flox/ flox] mice to generate sarcomas with deletion of miR-16 (miR-16 F/F) (Fig. 4A).
[score:3]
miR-16, but not other miRNAs, suppresses both migration and invasion in vitro.
[score:3]
In addition, qRT-PCR confirmed that miR-16 expression is lost at the transcript level in the primary cell lines (Fig. 4B).
[score:3]
To further test the functional significance of miR-16 as a metastasis suppressor gene, we used a loss-of-function approach in primary sarcomas.
[score:3]
In addition, orthotopic transplantation of a sarcoma cell line stably expressing miR-16 into the muscle of immunocompromised mice revealed that restoration of miR-16 can significantly decrease lung metastasis in vivo.
[score:3]
The miR-15a-miR-16-1 cluster controls prostate cancer by targeting multiple oncogenic activities.
[score:3]
Mice with tumors overexpressing miR-16 were more likely to survive without metastasis to the lung.
[score:3]
The lungs from mice in which orthotopic tumors overexpressed miR-16 had a decreased number of lung metastases.
[score:3]
This finding suggests that decreasing miR-16 expression is not sufficient to promote lung metastasis in primary sarcomas in KP mice.
[score:3]
Tumors were generated by intramuscular injection of an adenovirus expressing Cre recombinase, as previously described (Kirsch et al., 2007) into the hind limb of mice with genotype LSL-Kras [G12D/+]; p53 [fl/fl] (KP) or LSL-Kras [G12D/+]; p53 [fl/fl]; miR-15a/16-1 [fl/fl] (KP miR-16 F/F).
[score:3]
These results demonstrate that miR-16 can suppress migration and invasion in vitro in multiple KP sarcoma cell lines without altering cell proliferation.
[score:3]
A recent study found that miR-16 acts as a tumor suppressor in osteosarcoma (Jones et al., 2012).
[score:3]
Overexpression of miR-16 significantly decreased both migration and invasion in both of these cell lines in vitro, without altering their cell proliferation (Fig. 1F,G and data not shown).
[score:3]
For example, expression of miR-16 is decreased by hypoxia (Dejean et al., 2011), and hypoxia also correlates with metastasis in STS (Brizel et al., 1996; Eisinger-Mathason et al., 2013).
[score:3]
These results are consistent with the in vitro experiments in which overexpression of miR-16 decreased metastatic phenotypes of invasion and migration (Fig. 2).
[score:3]
However, these orthotopic transplant experiments do not address whether decreased miR-16 expression is sufficient to promote metastasis.
[score:3]
Taken together, these results indicate that miR-16 can have metastasis-suppressing properties both in vitro and in vivo.
[score:3]
We further demonstrate that overexpression of miR-16 decreases metastasis in an orthotopic mouse mo del in immunocompromised mice, but deletion of miR-16 in primary sarcomas fails to increase metastasis.
[score:3]
Using miR-16 [flox/ flox] mice, we were able to delete two alleles of miR-16 during sarcomagenesis and then follow the mice for the development of lung metastases.
[score:2]
There is no impact of miR-16 deletion on time to sarcoma development (N=18 control KP miR-16 WT mice and N=26 KP-miR-16 F/F mice).
[score:2]
Later, many investigators found downregulation of miR-16 in multiple tumor types, including prostate cancer, pituitary adenomas and gastric cancer (Bonci et al., 2008; Bottoni et al., 2005).
[score:2]
Overexpression of miR-16 in sarcoma cells was sufficient to limit metastasis in an orthotopic assay in immunodeficient mice, which suggests that decreased miR-16 may be necessary for metastasis in some sarcomas.
[score:2]
We thank Riccardo Dalla-Favera at Columbia University for providing miR-16 [flox/+] mice.
[score:1]
To our surprise, we did not observe any change in the rate of lung metastasis after deleting miR-16.
[score:1]
As shown in Fig. 3A, there was no change in the growth of primary tumors between vector control and miR-16-infected cells, but a significant difference was observed in the rate and number of lung metastases (Fig. 3B,C).
[score:1]
However, the loss-of-function experiments in autochthonous tumors indicate that loss of miR-16 is not sufficient to promote metastasis in vivo.
[score:1]
We crossed KP mice to mice in which miR-16 was flanked by loxP sites (i. e. miR-16 [flox/ flox] mice) so that Cre recombinase can delete miR-16 (Fig. 4A).
[score:1]
This loss-of-function experiment suggests that deletion of miR-16 is not sufficient to promote metastasis.
[score:1]
Confirming that miR-16 is efficiently deleted in primary sarcomas and with no effect on sarcoma proliferation, we expanded a cohort of KP miR-16 [flox/ flox] and KP miR-16 [wt/wt] mice to generate primary sarcomas to study metastasis.
[score:1]
However, deletion of miR-16 failed to promote metastasis in a primary tumor mo del system, which suggests that loss of miR-16 is not sufficient to promote metastasis in vivo.
[score:1]
PCR showing Cre -mediated excision of miR-16 with the recombined allele from primary sarcomas (bottom panel).
[score:1]
Fig. 4. Deletion of miR-16 fails to promote lung metastasis in a mouse mo del of primary sarcoma.
[score:1]
PCR analysis on genomic DNA from primary cell lines generated from sarcomas with or without miR-16 deletion demonstrated efficient recombination of the miR-16 allele in KP sarcomas (Fig. 4A).
[score:1]
The lentiviral vectors (System Biosciences) encoding miR-16 and other miRNAs were packaged and used to infect cell lines KP1-KP3, as described previously (Sachdeva et al., 2012).
[score:1]
However, no change in the rate of lung metastasis was observed when miR-16 was deleted in mouse primary sarcomas at sarcoma initiation.
[score:1]
We did not observe a significant change in tumor onset or tumor growth kinetics after deletion of miR-16 in KP tumors (Fig. 4E).
[score:1]
Alternatively, the results from the primary tumor experiment might simply reflect the fact that there was an unexpectedly high rate of lung metastasis in the control KP mice, which could be a consequence of the mixed genetic background of the miR-16 [flox/ flox] mice.
[score:1]
The cell lines derived from independent tumors are numbered 1-5 (red, miR-16 WT; blue, miR-16 F/F).
[score:1]
Deletion of miR-16 does not increase metastasis in a mouse mo del of primary STS.
[score:1]
Therefore, to better define the role of miR-16 in metastasis, we utilized a primary mo del of STS in immunocompetent mice.
[score:1]
Notably, however, there was no change in the rate of lung metastasis when miR-16 was deleted in autochthonous tumors (a tumor that forms where it is found rather than being transplanted from elsewhere) in a mouse mo del of primary STS previously developed by the authors in which sarcomas develop in a spatially and temporally restricted manner and can be surgically resected so that the true metastatic potential of the primary tumor can be determined.
[score:1]
Fifty thousand exponentially growing KP1 vector or KP1 miR-16 cells were injected into the hind limb muscle of the nude mice.
[score:1]
Mice with tumors with deletion of miR-16 have similar survival without metastasis.
[score:1]
Three cell pellets each from either miR-16 WT or miR-16 F/F cells were washed with 50 mM ammonium bicarbonate and solubilized by sonication in 200 µl of 0.2% Rapigest-SF (w/v).
[score:1]
First, the primary tumor mo del system examined miR-16 deletion.
[score:1]
Red asterisks denote samples with either partial recombination of the miR-16 flox allele or stromal contamination in the primary sarcoma cell line.
[score:1]
The average number of lung metastases per mouse was 4.5 with vector-infected cells and 1 with miR-16-infected cells (Fig. 3C).
[score:1]
After Ad-Cre injection, KP mice with miR-16 deletion developed primary sarcomas with similar kinetics to the mice with wild-type miR-16.
[score:1]
Therefore, deletion of miR-16 in this experimental system may have been unable to further promote metastasis.
[score:1]
To further characterize the role of miR-16 on migration and invasion of KP cells and to exclude the possibility that this miR-16 phenotype was restricted to KP cell line 1 (KP1), we stably expressed miR-16 in two additional KP cell lines (KP2 and KP3; Fig. 1E).
[score:1]
[1 to 20 of 89 sentences]
|
7 |
![]()
Other miRNAs from this paper: hsa-let-7a-1, hsa-let-7a-2, hsa-let-7a-3, hsa-mir-29b-1, hsa-mir-29b-2, hsa-mir-16-2
Based on the inverse correlation between let-7a/miR-16/miR-29b and c-Myc and CCND2 expression, we hypothezed that down regulation of c-Myc would restore the expression of tumor-suppressive miRNAs, let-7a, miR-16 and miR-29b, subsequently down-regulate CCND2 in ES cell lines.
[score:11]
We also explored whether c-Myc would regulate the expression of let-7a, miR-16 and miR-29b and these tumor suppressive miRNAs suppress the expression CCND2.
[score:10]
Thus, the expression analysis data lead us to the prediction of new axis that c-Myc might repress the tumor suppressive miRNAs, let-7a, miR-16 and miR-29b, and the inhibition of these miRNAs might result in the up-regulation of CCND2 in ES cells.
[score:10]
As consistent with the data of in vitro experiments, the xenograft mo del of ES also indicated that let-7a, miR-16 and miR-29b induction had the ability to inhibit ES cells development ex vivo treatment by targeting CCND2 expression.
[score:8]
In the present study, knockdown of c-Myc using siRNA revealed the up-regulation of let-7a, miR-16 and miR-29b, indicating that these tumor suppressive miRNAs are also regulated by c-Myc as MRMs in ES cell lines.
[score:8]
In summary, the present study showed that the down-regulation of let-7a, miR-16 and miR-29b were mediated by c-Myc and subsequently inhibited the expression of CCND2 in SKES1.
[score:8]
The significant suppression of let-7a, miR-16 and miR-29b expression in ES cells suggests the tumor suppressive roles of these miRNAs in ES.
[score:7]
It is possible that let-7a, miR-16 miR-29b may have down-regulated CCND2 expression via indirect pathway.
[score:7]
Among the various families of miRNAs, the let-7a, miR-16 and miR-29b have become the prototypes for miRNAs that function as the tumor suppressors since these miRNAs could inhibit the expression of multiple oncogenes, including c-Myc [20– 22].
[score:7]
The results indicated that the expression of let-7a, miR-16 and miR-29b was coordinately up-regulated in ES cell lines, and made us to investigate genome-wide mRNA profiling by cDNA array to detect the possible targets of let-7a, miR-16 and miR-29b in ES cells.
[score:6]
In the present study, miRNA array results demonstrated that the expression of let-7a, miR-16 and miR-29b were down-regulated in all of five ES cell lines.
[score:6]
Inhibition of CCND2 expression by let-7a, miR-16 and miR-29b and CCND2-siRNA.
[score:5]
Among the predicted target genes of let-7a, miR-16 and miR-29b in the TargetScan (http://www.
[score:5]
Although let-7a, miR-16 and miR-29b might influence the expression of several genes, we focused on CCND2 as the target of the miRNAs in ES cells.
[score:5]
Although several miRNAs have been found to target CCND2, including let-7a [15], miR-16 [16] and miR-29b [17], the correlation of CCND2 expression and miRNAs in ES cells has been unknown.
[score:5]
Furthermore, ex vivo treatment studies showed the inhibition of ES tumor cell growth in mice injected with ES cells overexpressing of let-7a, miR-16 or miR-29b.
[score:5]
To test whether let-7a, miR-16 and miR-29b expression affected endogenous let-7a, miR-16 and miR-29b expression, we transfected let-7a, miR-16 and miR-29b mimic and their mutant oligonucleotides, as well as the negative control-miR, into SKES1 cells.
[score:5]
c-Myc exhibited inverse correlation with let-7a, miR-16 and miR-29b, and these tumor suppressive miRNAs played important roles in SKES1 proliferation and tumorigenesis by targeting CCND2 both in vitro and ex vivo treatment.
[score:5]
Silencing of c-Myc with c-Myc siRNA and let-7a, miR-16, miR-29b directly target to CCND2 mRNA in SKES1.
[score:4]
Several studies have shown that let-7a, miR-16 and miR-29b are down-regulated and are closely related to the abnormal potentials in malignant tumors [23– 25].
[score:4]
The analysis using several algorithms, such as BLAST, and real-time PCR after miRNAs transfection, further suggested that CCND2 was directly targeted by let-7a, miR-16 and miR-29b.
[score:4]
Our data suggests that c-Myc might negatively regulate let-7a, miR-16 and miR-29b expression in ES cells.
[score:4]
Indeed, debilitation of c-Myc using siRNA revealed down-regulation of CCND2, and induced the correction of abnormal cell cycle progression, which were consistent with the results of the transfection experiments with let-7a, miR-16 and miR-29b in ES cells.
[score:4]
Our results suggested that the same regulatory mechanism of CCND2 expression via let-7a, miR-16 and miR-29b might exist in ES cells.
[score:4]
CCND2 as a direct let-7a, miR-16 and miR-29b target in ES Cell lines.
[score:4]
Down regulation of let-7a, miR-16, and miR-29b expression in ES cell lines.
[score:4]
To study the roles of c-Myc in the regulation of let-7a, miR-16 and miR-29b in ES cells, we transfected the cells with siRNA targeting for c-Myc.
[score:4]
CCND2 as a direct let-7a, miR-16 and miR-29b target in ESThe region complementary to the let-7a, miR-16 and miR-29b seed region was found in the 3’-UTR of human CCND2.
[score:4]
It is noteworthy that the down-regulation of CCND2 by challenge of let-7a, miR-16, miR-29b or siRNA against CCND2 did not induce apoptosis in ES cells, indicating that the repression of ES cell growth was acquired by the cell cycle retardation.
[score:4]
S1 FigPredicted binding sites of let-7a (A), miR-16 (B), and miR-29b (C) in 3′-UTR of CCND2, as aligned by Basic Local Alignment Search Tool (BLAST), TargetScan 6.0 (microRNA.
[score:3]
Decreased CCND2 expression at the mRNA level following transfection with the let-7a, miR-16 and miR-29b mimic (Fig 3D–3F.
[score:3]
0138560.g004 Fig 4The expression of CCND2 protein was decreased in SKES1 transfected with let-7a (A), miR-16 (C), miR-29b (E) and CCND2-siRNA (G).
[score:3]
Inhibition of cell cycle progression at G0/G1 phase by let-7a, miR-16 and miR-29b.
[score:3]
Suppression of ES cell growth by transfection of let-7a, miR-16, miR-29b and CCND2-siRNA.
[score:3]
Inhibition of tumor growth in nude mice xenograft mo del by let-7a, miR-16 and miR-29b.
[score:3]
Our data regarding the cell cycle analysis showed that let-7a, miR-16 and miR-29b inhibited the proliferation of ES cells via cell cycle retardation at G1/G0 phase.
[score:3]
A considerable complementarity between sequences within the seed regions of let-7a, miR-16 and miR-29b and sequences in the 3’-UTR of CCND2 was predicted, using the algorithms in BLAST and TargetScan.
[score:3]
Let-7a, miR-16 and miR-29b suppressed the ex vivo treatment tumor growth.
[score:3]
The expression of CCND2 protein was decreased in SKES1 transfected with let-7a (A), miR-16 (C), miR-29b (E) and CCND2-siRNA (G).
[score:3]
The present study demonstrated that forced elevation of let-7a, miR-16 and miR-29b resulted in the reduction of the expression of CCND2 protein in ES cells.
[score:3]
The protein expression level of CCND2 in the let-7a, miR-16 and miR-29b -transfected cells (40nM) were reduced to 21.7%, 43.9% and 36.7% of that in the control cells, respectively (p < 0.05) (Fig 4B, 4D and 4F).
[score:3]
Since the transfection of let-7a, miR-16, and miR-29b resulted in the reduction of CCND2 expression, we next examine the effects of let-7a, miR-16, and miR-29b on the proliferation of ES cells.
[score:3]
Predicted binding sites of let-7a (A), miR-16 (B), and miR-29b (C) in 3′-UTR of CCND2, as aligned by Basic Local Alignment Search Tool (BLAST), TargetScan 6.0 (microRNA.
[score:3]
The cell growth of SKES1 was inhibited by the transfection of let-7a, miR-16 and miR-29b in comparison with untreated and negative control miRNA transfected cells at 48 h after the transfection as determined by the cell counting (Fig 5A–5C).
[score:3]
In the ES cell lines, the expression of let-7a was decreased by -24.15 ~ -46.15, miR-16 by -2.25 ~ -3.52, and miR-29b by -4.88 ~ -10.37 folds compared with hMSCs, respectively (Fig 2).
[score:2]
CCND2-siRNA transfected SKES1 cells, as same as let-7a, miR-16 and miR-29b transfected cells, showed significant inhibition of the cell proliferation compared with the negative control siRNA transfected cells (Fig 5D).
[score:2]
We observed an increased let-7a, miR-16, miR-29b expression by 6.23 fold, 5.99 fold, 6.66 fold respectively compared with control-miR (Fig 3C.
[score:2]
analysis showed that the expression levels of CCND2 dramatically decreased in all let-7a, miR-16, and miR-29b -transfected cells compared with negative control oligo -transfected cells (Fig 4A, 4C and 4E).
[score:2]
Therefore, let-7a, miR-16 miR-29b may have affected CCND2 mRNA directly at least in part.
[score:2]
On the contrary, the expression of let-7a (2.23 fold), miR-16 (1.35 fold), and miR-29b (1.56 fold) were significantly higher in c-Myc siRNA -transfected cells (20nM) compared with the untreated ES cells, as determined by real-time quantitative RT-PCR (Fig 3C).
[score:2]
SKES1 cells transfected with the miRNAs showed statistically smaller tumors in mice compared to untreated (1949.2 ± 57.9 mm [3]) and negative control miRNA transfected groups (1805 ± 83.9 mm [3]) (Fig 8F), indicating that let-7a (848 ± 85.1 mm [3]), miR-16 (636.8 ± 64.2 mm [3]) and miR-29b (711.8 ± 71.6 mm [3]) inhibited the growth of ES cells ex vivo treatment.
[score:2]
In the SKES1, the expression of let-7a was decreased by -24.15, miR-16 by -2.81 and miR-29b by -5.2 folds compared with hMSCs, respectively.
[score:2]
We next examined the functions of let-7a, miR-16 and miR-29b in the regulation of their possible target gene, CCND2, and the changes in the biological characteristics in ES cell lines.
[score:2]
The results herein indicated that the expressions of let-7a, miR-16 and miR-29b were repressed whereas those of c-Myc and CCND2 were increased in all five ES cell lines compared with hMSCs.
[score:2]
Consistent with the above data, the results demonstrated that CCND2 was the down-stream effector of let-7a, miR-16 and miR-29b, which were regulated by c-Myc.
[score:2]
Furthermore, the sequence analysis suggested possible association of let-7a, miR-16 and miR-29b with 3’UTR of CCND2 (S1 Fig).
[score:1]
The introduction of let-7a, miR-16 and miR-29b miRNAs into SKES1 cells resulted in the decreased growth of subcutaneous xenografted tumors in nude mice (Fig 8A–8E).
[score:1]
The programmed cell death was not induced by let-7a, miR-16 or miR-29b in ES cells.
[score:1]
0138560.g008 Fig 8The five groups included (A) untreated (n = 5), (B) transfected with negative control miRNA (n = 5), and (C) transfected with let-7a (n = 5), (D) transfected with miR-16 (n = 5) and (E) transfected with miR-29b (n = 5).
[score:1]
To examine the correlation between let-7a, miR-16 and miR-29b and CCND2 in ES cells, these miRNAs were transfected into SKES1 cells.
[score:1]
The transfection of let-7a mimic, let-7a mutant, miR-16 mimic, miR-16 mutant, miR-29b mimic, miR-29b mutant and negative control mRNAs (Control-miR) (Invitrogen) was performed using Lipofectamine 2000 reagent (Invitrogen) in antibiotics-free OptiMEM (Invitrogen).
[score:1]
Densitometry quantification of CCND2 protein levels after transfection of let-7a (B), miR-16 (D), miR-29b (F) and CCND2-siRNA (H).
[score:1]
The five groups included (A) untreated (n = 5), (B) transfected with negative control miRNA (n = 5), and (C) transfected with let-7a (n = 5), (D) transfected with miR-16 (n = 5) and (E) transfected with miR-29b (n = 5).
[score:1]
The data demonstrated that the restoration of let-7a miR-16 and miR-29b resulted in the cell cycle retardation at G0⁄G1 phase in ES cells.
[score:1]
0138560.g005 Fig 5. Antiproliferation effect of let-7a (A), miR-16 (B), miR-29b (C) and CCND2-siRNA (D) in ES cells.
[score:1]
After actinomycinD treatment, the mRNA expression level of CCND2 after transfection of negative control-miR, let-7a, miR-16, miR-29b and their mutant was measured by qRT-PCR.
[score:1]
Effects of let-7a, miR-16 and miR-29b miRNAs on the cell cycle in SKES1.
[score:1]
However, the biological roles of let-7a, miR-16 and miR-29b in ES cells have not been clarified yet.
[score:1]
The cleavage of PARP protein, a marker of caspase -mediated apoptosis, was not observed in miRNAs (let-7a, miR-16 and miR-29b) transfectants as well as untreated cells and negative control transfectants, in marked contrast to ADM -treated (positive control) cells (Fig 6H).
[score:1]
The region complementary to the let-7a, miR-16 and miR-29b seed region was found in the 3’-UTR of human CCND2.
[score:1]
Silencing of CCND2 using let-7a, miR-16 and miR-29b and CCND2-siRNA in SKES1.
[score:1]
Effects of let-7a, miR-16 and miR-29b on the induction of apoptosis in SKES1 cells.
[score:1]
Five groups were generated: (1) untreated control (n = 5); (2) transfected with negative control-miRNA (n = 5); (3) transfected with let-7a miRNA mimic (n = 5); (4) transfected with miR-16 miRNA mimic (n = 5); (5) transfected with miR-29b miRNA mimic (n = 5).
[score:1]
[1 to 20 of 73 sentences]
|
8 |
![]()
Other miRNAs from this paper: hsa-mir-16-2
Considering that miR-16 is highly expressed in normal tissues and frequently deleted and downregulated in many types of cancer tissues, the results also explain, at least in part, why FEAT is aberrantly overexpressed in most human cancers but weakly expressed in normal tissues.
[score:10]
Our findings provide the first clues regarding the role of miR-16 as a tumor suppressor in cancer cells through the inhibition of FEAT translation.
[score:7]
In these experiments, miR-16 overexpression was achieved by transfecting the cells with pre-mir-16 (a synthetic RNA oligonucleotide duplex mimicking the miR-16 precursor), and miR-16 knockdown was achieved by transfecting the cells with anti-mir-16 (a chemically modified antisense oligonucleotide designed to specifically target mature miR-16).
[score:6]
The expression of the FEAT protein was reduced by the overexpression of miR-16 and increased by the knockdown of miR-16 in A549, MCF-7, and Huh-7 cells (Fig. 2, b and c).
[score:6]
In conclusion, our results demonstrate that miR-16 directly recognizes and binds to the 3′-UTR of the FEAT mRNA transcript thereby inhibiting FEAT translation.
[score:6]
We showed that miR-16 could suppress FEAT expression and, in turn, promote apoptosis in cancer cells.
[score:5]
In contrast, transfection with the FEAT -overexpressing plasmid, which specially expresses the full-length open reading frame (ORF) of FEAT without the miR-16–responsive 3′-UTR, had an opposite effect on cell apoptosis (Fig. 3, d and e).
[score:5]
The results reveal a critical role for miR-16 as a tumor suppressor and pro-apoptotic molecule in carcinogenesis through the repression of FEAT translation.
[score:5]
We identified a specific target site for miR-16 in the 3′-untranslated region (3′-UTR) of FEAT.
[score:5]
Therefore, we searched for miRNAs that could target FEAT and experimentally validated miR-16 as a direct regulator of FEAT.
[score:5]
We performed KEGG pathway analysis and GO annotation analysis on the experimental validated target genes of miR-16, and the results showed that most of these target genes were indeed anti-apoptotic factors (Additional file 1 Table S1 and S2).
[score:5]
Fig. 2Direct regulation of FEAT expression by miR-16 at the posttranscriptional level.
[score:5]
In this study, it is noted that restoring FEAT expression can successfully attenuate the pro-apoptotic effects of miR-16 on cancer cells, although miR-16 has many other targets.
[score:5]
The results suggest that targeting FEAT is a major mechanism by which miR-16 exerts its tumor-suppressive and pro-apoptotic function.
[score:5]
To determine the level at which miR-16 influenced FEAT expression, we repeated the above-mentioned experiments and examined the expression of FEAT mRNA after transfection.
[score:5]
Evidence indicates that miR-16 can modulate the cell cycle, inhibit cell proliferation, promote cell apoptosis, and suppress tumorigenicity both in vitro and in vivo [10].
[score:5]
In fact, miR-16 has been reported to act as a tumor-suppressive miRNA in many cancer types [9– 16], and multiple apoptosis-related genes are targeted by miR-16, including BCL-2, CCND1, CCND3, and CCNE1 [9, 13].
[score:5]
Thus, miR-16 is generally thought to be a key tumor-suppressive miRNA that can target numerous oncogenes in various human cancers.
[score:5]
These results demonstrate that miR-16 specifically regulates FEAT protein expression at the post-transcriptional level, which is a typical miRNA -mediated regulation mechanism.
[score:5]
the Gene Ontology (GO) classification was performed to gain insights into the biological functions of miR-16 target genes, and the Kyoto Encyclopedia of Genes and Genomes (KEGG) pathway enrichment analysis was performed to detect the potential pathway of miRNA target genes.
[score:5]
***, P < 0.001 To determine whether the negative regulatory effects that miR-16 exerted on FEAT expression were mediated through the binding of miR-16 to the presumed sites in the 3′-UTR of the FEAT mRNA, the full-length FEAT 3′-UTR that contained the sole presumed miR-16 binding site was fused downstream of the firefly luciferase gene in a reporter plasmid.
[score:4]
Consistently, miR-16 is frequently deleted and/or downregulated in many types of cancer, including chronic lymphocytic leukemia [9, 15], prostate cancer [14], and lung cancer [16].
[score:4]
The correlation between miR-16 and FEAT was further examined by evaluating FEAT expression in human lung adenocarcinoma A549 cells, human breast adenocarcinoma MCF-7 cells, and human hepatocellular carcinoma Huh-7 cells after overexpressing or knocking down miR-16.
[score:4]
After determining the levels of miR-16 in the same three pairs of lung cancer, breast cancer, and hepatocellular cancer tissues and the corresponding noncancerous tissues, we showed that the miR-16 levels were consistently downregulated in cancer tissues (Fig. 1d).
[score:4]
Overexpression and knockdown of miR-16.
[score:4]
Cancer cell lines (A549, MCF-7 and Huh-7) with miR-16 upregulation and FEAT silencing were established and the effects on apoptosis of cancer cells in vitro were assessed.
[score:4]
***, P < 0.001To determine whether the negative regulatory effects that miR-16 exerted on FEAT expression were mediated through the binding of miR-16 to the presumed sites in the 3′-UTR of the FEAT mRNA, the full-length FEAT 3′-UTR that contained the sole presumed miR-16 binding site was fused downstream of the firefly luciferase gene in a reporter plasmid.
[score:4]
This mutated luciferase reporter was unaffected by both the overexpression and knockdown of miR-16 (Fig. 2e).
[score:4]
Fig. 3The role of miR-16 targeting FEAT in the regulation of apoptosis of cancer cells.
[score:4]
Therefore, the modulation of FEAT by miR-16 might explain, at least in part, why the downregulation of miR-16 during carcinogenesis can accelerate cancer progression.
[score:4]
Moreover, compared with cells that had been transfected with pre-mir-16, those transfected with pre-mir-16 and the FEAT -overexpressing plasmid exhibited significantly lower apoptosis rates (Fig. 3, d and e), suggesting that miR-16-resistant FEAT is sufficient to rescue the suppression of FEAT by miR-16 and attenuate the pro-apoptotic effect of miR-16 on cancer cells.
[score:4]
Validation of FEAT as a direct target of miR-16.
[score:4]
1: miR-16 promotes the apoptosis of human cancer cells by targeting FEAT.
[score:3]
As expected, the overexpression of miR-16 resulted in a significant reduction of luciferase reporter activity compared with transfection with pre-scramble control, whereas the inhibition of miR-16 resulted in an increase in reporter activity compared with transfection with anti-scramble control (Fig. 2e).
[score:3]
Identification of conserved miR-16 target sites within the 3′-UTR of FEAT.
[score:3]
One potential miR-16 target site was found in the 3′-UTR of the FEAT mRNA sequence.
[score:3]
A549 cells were cultured in 12-well plates and transfected with pre-mir-16, anti-mir-16, FEAT siRNA, or the FEAT overexpression plasmid to induce apoptosis.
[score:3]
One particularly well-studied example is the ubiquitously expressed and highly conserved miR-16, one of the first miRNAs that was known to be linked to human malignancies [9].
[score:3]
Because FEAT is known to be involved in cell apoptosis regulation [3], we investigated whether the overexpression or knockdown of miR-16 or FEAT would impact cell apoptosis in A549 cells using flow cytometry analysis.
[score:3]
In this study, we hypothesized that FEAT is a target of miR-16.
[score:3]
These effects can be explained by several targets of miR-16: the anti-apoptotic gene B-cell lymphoma 2 (Bcl-2) [11]; numerous genes involved in the G1-S transition such as CCND1 (cyclin D1), CCND3 (cyclin D3), CCNE1 (cyclin E1), and CDK6 (cyclin -dependent kinase 6) [12– 14]; and genes involved in the Wnt signaling pathway, such as WNT3A (wingless-type MMTV integration site family, member 3A) [14].
[score:3]
Furthermore, in this study, we experimentally investigated the direct regulation of FEAT by miR-16 and the biological role of miR-16 targeting FEAT in human cancer cells.
[score:3]
The predicted interaction between miR-16 and the target sites in the FEAT 3′-UTR are illustrated in Fig. 1c.
[score:3]
Fig. 1Expression levels of the FEAT protein, FEAT mRNA, and miR-16 in cancer tissues.
[score:3]
Based on miRTarBase, there are now more than 100 experimental validated target genes of miR-16 [18].
[score:3]
To test the direct binding of miR-16 to the target gene FEAT, a luciferase reporter assay was performed as previously described [17].
[score:3]
miR-16 promotes the apoptosis of cancer cells by regulating FEAT.
[score:2]
We next focused on studying the role of miR-16 in regulating FEAT.
[score:2]
We then experimentally validated miR-16 as a direct regulator of FEAT using cell transfection and luciferase assays.
[score:2]
In this study, we further investigated whether the cellular phenotypes especially cell apoptosis were regulated by miR-16 targeting FEAT.
[score:2]
The results identified miR-16 as a novel link between the FEAT regulatory pathway and the pathogenesis of cancer.
[score:2]
We examined the expression of FEAT protein level by western blotting and miR-16 level by qRT-PCR assay.
[score:2]
Combining the computational prediction with the detection of inverse correlation between miR-16 and FEAT in vivo, it is quite likely that miR-16 is involved in the post-transcriptional regulation of FEAT.
[score:2]
For luciferase reporter assays, A549, MCF-7, and Huh-7 cells were cultured in 24-well plates, and each well was transfected with 1 μg of firefly luciferase reporter plasmid, 1 μg of a β-galactosidase (β-gal) expression plasmid (Ambion), and equal amounts (100 pmol) of pre-mir-16, anti-mir-16, or the scrambled negative control RNA using Lipofectamine 2000 (Invitrogen).
[score:2]
miR-16 FEAT Apoptosis Although our understanding of the molecular mechanisms of carcinogenesis has greatly improved, this knowledge has not led to the identification and development of effective tools for cancer screening and prevention.
[score:2]
Furthermore, we introduced point mutations into the corresponding complementary sites in the FEAT 3′-UTR to eliminate the predicted miR-16 binding site.
[score:2]
Although the dysregulation of miR-16 and FEAT plays an important role in carcinogenesis, no correlation between FEAT and miR-16 in cancers has been reported.
[score:2]
Taken together, this study delineates a novel regulatory network employing miR-16 and FEAT to fine-tune cell apoptosis in lung, breast, and hepatocellular cancer cells.
[score:2]
Using these approaches, miR-16 was identified as a candidate regulatory miRNA of FEAT.
[score:2]
c Schematic description of the hypothetical duplexes formed by the interactions between the binding site in the FEAT 3′-UTR (top) and miR-16 (bottom).
[score:1]
Consistent with the bioinformatic analyses, we identified an inverse correlation between the miR-16 and FEAT protein levels in lung cancer, breast cancer, and hepatocellular cancer tissues.
[score:1]
To test the binding specificity, the sequences that interacted with the miR-16 seed sequence were mutated (from UGCUGCU to ACGACGA), and the mutant FEAT 3′-UTR was inserted into an equivalent luciferase reporter.
[score:1]
In each well, equal amounts of pre-mir-16, anti-mir-16, or scrambled negative control RNA were used.
[score:1]
Although the intracellular level of miR-16 was significantly altered after transfection with pre-mir-16 and anti-mir-16, the alteration of the miR-16 levels did not affect the FEAT mRNA levels (Fig. 2d).
[score:1]
d Quantitative RT-PCR analysis of FEAT mRNA levels in A549, MCF-7, and Huh-7 cells transfected with pre-mir-control, pre-mir-16, anti-mir-control, and anti-mir-16.
[score:1]
b and c Western blot analysis of the FEAT protein levels in A549, MCF-7, and Huh-7 cells transfected with pre-mir-control, pre-mir-16, anti-mir-control, and anti-mir-16.
[score:1]
Finally, we demonstrated that the repression of FEAT by miR-16 promoted the apoptosis of cancer cells.
[score:1]
e Firefly luciferase reporters containing wild-type (WT) or mutant (MUT) miR-16 binding sites in the FEAT 3′-UTR were co -transfected into A549, MCF-7, and Huh-7 cells with pre-mir-control, pre-mir-16, anti-mir-control, and anti-mir-16.
[score:1]
This finding suggests that the binding site strongly contributes to the interaction between miR-16 and FEAT mRNA.
[score:1]
Taken together, the results indicate that miR-16 can promote cell apoptosis by silencing FEAT.
[score:1]
Furthermore, the miR-16 binding sequence in the FEAT 3′-UTR is highly conserved across species.
[score:1]
Subsequently, we assessed the role of miR-16 in cell apoptosis.
[score:1]
As anticipated, the miR-16 levels were significantly increased in A549, MCF-7, and Huh-7 cells when these cells were transfected with pre-mir-16, whereas the miR-16 levels were decreased when these cells were transfected with anti-mir-16 (Fig. 2a).
[score:1]
Detection of an inverse correlation between the miR-16 and FEAT levels in cancer tissues.
[score:1]
Synthetic pre-mir-16, anti-mir-16, and scrambled negative control RNAs were purchased from Ambion (Austin, TX, USA).
[score:1]
a Quantitative RT-PCR analysis of the miR-16 levels in A549, MCF-7, and Huh-7 cells transfected with pre-mir-control, pre-mir-16, anti-mir-control, and anti-mir-16.
[score:1]
As expected, A549 cells transfected with pre-mir-16 exhibited a significantly higher rate of cell apoptosis, whereas A549 cells transfected with anti-mir-16 had a lower apoptosis rate (Fig. 3, d and e).
[score:1]
The resulting plasmid was transfected into A549, MCF-7, and Huh-7 cells along with pre-mir-16 or anti-mir-16.
[score:1]
After measuring the expression levels of miR-16 and FEAT in different types of human cancer tissues and paired noncancerous tissues, we detected an inverse correlation between miR-16 and FEAT in human cancers.
[score:1]
[1 to 20 of 79 sentences]
|
9 |
![]()
Other miRNAs from this paper: hsa-mir-16-2
Collectively, these findings indicate that TNF-α- and TNF-α plus IL-17 -induced IL-8 mRNA expression is downregulated by miR16, TTP and KHSRP, whereas AUF-1 enhances IL-8 mRNA expression.
[score:8]
Whereas other miR's were over-expressed by transduction with lentiviral constructs, we have not been able to enhance miR16 levels by stable transfection and transduction with lentiviral constructs expressing miR16, suggesting that miR16 expression may be strictly controlled.
[score:7]
IL-17 induced inhibition of miR16 expression as well as inhibition of miR16 using complementary LNA, resulted in an attenuated mRNA degradation.
[score:7]
This suggests that miR16 may direct competition between the AUBps and herewith the expression of proteins encoded by ARE-containing transcripts, many of which have regulatory functions that contribute to the pathophysiology of chronic inflammatory diseases [11].
[score:7]
miR16 down-regulates IL-8 expression by promoting IL-8 mRNA degradation.
[score:6]
Collectively, these findings show that modulation of AUBp-miR16 mediated regulation of gene expression by IL-17 depends on the specific mRNA target, limiting miR16 usage and differential participation of the AUBps.
[score:6]
We have attempted to enhance miR16 expression by stable transfection and transduction with lentiviral constructs expressing miR16 (collaboration with InteRNA, Utrecht, The Netherlands) to determine whether that would promote mRNA degradation.
[score:5]
IL-17 limits miR16 expression and promotes cytoplasmic translocation of AUF-1. IL-17 limits miR16 expression and promotes cytoplasmic localization of AUF-1..
[score:5]
This cooperation between miR16 and various AU-containing mRNAs, and the impact of the synergistic effect of IL-17 and TNF-α, has been depicted in Fig. 7. It is likely that other AUBps not studied here, such as HuR, TIA-1 and TIAR contribute to the expression of ARE-containing mRNAs in a manner similar to TTP, KHSRP and AUF-1. The role of TIA-1 and TIAR may be particularly interesting, as they have been implicated in translational control.
[score:5]
Anti-miR16 only affected G-CSF and IL-6 protein expression in cells exposed to TNF-α plus IL-17, although the effect was small in comparison to knocking down AUBps (Fig. 6d and e).
[score:4]
Similar findings were obtained for other ARE-containing mRNAs, indicating that the various AUBps compete for binding to the target mRNA, the balance of which is regulated by IL-17, likely via miR16.
[score:4]
Nevertheless, it appears that IL-17 modulates miR16 usage in AUBp-miR16 mediated regulation of gene expression.
[score:4]
Mo del of IL-17 mediated regulation of ARE- mRNA expression by AUBps and miR16.
[score:4]
Together, this suggests that miR16 regulates VEGF expression independent of the AUBp-miR16 pathway.
[score:4]
So, it appears that miR16 is not required for binding of AUBps and their target mRNA.
[score:3]
VEGF expression was controlled by miR16 at all conditions tested and most dependent in cells exposed to TNF-α plus IL-17 (Fig. 6f), which may relate to the IL-17-reduced miR16 levels in these cells.
[score:3]
Whereas microRNAs target mRNAs to the RISC pathway for degradation by binding to a seed sequence, miR16 drives degradation by the AMD pathway without an apparent seed sequence.
[score:3]
Both IL-8 mRNA and miR16 co-purified with these immuno-purified preparations (Fig. 4, explained further in next paragraph), which is suggestive of a core complex that binds various AUBps, miR16 and target mRNAs.
[score:3]
The relative contribution of each of the AUBps studied here and that of miR16 depends on the target mRNA.
[score:3]
In addition, targeting AUBp and/or miR16 may provide a novel therapeutic option to combat the IL-17 axis of inflammation.
[score:3]
This reduced miR16 expression is in line with attenuated IL-8 mRNA degradation, likely caused by limited miR16 availability in cells exposed to TNF-α plus IL-17.
[score:3]
In cells exposed to TNF-α plus IL-17 most IL-8 mRNA is bound to AUF-1 with no miR16 associated, which inhibits IL-8 mRNA degradation.
[score:3]
Interestingly, inhibition of miR16 led to markedly exaggerated production of VEGF in cells exposed to TNF-α plus IL-17 but also, although to a lesser extent, at the other conditions (Fig. 6f).
[score:3]
Therefore, we assessed whether IL-17 affects miR16 expression and that of the various AUBps.
[score:3]
Involvement of AUBps and miR16 on expression of other inflammatory mediators and the effect of IL-17.
[score:3]
IL-17 attenuated miR16 expression and binding to the complex, and markedly promoted binding of IL-8 mRNA to AUF-1, in line with stabilization of IL-8 mRNA.
[score:3]
IL-17 in combination with TNF-α also attenuated expression of miR16, paralleled by reduced amounts of miR16 bound to the various immuno-purified AUBps, thereby dissipating the contribution of miR16 to IL-8 mRNA degradation.
[score:3]
In presence of TNF-α plus IL-17, miR16 association to ARE-mRNAs is limited and additional loading of stabilizing AUBps on the ARE-mRNA takes place, leading to attenuated ARE-mRNA degradation resulting in enhanced and prolonged expression of the encoded protein.
[score:3]
MiR16 was transiently induced with 30-fold increase at 1 h after stimulation by TNF-α (Fig. 5a), whereas co-exposure to IL-17 restricted the TNF-α -induced-miR16 expression to about 10-fold.
[score:3]
Alternatively, IL-8 mRNA degradation was inhibited by AUF-1 in the absence of miR16.
[score:3]
Human (h)TTP si -RNA (sc-36760), hAUF-1 si -RNA (sc-37028), hKHSRP si -RNA (sc-44831), control si -RNA (si-con) (Fluorescein Conjugate) (sc-36869) were purchased from Santa Cruz Biotechnologies and hsa-miR-16 miRCURY LNA inhibitor probe, was purchased from Exiqon.
[score:3]
First, we determined miR16 expression by Q-PCR in response to TNF-α and TNF-α plus IL-17 over time.
[score:3]
IL-17 modulates IL-6 and G-CSF expression also via miR16 and AUBps, but VEGF via miR16 only.
[score:3]
Overall our data indicate that the interactions between AUBps, miR16 and the target mRNA largely depends on the specific RNA sequences and probably structural restraints.
[score:3]
Jing and colleagues [30] have proposed that miR16 assists TTP in binding to its target TNF-α mRNA, possibly by the complementary sequences between miR16 and the AU-rich elements in TNF-α mRNA.
[score:3]
The relative contributions of these AUBps and that of miR16 were different in the cases of IL-6 and G-CSF but, as with IL-8 expression, IL-17 in presence of TNF-α also changed the relative contribution of these AUBps and that of miR16.
[score:3]
In the presence of TNF-α plus IL-17, TTP and KHSRP were associated with target mRNAs in the absence of miR16.
[score:3]
Here we show that IL-17 directs the AU -mediated mRNA degradation (AMD pathway) by modulating the interaction of degrading and stabilizing AUBps via microRNA16 (miR16).
[score:2]
In addition, inhibition of miR16 led to attenuated VEGF mRNA degradation in cells exposed to TNF-α plus IL-17 and to a lesser extent to those exposed to TNF-α alone as compared to non -transfected cells (Supporting Information Fig. S6b).
[score:2]
This indicates that there is an intricate interplay between the various AUBps and miR16 in regulating IL-8 production, which also differs between cells exposed to TNF-α or TNF-α plus IL-17.
[score:2]
Taken together, these findings strongly indicate that IL-17 limits miR16 involvement and regulates the binding of AUF-1 to IL-8 mRNA by translocation of AUF-1 from the nucleus to the cytoplasm.
[score:2]
It is unclear whether the AMD pathway and that directed by miR16 merge or are two independent pathways.
[score:2]
Here we report that degradation of mRNAs encoding IL-8, IL-6 and G-CSF is directed by the AMD mRNA decay pathway, which depends on the concerted action of various AUBps and, interestingly, miR16.
[score:2]
Notably, co-exposure to IL-17 almost completely abolished miR16 in immuno-purified KHSRP and TTP.
[score:1]
Failure to detect miR16 in this super-shifted material may indicate its absence, but may also be due to lack of sensitivity as the detection of miR16 by the labelled probe might be obscured by the antibody and vice-versa.
[score:1]
Although these analyses were difficult to accomplish and the resulting blots far from optimal, miR16 was found to co-migrate with IL-8 mRNA suggesting that they are in a large molecular weight complex.
[score:1]
AUF-1 did not co-purify with miR16 at any of the conditions.
[score:1]
Our data indicate that mRNA and miR16 indeed can complex with TTP, or KHSRP instead, but this association varies with conditions to which cells were exposed (unstimulated versus TNF-α versus TNF-α plus IL-17).
[score:1]
IL-17 exerts its function by changing the contribution of miR16 and AUBps.
[score:1]
This suggests that IL-17 changes the conformation of the complex, possibly related to an altered binding and cooperation between IL-8 mRNA, miR16 and the AUBps.
[score:1]
Taken together this indicates that IL-8 mRNA and miR16 assemble in a complex with the AUBps.
[score:1]
Degradation of IL-8 mRNA depended particularly on the AUBps TTP and KHSRP, and miR16, whereas IL-8 mRNA stabilization depended on AUF-1. IL-17 in presence of TNF-α changed the relative contribution of the various AUBps, best exemplified by the 400-fold enhanced binding of AUF-1 to IL-8 mRNA, protecting IL-8 mRNA from degradation.
[score:1]
Thus, in cells exposed to TNF-α, in which there is a profound IL-8 mRNA degradation, IL-8 mRNA is bound predominantly by KHSRP, TTP and miR16, which were shown to promote IL-8 mRNA degradation.
[score:1]
Q-PCR analysis of IL-8 mRNA was done for non -transfected or transfected cells with LNA-con or LNA-miR16 at 2 h after stimulation with TNF-α or TNF-α plus IL-17, or left unstimulated.
[score:1]
1003747.g006 Figure 6 a–c) Secreted levels of G-CSF (a), IL-6 (b) and VEGF (c) in supernatants of NCI-H292 cells, non -transfected (nt) or transfected with scrambled si -RNA (si-con), or si-TTP or si-KHSRP or si-AUF-1, unstimulated (ns) or stimulated with IL-17, TNF-α or TNF-α plus IL-17 for 24 h. d–f) Secreted levels of G-CSF (d), IL-6 (e) and VEGF (f) in supernatants of NCI-H292 cells, non -transfected or transfected with scrambled LNA (LNA-con), or LNA-directed against miR16 (LNA-miR16), unstimulated or stimulated with IL-17, TNF-α or TNF-α plus IL-17 for 24 h. Supernatants in duplicates from 3 experiments were mixed in equal amounts for the assay.
[score:1]
IL-8 protein production and IL-8 mRNA levels were enhanced markedly in anti-miR16 -treated cells exposed to TNF-α or TNF-α plus IL-17 (Fig. 3b and c).
[score:1]
The specificity of the binding of miR16 to the respective AUBps was also verified by analyzing material bound by the isotype-control IgG.
[score:1]
These mRNAs assembled with various AUBps in a novel ribonucleoprotein complex in the presence of miR16, which lead to their decay.
[score:1]
Upon exposure to TNF-α, mRNAs of inflammatory mediators, containing ARE- sequences in the 3′UTR (ARE-mRNA), associate with destabilizing AUBps and miR16.
[score:1]
The relative contributions of each of the AUBps and miR16 vary depending on the presence or absence of IL-17.
[score:1]
Another striking observation was the low miR16 presence in immuno-purified AUF-1 in lysates from cells exposed to TNF-α or TNF-α plus IL-17 (Fig. 4f).
[score:1]
1003747.g005 Figure 5 a) Q-PCR showing time dependent expression of miR16 measured in NCI-H292 cells stimulated with TNF-α or TNF-α plus IL-17.
[score:1]
IL-8 mRNA and miR16 present in immuno-purified preparations of AUBps.
[score:1]
To further determine whether IL-8 mRNA and miR16 interact with TTP, KHSRP and AUF-1, these AUBps were immuno-purified from cell lysates.
[score:1]
Treatment with anti-miR16 also enhanced IL-8 protein production induced by IL-17 alone.
[score:1]
So, IL-17 changes the relative contribution of the AUBps and miR16.
[score:1]
Figure S4Association of IL-8 mRNA and miR16 in material purified by isotype control IgG.
[score:1]
Interestingly, VEGF mRNA contains the seed sequence for miR16, but is not clear whether that determines the apparent independency of AUBps.
[score:1]
a–c) Secreted levels of G-CSF (a), IL-6 (b) and VEGF (c) in supernatants of NCI-H292 cells, non -transfected (nt) or transfected with scrambled si -RNA (si-con), or si-TTP or si-KHSRP or si-AUF-1, unstimulated (ns) or stimulated with IL-17, TNF-α or TNF-α plus IL-17 for 24 h. d–f) Secreted levels of G-CSF (d), IL-6 (e) and VEGF (f) in supernatants of NCI-H292 cells, non -transfected or transfected with scrambled LNA (LNA-con), or LNA-directed against miR16 (LNA-miR16), unstimulated or stimulated with IL-17, TNF-α or TNF-α plus IL-17 for 24 h. Supernatants in duplicates from 3 experiments were mixed in equal amounts for the assay.
[score:1]
Although the differences in fold change for miR16 associated to the various AUBps under the three conditions tested were small, the differences between AUBps indicate that the association between miR16 and AUBps are specific interactions.
[score:1]
For example, IL-8 mRNA degradation was cooperatively promoted by TTP, KHSRP and miR16.
[score:1]
1003747.g007 Figure 7 Upon exposure to TNF-α, mRNAs of inflammatory mediators, containing ARE- sequences in the 3′UTR (ARE-mRNA), associate with destabilizing AUBps and miR16.
[score:1]
Its correlation with mRNA decay, however, suggests that miR16 may promote ARE -mediated mRNA degradation, in particular by KHSRP and TTP.
[score:1]
a) Q-PCR showing time dependent expression of miR16 measured in NCI-H292 cells stimulated with TNF-α or TNF-α plus IL-17.
[score:1]
The absence of a seed sequence for miR16 in IL-8 mRNA and other mRNAs indicate that miR16 may indeed interact by complementarity to the AU-rich elements, but other modes of interaction such as suggested recently [38] are not excluded.
[score:1]
IL-17 promotes binding of IL-8 mRNA to AUF-1 and limits that of miR16.
[score:1]
d–f) Fold change in miR16 associated with immuno-purified KHSRP (d), TTP (e) and AUF-1 (f) in NCI-H292 cells stimulated for 2 h with TNF-α or TNF-α plus IL-17 with respect to non-stimulated cells.
[score:1]
miR16 limits IL-8 protein production and mediates degradation of IL-8 mRNA.
[score:1]
Our data also show that with reduced amounts of miR16 the stabilizing AUF-1 can outcompete TTP and KHSRP for binding to IL-8 mRNA and halt its degradation.
[score:1]
b) IL-8 released over 24 h in supernatant from NCI-H292 cells, non -transfected (nt) or transfected with LNA-con or LNA-miR16 and either non-stimulated (ns) or stimulated with IL-17, TNF-α or TNF-α plus IL-17.
[score:1]
To determine whether miR16 affects IL-8 production, cells were treated with a locked nucleic acid (LNA) -modified probe complementary to miR16 (anti-miR16) to limit the availability of miR16 (Fig. 3a).
[score:1]
Non -transfected (ns) or si-con or si-KHSRP or si-TTP or si-AUF-1 (a) or LNA against miR16 (b) transfected cells were stimulated with TNF-α or TNF-α plus IL-17 for 2 h. RNA was isolated from cells at 0, 30 and 60 minutes (mins) after blocking gene transcription by actinomycin D (5 µg/ml).
[score:1]
Cells were transfected with si-KHSRP, si-TTP, si-AUF-1 or LNA-miR16 in presence of Lipofectamine 2000 transfection reagent (Invitrogen) according to manufacturer's instructions, at a final concentration of 50 nM in serum-free medium (Opti-MEM, Invitrogen).
[score:1]
Along similar lines other microRNAs, particularly those that contain complementary AU-rich-sequences similar to those of miR16, may fulfil a similar role as miR16.
[score:1]
miR16 is presented relative to that of unstimulated, non -transfected cells.
[score:1]
TTP, KHSRP and AUF-1 complex with IL-8 mRNA and miR16.
[score:1]
[1 to 20 of 86 sentences]
|
10 |
![]()
Other miRNAs from this paper: hsa-mir-16-2, hsa-mir-15b
To confirm the miRNA-16 expression level in the presence of SB203850, real time PCR was performed and the results showed that inhibitory of p38 MAPK drastically suppressed VP-16 and 5-FU -induced miRNA-16 upregulation (Figure 5D), indicating that the increased miRNA-16 expression by VP-16 and 5-FU is involved in p38 MAPK signaling pathway.
[score:12]
Accordingly, miRNA-16 expression was upregulated significantly after VP-16 or 5-FU treatments in SGC7901 cells compared to the untreated control cells, while MMC, ADR and CDDP had minor effect on miRNA-16 expression (Figure 4F).
[score:7]
The in vitro bioluminescence imaging results demonstrated that VP-16 and 5-FU had no inhibitory effect on the luminescence intensity, whereas CDDP still reduced the luminescence signal (Figure 4C and 4D), indicating that CDDP may inhibit cellular growth but not activate endogenous miRNA-16 expression.
[score:7]
In the present study, we developed a dual imaging reporter system to investigate the differential expression of miRNA-16 response to various anticancer drugs both in vitro and in vivo, and found that two clinical drugs, VP-16 and 5-FU, can upregulate miRNA-16 expression in a p38 MAPK -dependent but NF-κB-independent manner in gastric cancers.
[score:6]
VP-16 and 5-FU upregulation of miRNA-16 expression noninvasively imaged by the dual reporter gene system.
[score:6]
The reasons for the decreased signal observed in VP-16, 5-FU and CDDP treatment might be that the drugs activated endogenous miRNA-16 expression or inhibited cellular growth even caused cell death.
[score:5]
Detection of endogenous miRNA-16 expression in vitro and in vivo To detect the endogenous miRNA-16 expression level in gastric cancer cells in vitro, equal numbers (1×10 [6]) of NF-empty and NF-3xmir16 cells were seeded and then the Fluc and hNIS activity were examined.
[score:5]
Our previous study has demonstrated that Bcl-2 protein is a direct target gene of miRNA-16 in the development of MDR in SGC7901 gastric cancer cells [11].
[score:5]
These results provide evidences to suggest that both Fluc and hNIS are expressed successfully in vitro and in vivo in our reporter gene system and could reflect effectively the expression change of miRNA-16 in the chemoresistance of gastric cancer cells.
[score:5]
In vivo monitoring of enhanced miRNA-16 expression by VP-16 and 5-FUFor noninvasive monitoring of enhanced miRNA-16 expression induced by VP-16 and 5-FU, NF-empty and NF-3xmir16 cells were grafted onto the left and right hindlimb of each mouse (n = 6), respectively.
[score:5]
Figure S2 Influence of NF-κB signaling pathway on the upregulation of miRNA-16 by VP-16 and 5-FU.
[score:4]
And this upregulation of miRNA-16 is involved in p38 MAPK signaling pathway.
[score:4]
The mechanism of upregulation of miRNA-16 via p38 MAPK pathway may be the case that VP-16 and 5-FU increased the binding of p38 MAPK to the promoter of miRNA-16 transcript.
[score:4]
Influence of p38 MAPK signaling pathway on the upregulation of miRNA-16 by VP-16 and 5-FU.
[score:4]
Therefore, we hypothesized that upregulation of miRNA-16 might be a result of increased NF-κB or MAPK activation after VP-16 or 5-FU treatment.
[score:4]
Visualization of expression change of miRNA-16 in MDR gastric cancer cells in vitro and in vivo The expression change of miRNA-16 in drug resistant gastric cancer cells was detected via the Fluc and hNIS activity by bioluminescence imaging and [131]I radioiodide uptake assays.
[score:4]
Data are shown as fold changes in NF-3xmir16/VCR relative to NF-3xmir16 cells, which are set as 1. (D) Quantitative RT-PCR detected miRNA-16 expression in NF-3xmir16 and NF-3xmir16/VCR cells.
[score:3]
So we performed only bioluminescence imaging to monitor enhanced miRNA-16 expression by VP-16 and 5-FU, but did not observe discernible difference by nuclear imaging.
[score:3]
Visualization of differential expression of miRNA-16 in MDR gastric cancer cells.
[score:3]
The dual imaging reporter gene system enabled in vivo visualization of endogenous miRNA-16 expression in gastric cancer cells.
[score:3]
MiRNA-16 was upregulated by VP-16 and 5-FU anticancer drugs.
[score:3]
Detection of endogenous miRNA-16 expression in vitro and in vivo.
[score:3]
For noninvasive monitoring of enhanced miRNA-16 expression induced by VP-16 and 5-FU, NF-empty and NF-3xmir16 cells were grafted onto the left and right hindlimb of each mouse (n = 6), respectively.
[score:3]
Monitoring of exogenous and endogenous miRNA-16 expression in vitro and in vivo.
[score:3]
In conclusion, we developed a dual reporter imaging system to visualize the differential expression of miRNA-16 exposure to various anticancer drugs.
[score:3]
To detect the endogenous miRNA-16 expression level in gastric cancer cells in vitro, equal numbers (1×10 [6]) of NF-empty and NF-3xmir16 cells were seeded and then the Fluc and hNIS activity were examined.
[score:3]
For noninvasive quantitative monitoring of miRNA-16 differential expression in MDR gastric cancer cells in vivo, bioluminescent imaging and [99m]Tc-pertechnetate gamma camera imaging were performed.
[score:3]
In contrast to NF-empty tumors, which showed prominent uptake of [99m]Tc-pertechnetate, NF-3xmir16 tumors showed negligible uptake (Figure 2H), indicating endogenous miRNA-16 reduced the hNIS expression.
[score:3]
In vivo monitoring of enhanced miRNA-16 expression by VP-16 and 5-FU.
[score:3]
To exclude the latter possibility, the five drugs were added to NF-empty cells, which contain no miRNA-16 target sites in the construct.
[score:3]
To monitor the kinetic expression of miRNA-16 during chemoresistance in gastric cancer cells, we introduced a dual reporter gene imaging system that enabled us to noninvasively visualize miRNA-16 by combining bioluminescence imaging and [99m]Tc-pertechnetate gamma camera imaging.
[score:3]
Validation of miRNA-16 activities via the reporter gene systemIn order to test whether NF-3xmir16 reporter vector containing miRNA-16 target sequences was repressed by exogenous miRNA-16, we examined the Fluc and hNIS activity after introducing miRNA-16.
[score:3]
In addition, using this reporter gene system, we found that two anticancer drugs, VP-16 and 5-FU, could increase the expression level of miRNA-16 both in vitro and in vivo.
[score:3]
Three copies of complementary sequences against miRNA-16 (3xmir16 targets) were inserted after the hNIS/Fluc fusion gene to obtain NF-3xmir16 construct (bottom).
[score:3]
Both Fluc activity (Figure 3A and 3B) and hNIS activity (Figure 3C) increased by about 1.5 fold in NF-3xmir16/VCR cells as compared with that in NF-3xmir16 cells, which suggested that miRNA-16 was downregulated in NF-3xmir16/VCR cells.
[score:3]
Increased miRNA-16 expressions by VP-16 and 5-FU are involved in p38 MAPK but NF-κB signaling pathway.
[score:3]
In order to test whether NF-3xmir16 reporter vector containing miRNA-16 target sequences was repressed by exogenous miRNA-16, we examined the Fluc and hNIS activity after introducing miRNA-16.
[score:3]
0061792.g002 Figure 2Monitoring of exogenous and endogenous miRNA-16 expression in vitro and in vivo.
[score:3]
Bioluminescence imaging of enhanced miRNA-16 expression by VP-16 and 5-FU in nude mice.
[score:3]
To verify the results obtained by reporter gene system, quantitative RT-PCR (Q-PCR) was carried out to analysis the differential expression of miRNA-16 in these two cell lines.
[score:3]
In our previous study, it was reported that two miRNAs, miRNA-15b and miRNA-16, were differentially expressed in a multidrug-resistant human gastric cancer cell line SGC7901/VCR and its parental cell line SGC7901 [11].
[score:3]
Visualization of expression change of miRNA-16 in MDR gastric cancer cells in vitro and in vivo.
[score:3]
The lack of repression of Fluc or hNIS activities observed in NF-empty cells is in respect that there were no miRNA-16 target sites in NF-empty construct.
[score:3]
Triplicate assays were performed for each RNA sample and the relative expression of miRNA-16 was normalized to U6 snRNA.
[score:2]
The expression change of miRNA-16 in drug resistant gastric cancer cells was detected via the Fluc and hNIS activity by bioluminescence imaging and [131]I radioiodide uptake assays.
[score:2]
To determine whether other anticancer drugs could alter miRNA-16 expression profile, five clinical drugs for gastric cancer were added to NF-3xmir16 cells followed by in vitro bioluminescence imaging and [131]I radioiodide uptake assays.
[score:2]
And the hNIS activity from NF-3xmir16 cells was also reduced by about 40% in response to endogenous miRNA-16 in contrast to that from NF-empty cells (Figure 2F).
[score:1]
To test whether Bcl-2 is involved in the VP-16 and 5-FU stimulation of miRNA-16 via p38 MAPK pathway, we determined Bcl-2 protein level by western blot analysis.
[score:1]
To evaluate the functional expression of Fluc in reporter gene system, NF-3xmir16 cells were seeded in at 1×10 [5] cells per well in a 24-well plate the day before transfection, then miRNA-16 and NC oligos were transfected.
[score:1]
These data indicated that the NF-3xmir16 reporter construct could be modulated by miRNA-16.
[score:1]
The results showed they had the same weights, indicated that the differences in signal intensity are indeed due to endogenous miRNA-16 function but not cell numbers.
[score:1]
To elucidate the role of these signaling pathways in VP-16 and 5-FU -induced transactivation of miRNA-16, we first measured the luminescence intensity in NF-3xmir16 cells in response to VP-16 and 5-FU in the presence or absence of pharmacological inhibitors to NF-κB or p38 MAPK.
[score:1]
However, to date we could not find any report providing insight into the details of the role of p38 MAPK pathway in VP-16 and 5-FU -induced miRNA-16 activation.
[score:1]
To evaluate the functional expression of hNIS in reporter gene system, NF-3xmir16 cells were seeded in at 1×10 [5] cells per well in a 24-well plate the day before transfection, then miRNA-16 and NC oligos were transfected.
[score:1]
The miRNA-16 and negative control (NC) RNA oligos were synthesized (Shanghai GenePharma, China) by using the following sequences: miRNA-16 sense: 5′-UAGCAGCACGUAAAUAUUGGCG-3′ miRNA-16 anti-sense: 5′-CGCCAAUAUUUACGU-GCUGCUA-3′ NC sense: 5′-UUGUACUACACAAAAGUACUG-3′ NC anti-sense: 5′-CAGUACUUUUGUGUAGUACAA-3′ Before transfection, SGCC7901 cells were seeded at 1×10 [5] cells per well in a 24-well plate and grow for 24 h. Transfection was performed with Lipofectamine 2000 reagent (Invitrogen) according to the manufacturer's protocol.
[score:1]
The relative amount of miRNA-16 was normalized to U6 snRNA.
[score:1]
Validation of miRNA-16 activities via the reporter gene system.
[score:1]
The present study was to introduce a noninvasive method for monitoring miRNA-16 in the chemoresistance of gastric cancer through a dual imaging reporter gene system in which human sodium iodide symporter (hNIS) and firefly luciferase (Fluc) genes were linked to a fusion gene for bioluminescence imaging and [99m]Tc-pertechnetate gamma camera imaging in vivo.
[score:1]
The miRNA-16 and negative control (NC) RNA oligos were synthesized (Shanghai GenePharma, China) by using the following sequences:miRNA-16 sense: 5′-UAGCAGCACGUAAAUAUUGGCG-3′ miRNA-16 anti-sense: 5′-CGCCAAUAUUUACGU-GCUGCUA-3′ NC sense: 5′-UUGUACUACACAAAAGUACUG-3′ NC anti-sense: 5′-CAGUACUUUUGUGUAGUACAA-3′ Before transfection, SGCC7901 cells were seeded at 1×10 [5] cells per well in a 24-well plate and grow for 24 h. Transfection was performed with Lipofectamine 2000 reagent (Invitrogen) according to the manufacturer's protocol.
[score:1]
And the [131]I radioiodide uptake in miRNA-16 transfected cells was approximately 70% of that in NC transfected cells quantified by radioactive counting (Figure 2C).
[score:1]
To verify that miRNA-16 activation participated into anticancer effects from VP-16 and 5-FU, Q-PCR were performed to determine the miRNA-16 level in NF-3xmir16 cells exposure to anticancer drugs treatments.
[score:1]
Three copies of complementary sequences against miRNA-16 (3xmir16) were inserted after the stop codon of the hNIS/Fluc fusion gene to generate GV260-hNIS/Fluc-3xmir16 (Figure 1A).
[score:1]
Data are shown as fold changes in miRNA-16 transfected cells relative to NC transfected cells, which is set as 1. (D, E) In vitro bioluminescence imaging of NF-empty and NF-3xmir16 cells with equal numbers (1×10 [6]).
[score:1]
Then three copies of complementary sequences against miRNA-16 (3xmir16) were inserted after the stop codon of the hNIS/Fluc fusion gene to generate another construct (GV260-hNIS/Fluc-3xmir16, referred to NF-3xmir16) (Figure 1A).
[score:1]
[1 to 20 of 64 sentences]
|
11 |
![]()
We also found that over -expression of miR-16 could down-regulate COX-2 expression in bladder cancer cells (Figure 6B).
[score:8]
Here, we found that up-regulation of miR-16 expression was associated with ART inhibition of tumor growth (Figure 2 and Figure 4B).
[score:8]
In the present study, we found that ART inhibited the COX-2 expression of bladder cancer cells and PGE2 production in a dose -dependent manner, which could be restored by miR-16 inhibitor (Figure 6C).
[score:7]
According to these results, we draw a conclusion that ART suppresses COX-2 expression and PGE2 production by enhancing miR-16 expression (Figure 8).
[score:7]
In agreement with this hypothesis, down-regulation of miR-16 expression could reverse the effect of ART on apoptosis of bladder cancer cells.
[score:6]
Next, we explored the role of miR-16 in the effect of ART on the regulation of COX-2 expression; ART was added to cells after transfection with the miR-16 inhibitor.
[score:6]
In addition, the expression of miR-16 was found to be down-regulated in bladder cancer cells in comparison with normal urothelial cells (Figure 4).
[score:6]
These findings suggest that up-regulation of miR-16 may be a therapeutic target for ART to treat bladder cancer.
[score:6]
Jiang et al. demonstrated that miR-16 expression was significantly decreased in bladder cancer tissues compared with adjacent noncancerous bladder tissues, and that over -expression of miR-16 inhibited proliferation of bladder cancer cell lines [8].
[score:6]
miR-16 was over-expressed or by knocked down transfection with miR-16 mimic or miR-16 inhibitor.
[score:6]
Our data support the hypothesis that ART stimulates miR-16 expression, leading to the reduction of COX-2 expression levels, which resulted in a decrease of PGE2 production.
[score:5]
Our data demonstrates the finding that miR-16 inhibits COX-2 expression leading to ART -induced apoptosis of bladder cancer cells.
[score:5]
To identify whether ART could affect miR-16 expression levels in bladder cancer cells, we performed real-time PCR to detect levels of miR-16 expression.
[score:5]
As shown in Figure 6, miR-16 inhibitor could increase COX-2 expression and PGE2 levels in bladder cancer treated with ART.
[score:5]
As shown in Figure 4C, the miR-16 inhibitor can significantly decrease the expression of miR-16 in T24 and RT4 cells.
[score:5]
Young L. E. Moore A. E. Sokol L. Meisner-Kober N. Dixon D. A. The mRNA stability factor HuR inhibits microRNA-16 targeting of COX-2 Mol.
[score:5]
Young et al. reported that miR-16 could bind the COX-2 3'-UTR and inhibit COX-2 expression in colorectal cancer cells [28].
[score:5]
Figure 4Down-regulation of miR-16 can reverse the effect of ART on apoptosis of bladder cancer cells.
[score:4]
Down-Regulation of miR-16 Can Reverse the Effect of ART on Apoptosis of Bladder Cancer Cells.
[score:4]
2.1.6. miR-16 Is Involved in ART Regulation of COX-2 Expression in Bladder Cancer Cells.
[score:4]
The tumor suppressor function of miR-16 has been addressed both in vivo and in vitro [27].
[score:3]
Previous studies have demonstrated that miR-16 could bind to the 3'-UTR region of cyclooxygenase-2 (COX-2) leading to apoptosis and growth inhibition of human hepatoma cell lines [7].
[score:3]
ART Significantly Increased miR-16 and Decreased Cyclooxygenase-2 (COX-2) Expression in Tumors.
[score:3]
The result of real-time PCR revealed that miR-16 mimic could significantly increase the expression of miR-16 in T24 and RT4 cells (Figure 6A).
[score:3]
Furthermore, miR-16 mimic decreased the expression of COX-2 and the concentration of PGE2 as shown in Figure 6B,C.
[score:3]
ART treatment significantly increased the expression of miR-16 in T24 and RT4 cells but did not change that in SV-HUC-1 cells (Figure 4B).
[score:3]
This is in line with the finding that increased miR-16 levels correlated with decreased expression of COX-2 in bladder cancer cells.
[score:3]
In order to assess the role of miR-16 in the effect of ART on apoptosis of bladder cancer cells, we added ART on cells after transfection with a miR-16 inhibitor.
[score:3]
miR-16 mimics (5'-UAGCAGCACGUAAAUAUUGGCG-3'), miR-16 inhibitor (5'-CCAGUAUUAACUGUGCUGCUGA-3') and negative control (NC, 5'-CAGUACUUUUGUGUAGUACAA-3') were synthesized by RIBOBIO (Ribobio Co.
[score:3]
T24 and RT4 cells were transfected with miR-16 inhibitor or mimic using Lipofectamine 2000 reagent according to the manufacturer’s recommendations.
[score:3]
As a result, miR-16 is a promising target for treatment of cancer.
[score:3]
The level of miR-16 was detected in T24 and RT4 cells transfected with miR-16 mimic for 24 h. * p < 0.05, compared to negative control (A); COX-2 protein expression (B) in T24 and RT4 cells and PGE2 levels (C) in the supernatants of T24 and RT4 cells transfected with miR-16 mimic for 24 h. * p < 0.05, compared to negative control; After transfection with miR-16 inhibitor for 24 h, T24 and RT4 cells were added with ART for an additional 24 h, and then COX-2 mRNA and protein level was measured (D, E); After transfected with miR-16 inhibitor for 24 h, T24 and RT4 cells were added with ART for an additional 24 h, and then PGE2 levels in the supernatants were determined (F).
[score:3]
Among these microRNAs, miR-16 could act as tumor suppressors in different human tumors [6].
[score:3]
Figure 2ART significantly increased miR-16 and decreased COX-2 expression in tumors.
[score:3]
Interestingly, ART alone can increase the caspase-3 level, but miR-16 inhibitor with ART causes a decrease in the caspase-3 level (Figure 4D).
[score:3]
Therefore, miR-16 could be a novel therapeutic target for the treatment of bladder cancer.
[score:3]
We first investigated whether miR-16 could regulate COX-2 expression and transfected miR-16 mimic into T24 and RT4 cells.
[score:2]
It has been demonstrated that miR-16 could regulate proliferation and apoptosis in many types of cancers including bladder cancer [26].
[score:2]
We have established miR-16 was involved in ART mediating cytotoxicity and apoptosis of bladder cancer cells.
[score:1]
To explore the molecular mechanism of ART inhibition of tumor growth, we measured the level of miR-16 and COX-2 in the N-butyl- N-(4-hydroxybutyl) nitrosamine (BBN) -induced tumor tissue.
[score:1]
The miR-16 level was quantified by real-time PCR using TransStart™ SYBR Green qPCR Supermix (TransGen Biotech, Beijing, China), and with U6 small nuclear RNA as an internal normalized reference.
[score:1]
As shown in Figure 4A, the level of miR-16 was lower in bladder cancer cells (T24 and RT4 cells) than that in normal human urothelial cells (SV-HUC-1 cells).
[score:1]
Aqeilan R. I. Calin G. A. Croce C. M. miR-15a and miR-16-1 in cancer: Discovery, function and future perspectives Cell.
[score:1]
[1 to 20 of 43 sentences]
|
12 |
![]()
Other miRNAs from this paper: hsa-let-7a-1, hsa-let-7a-2, hsa-let-7a-3, hsa-let-7b, hsa-let-7c, hsa-let-7d, hsa-let-7e, hsa-let-7f-1, hsa-let-7f-2, hsa-mir-15a, hsa-mir-16-2, hsa-mir-221, hsa-mir-222, hsa-let-7g, hsa-let-7i, hsa-mir-15b, hsa-mir-122, hsa-mir-328, hsa-mir-151a, hsa-mir-151b
To assess whether ARHGDIA is the direct functional mediator of miR-151-5p/miR-16 -induced glioma cell migration and invasion, we designed the co-knockdown rescue experiments shown in Supplementary Figure 2. analysis and transwell assays demonstrated that both the protein level of ARHGDIA and the number of migrating cells after the co-transfection of ARHGDIA siRNA and miR-151-5p/miR-16 inhibitors (anti-miR-151-5p/anti-miR-16) were closer to that of the control level than after individual transfection of miR-151-5p/miR-16 inhibitors Knockdown of ARHGDIA rescued the inhibitory effects of miR-151-5p/miR-16 inhibitors on glioma cell migration.
[score:11]
In addition, inactivating mutations in the CU-rich patches ① and ③ target sites in ARHGDIA-3′UTR-A of PCBP2 also resulted in a loss of the miR-151-5p and miR-16 suppression effect on ARHGDIA-Luc luciferase activity, although the mutation in the CU-rich patches ③ did not suppress the function of miR-16 (Figure 6E).
[score:9]
Together, these results first indicate that both PCBP2 and miR-151-5p/miR-16 inhibit ARHGDIA expression post-transcriptionally through sites in the ARHGDIA-3′UTR, and second, that efficient suppression of ARHGDIA expression by miR-151-5p/miR-16 requires PCBP2.
[score:9]
In conclusion, our results provide evidence in support of a mo del in which the high expression of PCBP2 and its binding to ARHGDIA may induce a local change in RNA structure that favors association with miR-151-5p and miR-16, thus leading to suppression of ARHGDIA expression, and the low expression or loss of ARHGDIA induces EMT and promotes glioma migration and invasion (Figure 6G).
[score:9]
Yang et al. have shown that miRNA-16 inhibits glioma cell growth and invasion through suppression of BCL2 and the nuclear factor-κB1/MMP9 signaling pathway or possibly through one of the putative target genes, Zyxin [38- 40].
[score:7]
Furthermore, we demonstrated that ARHGDIA is a potential target of miR-151-5p and miR-16 in gliomas, and PCBP2 binding of the ARHGDIA-3′UTR induces a local change in RNA structure that favors association with miR-151-5p/miR-16, efficiently suppressing ARHGDIA expression, which may strongly affect tumor growth, migration, and invasion.
[score:7]
ARHGDIA is a target mRNA of PCBP2 and is also a target of miR-151-5p/miR-16 in gliomas.
[score:5]
Our results revealed that RBP PCBP2 binds to the ARHGDIA-3′UTR, thus inducing a local change in RNA structure that favors association with miR-151-5p/miR-16 and efficiently suppressing ARHGDIA expression.
[score:5]
Real-time PCR analysis of miR-151-5p/miR-16 levels after transfection with synthetic NC mimics and miR-151-5p/miR-16 mimics (middle), synthetic NC inhibitor and miR-151-5p/miR-16 inhibitor (right) in T98G cells, respectively.
[score:5]
Both PCBP2 and miR-151-5p/miR-16 inhibited ARHGDIA expression.
[score:5]
We sought to elucidate the interaction between PCBP2 and miR-151-5p/miR-16 in promoting the motility and invasiveness of glioma cells through downregulating ARHGDIA.
[score:4]
Database searches using programs were performed with the 3′UTR of ARHGDIA, and a putative miR-16 binding site, which is highly conserved among mammals, was predicted by different algorithms; additionally, miR-151-5p has been reported to directly target the 3′UTR of ARHGDIA [7].
[score:4]
In addition, inactivating mutations in the miR-151-5p and miR-16 target sites did not decrease the relative luciferase activities as sharply as they did in wild-type counterparts (Figure 4H).
[score:4]
After knockdown of PCBP2 with siRNA, the miR-151-5p and miR-16 suppression of ARHGDIA was compromised (Figure 6B).
[score:4]
These changes permit more efficient specific binding of miR-151-5p/miR-16 to their target sites on the ARHGDIA-3′UTR.
[score:3]
Our results showed that increased miR-151-5p and miR-16 expression enhanced Rac1, Cdc42 and RhoA activation.
[score:3]
The following day, 30-100 ng of the ARHGDIA promoter reporter plasmid (WT or MT) along with 5 pmol of NC (negative control), miR-151-5p or miR-16, and 200 ng of the internal control plasmid constitutively expressing Renilla luciferase was co -transfected using Lipofectamine 2000 (Invitrogen).
[score:3]
Musumeci et al. have found a molecular circuitry in which miR-15 and miR-16 and their correlated targets cooperate to promote tumor expansion and invasiveness through the concurrent activity on stromal and cancer cells [41- 43].
[score:3]
These findings indicated that ARHGDIA is indeed a functional target for miR-151-5p/miR-16, similarly to PCBP2 (Supplementary Figure 3).
[score:3]
Our results demonstrated that exogenous expression of miR-151-5p and miR-16 promotes both migration and invasion of glioma cells.
[score:3]
Interestingly, the ARHGDIA-3′UTR-A harbors two evolutionarily conserved PCBP2 recognition elements (the CU-rich patches ① and ③), which have been shown to specifically interact with PCBP2 and are located close to the miR-151-5p and miR-16 target sites (Figure 4C).
[score:3]
Using the secondary structure prediction software RNAfold (Vienna RNA package version 1.8.3), we noticed that the CU-rich patches and the miR-151-5p and miR-16 target sites could form a stem-loop structure with a high base-pair probability (Figure 6F).
[score:3]
The results demonstrated that exogenous expression of miR-151-5p and miR-16 promote both migration and invasion of glioma cells (Supplementary Figure 2C-2H).
[score:3]
The fact that PCBP2 knockdown abolished miR-151-5p/miR-16 function, but the loss of its binding sites on the ARHGDIA-3′UTR did not, suggests that PCBP2 -induced changes in mRNA structure are involved in regulating miR-151-5p/miR-16 function.
[score:3]
We demonstrated that ARHGDIA is a potential target of miR-151-5p and miR-16 in gliomas.
[score:3]
To explore the function of miR-151-5p/miR-16 in gliomas, we first examined the expression of miR-151-5p/miR-16 in the 72 glioma tissues compared with 6 control brain tissues.
[score:2]
Given that both PCBP2 and miR-151/miR-16 target ARHGDIA, which is known to be the negative regulator of Rho GTPases such as Rac1, Cdc42 and Rho, we measured the activities of Rac1, Cdc42 and Rho in T98G cells.
[score:2]
PCBP2 facilitates the function of miR-151-5p and miR-16 on ARHGDIA.
[score:1]
To examine the function of miR-151-5p/miR-16 on ARHGDIA in PCBP2 knockout cell lines, we used the shNT-U87 MG and shPCBP2-U87 MG stably transfected cell lines as previously reported [16] to repeat the luciferase assays.
[score:1]
However, the studies of miR-16 in gliomas or cancer invasion are contradictory.
[score:1]
The nucleotide sequence of ARHGDIA-3′UTR-A from +801 to +1440 is shown as a schematic diagram in Figure 4C, and the four PCBP2 potential binding sites with CU-rich patches and the positions of the binding sites for miR-151-5p and miR-16 are marked, respectively in red, yellow and green.
[score:1]
PCBP2 facilitates the binding of miR-151-5p and miR-16 on ARHGDIA.
[score:1]
Our results also provide evidence supporting a mo del in which high-grade malignant gliomas, with increased PCBP2 levels, bind the ARHGDIA-3′UTR as well as miR-151-5p/miR-16, thereby inducing a conformational change in the ARHGDIA-3′UTR (Figure 6F).
[score:1]
F. Schematic representation of the conformation of a region of the ARHGDIA-3′UTR-A (+801 to +1440) containing 4 CU-rich patches (including patch ① and ③), a miR-151-5p and a miR-16 binding site, as predicted by RNAfold software, are marked, respectively, in red, orange and green.
[score:1]
miR-151-5p/miR-16 and PCBP2 interacted with the wild-type ARHGDIA-3′UTR.
[score:1]
F. Luciferase reporter plasmids containing wild-type ARHGDIA-3′UTR were co -transfected with synthetic NC and miR-151-5p/miR-16 mimics, as well as NC plasmid and oePCBP2 in T98G cells.
[score:1]
The 4 CU-rich patches of potential binding sites for PCBP2 and the positions of the binding sites for miR-151-5p and miR-16 are marked, respectively, in red, orange and green.
[score:1]
I. The activities and protein levels of Rac1, Cdc42, and RhoA GTPases and total Rho protein in T98G cells were determined after transfection with NC mimics, miR-151-5p/miR-16 mimics, and PCBP2 siRNA.
[score:1]
miR-151-5p and miR-16 promote glioma cell migration and invasion.
[score:1]
PCBP2 facilitates the action of miR-151-5p and miR-16 on ARHGDIA through specific mechanisms.
[score:1]
[1 to 20 of 40 sentences]
|
13 |
![]()
Other miRNAs from this paper: hsa-mir-15a, hsa-mir-21, hsa-mir-93, hsa-mir-16-2, hsa-mir-200b, hsa-mir-15b, hsa-mir-132, hsa-mir-146a, hsa-mir-200c, hsa-mir-200a, hsa-mir-146b
The expression of miR-15b and miR-16 was identified in human umbilical vein endothelial cells (HUVEC), with overexpression of miR-15b or miR-16 playing a role in the inhibition of angiogenesis [16, 17].
[score:7]
In addition to miR-15b and miR-16, other work has shown that miR-200b was downregulated in a high-glucose condition and played a role on glucose -induced VEGF upregulation in HUVEC [40].
[score:7]
miR-15b and miR-16 are predicted to target a number of molecules, including downstream protein involved in insulin signaling (targetscan.
[score:5]
It is possible that other potential groups of microRNAs, which target IR (Tyr960) and IRS-1 [Ser307], counteracted the effects of miR-15b and miR-16 on the inhibition of insulin signaling in REC cultured in hyperglycemia.
[score:5]
The purpose of our study was to test the hypothesis that miR-15b and miR-16 are altered by hyperglycemia in retinal endothelial cells (REC), and that miR-15b/16 play key roles in regulating insulin signaling through a reduction in TNFα- and suppressor of cytokine signaling 3 (SOCS3) -mediated insulin resistance pathways.
[score:4]
Overexpression of microRNA (miR)-15b and miR-16 increased the levels of Akt phosphorylation, which was reduced in the control HG condition.
[score:3]
[#] P < 0.05 versus NG, * P < 0.05 versus HG, N = 4; data are mean ± S. E. M. miR-15b and miR-16 increase the phosphorylation of IR [Tyr1150/1151]We previously reported that the increase of SOCS3 and TNFα, in hyperglycemia, is associated with increased levels of IRS-1 [Ser307] phosphorylation and decreased phosphorylation of IR [Tyr1150/1151], leading to inhibition of normal insulin signaling [22, 26].
[score:3]
The levels of miR-15b and miR-16 expression are reduced in REC cultured in high-glucose conditions.
[score:3]
This outcome suggests that both miR-15b and miR-16 are potential therapeutic targets for rescuing diabetic retina.
[score:3]
Overexpression of miR-15b and/or miR-16 reduced TNFα and SOCS3 levels, while increasing insulin-like growth factor binding protein-3 (IGFBP-3) levels and the phosphorylation of insulin receptor (IR) [Tyr1150/1151] in REC cultured in hyperglycemia.
[score:3]
In the present study, we found that the levels of IR [Tyr960] in hyperglycemia were not affected by miR-15b and miR-16 overexpression (Figure 3B).
[score:3]
The miR-16 expression was increased by 54- and 27-fold, following transfection with miR-16 and miR-15b + 16 mimics.
[score:3]
The results indicate that the insulin receptor is one of the target pathways affected by miR-15b and miR-16 in REC, and elevated levels of the microRNAs protect REC in hyperglycemia.
[score:3]
Taken together, these results demonstrate that miR-15b and miR-16 play a role in the inhibition of insulin resistance via reduced TNFα and SOCS3 signaling and increased IGFBP-3 levels, resulting in REC protection from hyperglycemia -induced apoptosis.
[score:3]
Therefore, we studied whether the increased expression of miR-15b and miR-16 could increase the phosphorylation of Akt in REC.
[score:3]
A group of miRNAs, including miR-15b, miR-16, miR-21, miR-93, miR-132, miR-146, and miR-200, have been identified as having altered expression in diabetic retinopathy [13- 15].
[score:3]
This outcome suggests that both miR-15b and miR-16 are potential therapeutic targets for therapeutics for the diabetic retina.
[score:3]
We demonstrated that REC overexpressing miR-15b and miR-16 were protected from hyperglycemia -induced apoptosis, showing increased levels of Akt phosphorylation with decreased cleaved caspase 3. Therefore, we provide a novel finding that miR-15b and miR-16 play a role in preventing insulin resistance in REC cultured in high glucose, via reduced activation of TNFα and SOCS3 pathways and increased IGFBP-3 levels.
[score:3]
Another work has reported increased miR-15b and miR-16 expression in rat retinal endothelial cells (REC) of streptozotocin (STZ) -induced diabetic rats [14].
[score:3]
Overexpression of miR-16 alone slightly reduced SOCS3 levels, although the change was not significantly different.
[score:3]
Figure 1 Decrease of miR-15b and miR-16 expression in hyperglycemia and transfection -induced fold changes.
[score:3]
However, little is known about the expression of miR-15b and miR-16 in human REC and its potential role in the downstream cellular signaling associated with the pathogenesis of diabetic retinopathy.
[score:3]
The results may indicate that miR-15b and miR-16 work in REC by activating other downstream molecules through TNFα and SOCS3 signaling, rather than targeting IRS-1 or IR [Tyr960].
[score:3]
These results suggest that miR-15b and miR-16 can protect REC from apoptosis in hyperglycemia by activating the Akt survival pathway leading to reduced cleaved caspase 3. We examined changes in miR-15b and miR-16 expression in REC after exposure to hyperglycemia.
[score:3]
Our results demonstrated that the expression levels of miR-15b and miR-16 were reduced in hyperglycemia.
[score:3]
ELISA results showed that overexpression of miR-16 and miR-15b/16 significantly reduced the level of cleaved caspase 3 in hyperglycemia (Figure 5B).
[score:3]
REC were transfected with mimics, miR-15b, miR-16, or miR15b + 16, at a final concentration of 30 nM for 48 h. Significant increases of the miRNA expression were confirmed by quantitative real-time PCR (Table 1 and Figure 1B, C).
[score:3]
We examined changes in miR-15b and miR-16 expression in REC after exposure to hyperglycemia.
[score:3]
Data are presented as mean ± S. E. M. We demonstrated that the expression of miR-15b and miR-16 was reduced in human REC cultured in hyperglycemia.
[score:3]
Since miR-15b and miR-16 target many genes, including downstream molecules of insulin signaling, it is probable that signaling pathways, other than insulin signaling, are activated to maintain normal cell signaling in transfected REC in response to hyperglycemia.
[score:3]
These, in turn, led to an increase of Akt phosphorylation and decreased cleavage of caspase 3. miR-15b and miR-16 play a role in the inhibition of insulin resistance via reduced TNFα and SOCS3 signaling and increased IGFBP-3 levels, resulting in REC protection from hyperglycemia -induced apoptosis.
[score:3]
REC were transfected with mimics (30 nM of final concentration) of miR-15b and/or miR-16 to increase the level of expression in a hyperglycemic condition.
[score:3]
Moreover, we found that miR-15b and miR-16 increased the levels of IGFBP-3, whose expression was decreased in hyperglycemia.
[score:3]
In the present study, we tested the hypothesis that miR-15b and miR-16 levels are altered by exposure to hyperglycemia in REC, and that miR-15b/16 play key roles in regulating insulin signaling through a reduction in TNFα- and SOCS3 -mediated insulin resistance pathways.
[score:2]
After 3 days of retinal endothelial cell (REC) culture in a high-glucose (25 mM) medium, the expression of both miR-15b and miR-16 was reduced (0.6- and 0.2-fold change, respectively) compared to that of the normal-glucose (NG; 5 mM) group.
[score:2]
In the present study, we demonstrated that an increased level of miR-15b and/or miR-16 in REC resulted in decreased signaling of TNFα and SOCS3, indicating the role of the microRNAs as regulators of these cytokine pathways in response to hyperglycemia.
[score:2]
A final concentration of 30 nM was used when transfected separately (miR-15b and miR-16) and 15 nM was used in combination (miR-15b + miR-16).
[score:1]
REC were transfected with miRNA mimics (hsa-miR-15b-5p and hsa-miR-16-5p) 48 h before cell harvest.
[score:1]
[#] P < 0.05 versus NG, * P < 0.05 versus HG, N = 4; data are mean ± S. E. M. We also examined whether increased levels of miR-15b and miR-16 could decrease the cleavage caspase 3 of REC in a hyperglycemic condition.
[score:1]
miR-15b and miR-16 increase Akt phosphorylation and decrease apoptosis in hyperglycemia.
[score:1]
This may indicate that miR-15b and miR-16 play a role in activating other downstream pathways via SOCS3.
[score:1]
Our goal was to determine whether miRNA-15b and miRNA-16 are involved in insulin signaling.
[score:1]
We demonstrated that hyperglycemia reduced Akt phosphorylation, which was increased when miR-15b and miR-16 mimics were used to activate these specific miRNA (Figure 5A).
[score:1]
[#] P < 0.05 versus NG, * P < 0.05 versus HG, N = 4; data are mean ± S. E. M. We also examined whether increased levels of miR-15b and miR-16 could decrease the cleavage caspase 3 of REC in a hyperglycemic condition.
[score:1]
REC were transfected with miRNA mimics (hsa-miR-15b-5p and hsa-miR-16-5p) (Invitrogen, Carlsbad, CA) using Oligofectamine (Invitrogen) following manufacturer instructions.
[score:1]
These results suggest that miR-15b and miR-16 can protect REC from apoptosis in hyperglycemia by activating the Akt survival pathway leading to reduced cleaved caspase 3. Microvascular modifications are one of the significant alterations in diabetic retinopathy.
[score:1]
This suggests that miR-15b and miR-16 may work in REC activating other downstream signaling via TNFα.
[score:1]
In this study, we showed that miR-15b and miR-16 increased the levels of IR [Tyr1150/1151] phosphorylation in REC cultured under hyperglycemic conditions (Figure 4A).
[score:1]
miR-15b and miR-16 increase the phosphorylation of IR [Tyr1150/1151].
[score:1]
Figure 5 Effects of miR-15b and miR-16 on Akt phosphorylation and cleaved caspase 3 in hyperglycemia.
[score:1]
A study reported that high glucose did not cause changes of the level of miR-16 in mouse embryos in vitro [39].
[score:1]
In this study, we provide evidence that miR-15b and miR-16 may function in insulin signal transduction to protect REC during hyperglycemia, through increased IR [Tyr1150/1151] phosphorylation.
[score:1]
Significantly decreased levels of miR-15b and miR-16, 0.6- and 0.2-fold change, respectively, were confirmed by quantitative real-time PCR.
[score:1]
Our preliminary data and literature indicated potential roles of miR-15b and miR-16 in diabetic retinopathy [14, 16, 17].
[score:1]
miR-15b and miR-16 reduced SOCS3 levels in hyperglycemia.
[score:1]
Thus, we examined whether miR-15b and miR-16 alter SOCS3 levels in hyperglycemia.
[score:1]
[1 to 20 of 56 sentences]
|
14 |
![]()
Other miRNAs from this paper: hsa-mir-21, hsa-mir-93, hsa-mir-16-2, hsa-mir-182, hsa-mir-146a, hsa-mir-135b
The range of expression values differed for the miRNAs, with miR-146a and miR-182 exhibiting expression in the 0.001–3.95 amol range, while miR-16 and miR- 21 expression was 2 orders of magnitude greater with expression ranging from 3.53–434.74 amol range.
[score:9]
One hundred seven human placenta samples were analyzed for the expression of candidate miRNA previously shown to be expressed in the placenta and involved in regulating cell growth and developmental processes by targeting genes in a variety of cell growth and cell functioning pathways, specifically, miR-16, miR-21, miR-93, miR-135b, miR-146a, and miR-182.
[score:9]
We analyzed 107 primary, term, human placentas for expression of 6 miRNA reported to be expressed in the placenta and to regulate cell growth and development pathways: miR-16, miR-21, miR-93, miR-135b, miR-146a, and miR-182.
[score:7]
Since miRNA have been described as playing important roles in development and are susceptible to the environment, we sought to further characterize the expression of six candidate miRNA previously shown to be expressed in the placenta and previously reported to target genes in pathways crucial for regulating key cell processes – miR-16 [9], [14], miR-2 1 [9], [15], miR-93 [12], [13], miR-135b [11], miR-146a [9], [16], and miR-182 [10] – in a large series of human placentas for associations with fetal growth.
[score:7]
Dysregulation of miR-16 in the placenta may lead to aberrant expression of its targets and may lead to functional and developmental abnormalities in the placenta that might result in reduced infant birthweight.
[score:7]
Further analysis revealed that Q2, the moderate-low expression of miR-16 and miR-21, was especially associated with lower birthweight percentile; this is an intriguing observation possibly suggesting that the moderate-low expression of miR-16 and miR-21 associated with lower birthweight percentiles more than the extreme low expression of miR-16 and miR-21.
[score:7]
In a number of cancer cell lines, miR-16 has been shown to be involved in the induction of apoptosis by targeting BCL-2 [23] and in cell cycle regulation by targeting CDK6 [24], CDC27 [25], and CARD10 [26].
[score:6]
Although a likelihood ratio test suggested no significant multiplicative interaction between miR-16 and miR-21 (p>0.05), there was a significant trend for increased risk of being classified as SGA from having only miR-21 reduced or only miR-16 reduced in expression to having both reduced in expression (p<0.02).
[score:5]
Moreover, having both low miR-16 and low miR-21 expression in the placenta predicts a greater increase in odds for SGA than having just low miR-16 or miR-21 expression (p<0.02), suggesting an additive effect of both of these miRNA.
[score:5]
We have demonstrated the expression of key candidate miRNA in a large, population -based series of primary human placenta samples and their association with poor fetal growth, specifically identifying that reduced expression of miR-16 and miR-21 are significantly associated with growth restriction.
[score:5]
In other cell types, miR-16 has different functions, such as targeting HMGA1 and Caprin-1 [27], further suggesting that miR-16 may have cell-type function and expression [23], [27].
[score:5]
Median (amol) Range (amol) miR-16 18.64 3.53–399.50 miR-21 54.86 5.25–434.74 miR-93 4.26 0.14–118.39 miR-135b 4.72 0.13–216.92 miR-146a 0.1 0.002–3.95 miR-182 0.23 0.001–3.63 Observing that expression in the lowest quartiles of miR-16 and miR-21 was associated with reduced birthweight percentile, we more specifically examined the association between low expression (≤median vs.
[score:5]
Mechanistic research using mo del systems is needed to further elucidate the pathways regulated by miR-16 and miR-21 and to better determine the functional consequence of downregulation of miR-16 and miR-21 in the placenta.
[score:5]
These mo dels (Table 3 ) demonstrate that low miR-16 expression in the placenta predicts an odds of 4.13 for SGA (95% CI = 1.42, 12.05) compared to infants with high placenta miR-16 expression, controlled for confounders.
[score:4]
Previous work in our lab has suggested that maternal cigarette smoking during pregnancy is associated with the downregulation of miR-16, miR-21, and miR-146a in the placenta [9].
[score:4]
Furthermore, more is being uncovered about the role of miR-16 and miR-21 in regulating key cellular processes, especially the involvement of miR-16 in regulating cell cycle progression [14] and miR-21's capability of regulating cell cycling and cell proliferation [15].
[score:4]
This mo del (Table 4 ) demonstrated that compared to infants having high expression (>median) of both miRNA, infants with low miR-21 only or low miR-16 only had non-significant elevation in SGA risk, but infants exhibiting reduced expression of both miR-16 and miR-21 were significantly more likely to be classified as SGA (OR 5.38, 95% CI 1.52, 19.01).
[score:4]
In summary, our data suggesting that low expression of miR-16 and miR-21 in the placenta is associated with poor fetal growth may have many important implications.
[score:3]
Birthweight percentile significantly differed across quartiles of miR-16 and miR-21 expression, p = 0.04 and p = 0.02, respectively.
[score:3]
Logistic regression mo dels suggested that low expression of miR-16 in the placenta predicts an over 4-fold increased odds of small for gestational age (SGA) status (p = 0.009, 95% CI = 1.42, 12.05).
[score:3]
These data suggest that lower expression of miR-16 and miR-21 in placenta does associate with lower birthweight percentiles but that the moderate-low expression of these miRNA in placenta may be particularly associative with reduced birthweight; such an observation merits further investigation in the future.
[score:3]
Analysis revealed that birthweight percentile significantly differed across quartiles of miR-16 and miR-21 expression, p = 0.04 and p = 0.02, respectively.
[score:3]
The expression of miR-16 and miR-21 was markedly reduced in infants with the lowest birthweights (p<0.05).
[score:3]
Logistic regression to examine the interaction of low miR-16 and low miR-21 expression on the association with SGA status.
[score:3]
Kruskal-Wallis tests revealed that birthweight percentile significantly differed across quartiles of miR-16 and miR-21 expression (p<0.05).
[score:3]
Expression of miR-16, miR-21, miR-93, miR-135b, miR-146a, and miR-182 determined through qRT-PCR in 107 primary human term placenta samples.
[score:3]
As with many miRNA, miR-16 exhibits tissue-specific function and expression.
[score:3]
Effect Odds Ratio 95% Wald Confidence Limits miR-21 and miR-16, n (%) Both High, n = 36 (35%) ReferenceLow miR-21 only, n = 16 (16%) 1.54 0.29–8.21Low miR-16 only, n = 16 (16%) 3.35 0.69–16.32 Both Low, n = 34 (33%) 5.38 1.52–19.01 Also included in mo del: Relative Weight Gained During Pregnancy, Maternal Ethnicity, Maternal Age, Delivery Method, Insurance, and Infant Gender.
[score:1]
0021210.g001 Figure 1(A) miR-16 (p = 0.04), (B) miR-21 (p = 0.02), (C) miR-93 (p = 0.88), (D) miR-135b (p = 0.84), (E) miR-146a (p = 0.46), and (F) miR-182 (p = 0.55).
[score:1]
[1 to 20 of 29 sentences]
|
15 |
![]()
Other miRNAs from this paper: hsa-mir-15a, hsa-mir-16-2, hsa-mir-198, hsa-mir-15b, hsa-mir-149, hsa-mir-155, hsa-mir-1303
Quercetin increased miR-16 expression and an inhibitor of miR-16 rescued quercetin -induced decrease in claudin-2. Our results indicate that quercetin may decrease claudin-2 expression through increasing miR-16 expression in lung adenocarcinoma cells.
[score:9]
The expression levels of claudin-2 mRNA and protein were decreased by quercetin, which were significantly inhibited by miR-16 inhibitor (Figure 7B,C).
[score:7]
Figure 7Inhibition of quercetin -induced decrease in claudin-2 expression by miR-16 inhibitor.
[score:7]
The expression of miR-16 is down-regulated in 82% of adenocarcinomas and in six NSCLC cell lines [47].
[score:6]
The ectopic expression of miR-16 decreases hepatoma-derived growth factor, a potential oncogene, and inhibits cell growth, migration, and invasion in NSCLC cells [20], indicating that miR-16 functions as a negative regulator of cell cycle progression.
[score:6]
We need further study to clarify whether quercetin decreases claudin-2 expression mediated by the up-regulation of miR-16 using in vivo mo del system.
[score:6]
Ke Y. Zhao W. Xiong J. Cao R. Downregulation of miR-16 promotes growth and motility by targeting HDGF in non-small cell lung cancer cells FEBS Lett.
[score:6]
Quercetin increased miR-16 expression without affecting the expression levels of miR-15a, 15b, 195, 424, and 497 (Figure 7A).
[score:5]
miR-16 expression is inversely correlated with Bcl-2 expression, which induces apoptosis in leukemic cells [22].
[score:5]
miR-16 inhibits the transcriptional activity of nuclear factor-kappaB and Slug, resulting in suppression of epithelial-mesenchymal transition in human glioma [21].
[score:5]
Ectopic expression of miR-16 inhibits cell proliferation, colony formation, migration, and invasion in NSCLC cells [20].
[score:5]
Rescue of Quercetin-Induced Decrease in Claudin-2 Expression by miR-16 Inhibitor.
[score:5]
Our data indicate that quercetin decreases claudin-2 expression mediated by the elevation of miR-16 expression.
[score:5]
Bandi N. Zbinden S. Gugger M. Arnold M. Kocher V. Hasan L. Kappeler A. Brunner T. Vassella E. miR-15a and miR-16 are implicated in cell cycle regulation in a Rb -dependent manner and are frequently deleted or down-regulated in non-small cell lung cancer Cancer Res.
[score:5]
miR-16 expression is down-regulated in human non-small cell lung cancer (NSCLC) tissue samples compared with normal tissues.
[score:5]
Wang Q. Li X. Zhu Y. Yang P. MicroRNA-16 suppresses epithelial-mesenchymal transitionrelated gene expression in human glioma Mol.
[score:4]
miR-16 induces cell cycle arrest through targeting G1 cyclin, an essential regulator of G1 phase progression [48].
[score:4]
Knockdown of miR-16 rescued quercetin -induced decrease in claudin-2. These results indicate that quercetin is a physiologically active substance of foods which decreases claudin-2 expression in A549 cells.
[score:4]
Cimmino A. Calin G. A. Fabbri M. Iorio M. V. Ferracin M. Shimizu M. Wojcik S. E. Aqeilan R. I. Zupo S. Dono M. miR-15 and miR-16 induce apoptosis by targeting BCL2 Proc.
[score:3]
We suggest that quercetin prevents tumorigenesis in human lung cancer partially mediated via the elevation of miR-16 and decrease in claudin-2 expression.
[score:3]
Claudin-2 and miR-16 may be potential therapeutic targets for the treatment of adenocarcinomas.
[score:3]
Negative control or miR-16 inhibitor (anti-miR-16 specific antisense oligonucleotide) was transfected into A549 cells with Lipofectamine 2000 as recommended by the manufacturer.
[score:3]
The expression of miR-16 was increased by quercetin, but that of miR-15a, 15b.
[score:3]
Liu Q. Fu H. Sun F. Zhang H. Tie Y. Zhu J. Xing R. Sun Z. Zheng X. miR-16 family induces cell cycle arrest by regulating multiple cell cycle genes Nucleic Acids Res.
[score:2]
Furthermore, miR-16 has manifold cellular functions in other tissues.
[score:1]
[1 to 20 of 25 sentences]
|
16 |
![]()
Other miRNAs from this paper: hsa-let-7b, hsa-mir-17, hsa-mir-20a, hsa-mir-27a, hsa-mir-29a, hsa-mir-93, hsa-mir-29b-1, hsa-mir-29b-2, hsa-mir-106a, hsa-mir-107, hsa-mir-16-2, hsa-mir-210, hsa-mir-224, hsa-mir-15b, hsa-mir-125a, hsa-mir-150, hsa-mir-193a, hsa-mir-320a, hsa-mir-106b, hsa-mir-29c, hsa-mir-361, hsa-mir-302d, hsa-mir-373, hsa-mir-378a, hsa-mir-383, hsa-mir-20b, hsa-mir-320b-1, hsa-mir-320c-1, hsa-mir-320b-2, hsa-mir-378d-2, hsa-mir-320d-1, hsa-mir-320c-2, hsa-mir-320d-2, hsa-mir-378b, hsa-mir-320e, hsa-mir-378c, hsa-mir-378d-1, hsa-mir-378e, hsa-mir-378f, hsa-mir-378g, hsa-mir-378h, hsa-mir-378i, hsa-mir-378j
MiR-15b and miR-16 down-regulated uPAR, whereas Construct II up-regulated its expression.
[score:9]
The expression of COX2 was down-regulated by miR-15b, miR-16, and miR-20b, and c-MET was down-regulated by all three of these miRNAs plus miR-20a.
[score:9]
Co-regulatory effect of miR-15b, miR-16, miR-20a, and miR-20b on angiogenic factors in CNE cellsWhen under hypoxia stimulation, VEGF is not the only angiogenic gene up-regulated, as other angiogenic factors have been reported to be up-regulated as well [22], [23].
[score:8]
Furthermore, we used Construct II to compete with PTN for endogenous miR-15b and miR-16, but Construct II could not up-regulate PTN expression.
[score:6]
We also analyzed the effect of inhibiting endogenous miR-15b, miR-16, miR-20a, and miR-20b on VEGF expression.
[score:5]
Using the same transfection method, we introduced inhibitors of these miRNAs into normoxic CNE cells, which express low levels of VEGF and high levels of endogenous miR-15b, miR-16, miR-20a, and miR-20b.
[score:5]
ELISA was used to detect the change in VEGF expression levels after endogenous miR-15b, miR-16, miR-20a, and miR-20b were inhibited.
[score:5]
These data indicate that some of angiogenic factors expressed in CNE cells were specifically co-regulated by miR-15b, miR-16, miR-20a, and miR-20b.
[score:4]
miR-15b, miR-16, miR-20a, and miR-20b were down-regulated in hypoxia induced CNE cells (C).
[score:4]
Taken together, the down-regulation of miR-15b, miR-16, miR-20a, and miR-20b in CNE cells might be mediated by the accumulation of p53 or the stabilization of HIF-1α during hypoxia.
[score:4]
In contrast to miR-15b and miR-16, the down-regulation of miR-20a and miR-20b may be related to hypoxia inducible factor-1α (HIF-1α).
[score:4]
Since both miR-15b and one of two miR-16 genomic loci, miR-16-2, are located in the same cluster on chromosome 3 (the miR-15b cluster), the expression of miR-16 may be regulated by the same mechanism as that of miR-15b.
[score:4]
Among these 54 miRNAs, miR-16, miR-20a, miR-20b, let-7b, miR-17-5p, miR-27a, miR-106a, miR-106b, miR-107, miR-193a, miR-210, miR-320, and miR-361 were predicted to target VEGF.
[score:3]
Hypoxia -induced CNE cells, which expressed high levels of VEGF but lacked miR-15b, miR-16, miR-20a, and miR-20b, were transfected with synthetic miRNA duplexes of these miRNAs and a set of controls.
[score:3]
Then we transfected CNE cells with miR-15b and miR-16, and found that miR-15b and miR-16 did not have a repressive effect on PTN expression.
[score:3]
PTN is an angiogenic factor known to change during hypoxia, but is not predicted to be a target of either miR-15b or miR-16.
[score:3]
CNE cells were transfected with inhibitors of miR-15b, miR-16, miR-20a, and miR-20b.
[score:3]
The effect of miR-15b, miR-16, miR-20a, and miR-20b on VEGF expression was tested in CNE cells by transfection of the cells with siRNA duplexes homologous in sequence to the miRNAs.
[score:3]
Transfection with miR-15b, miR-16, miR-20a, and miR-20b, but not the negative controls, resulted in a 26–51% decrease in VEGF expression at the protein level 30h after transfection (Fig. 3A).
[score:3]
To investigate the putative effects of miR-15b, miR-16, miR-20a, and miR-20b, we determined the consequence of over -expressing these miRNAs on VEGF expression.
[score:3]
Computational predictions indicated that miR-20a, miR-20b, miR-17-5p, miR-106a, and miR-106b had binding sites in Construct I. With slightly relaxed criteria about free energy and conservation, miR-15b, miR-16, miR-17-5p, miR-20b, and miR-107 have computationally predicted target sites in Construct II reporters (Table 4).
[score:3]
In this investigation, we found that miR-15b, miR-16, miR-20a, and miR-20b are sharply down-regulated in CNE cells after hypoxia treatment.
[score:2]
With computational analysis, miR-15b and miR-16 were predicted to be putative regulatory miRNAs of uPAR, COX2, and c-MET, in addition to VEGF.
[score:2]
Co-regulatory effect of miR-15b, miR-16, miR-20a, and miR-20b on angiogenic factors in CNE cells.
[score:2]
To test the specificity of prediction of miRNA target sites, we first did experiments with a luciferase activity assay to test: a) the effects of miR-106a and miR-106b on Construct II; and b) the effects of miR-15b and miR-16 on Construct I. We found that all of these miRNAs showed repression of 20–27% of luciferase activity.
[score:2]
It is probable that the fragment of VEGF 3′-UTR in Construct II competed with uPAR for endogenous miR-15b and miR-16 (Fig. 6A).
[score:1]
These include one positive control, VEGF-siRNA, and four negative controls, miR-224, mutated miR-16 (miR-16M 5′-UAGCCUAACGUAAAUAUUGGCG- 3′) and miR-20a, miR-20aM 5′ -UACGUUGCUUAUAGUGCAGGUAG- 3′), and a random sequence.
[score:1]
These are miR-15b, miR-16, miR-20a, and miR-20b.
[score:1]
This was expected, as no binding site for miR-15b or miR-16 was detected by either the miRanda software, RNAhybrid, or FindTar algorithms in the 3′-UTR fragment of PTN.
[score:1]
CNE cells were induced with or without DFOM (6–1), transfected with miR-15b, miR-16, miR-20a, or miR-20b (6–2) and transfected with Construct I or Construct II (6–3).
[score:1]
The controls consist of one positive control: VEGF-siRNA (PC), and four negative controls: miR-224, mutated miR-16, and miR-20a (miR-16M, miR-20aM), and a random sequence (NC).
[score:1]
When the prediction was carried out with miRanda software, RNAhybrid, and FindTar algorithms separately, binding sites for miR-15b and miR-16 on Construct I and miR-106a and miR-106b on Construct II would be detected by one of these algorithms.
[score:1]
According to the criteria, no binding sites for miR-15b and miR-16 on Construct I and miR-106a and miR-106b on Construct II were found.
[score:1]
0000116.g006 Figure 6CNE cells were induced with or without DFOM (6–1), transfected with miR-15b, miR-16, miR-20a, or miR-20b (6–2) and transfected with Construct I or Construct II (6–3).
[score:1]
[1 to 20 of 34 sentences]
|
17 |
![]()
Other miRNAs from this paper: hsa-let-7a-1, hsa-let-7a-2, hsa-let-7a-3, hsa-let-7b, hsa-let-7c, hsa-let-7d, hsa-let-7e, hsa-let-7f-1, hsa-let-7f-2, hsa-mir-15a, hsa-mir-19a, hsa-mir-19b-1, hsa-mir-19b-2, hsa-mir-20a, hsa-mir-21, hsa-mir-106a, hsa-mir-16-2, mmu-let-7g, mmu-let-7i, mmu-mir-15b, mmu-mir-155, hsa-mir-34a, hsa-mir-221, hsa-mir-222, mmu-mir-34c, mmu-mir-34b, mmu-let-7d, mmu-mir-106a, mmu-mir-106b, hsa-let-7g, hsa-let-7i, hsa-mir-15b, mmu-mir-19b-2, mmu-let-7a-1, mmu-let-7a-2, mmu-let-7b, mmu-let-7c-1, mmu-let-7c-2, mmu-let-7e, mmu-let-7f-1, mmu-let-7f-2, mmu-mir-15a, mmu-mir-16-1, mmu-mir-16-2, mmu-mir-20a, mmu-mir-21a, mmu-mir-34a, rno-let-7d, rno-mir-20a, hsa-mir-155, mmu-mir-19a, mmu-mir-221, mmu-mir-222, mmu-mir-19b-1, hsa-mir-106b, hsa-mir-34b, hsa-mir-34c, rno-let-7a-1, rno-let-7a-2, rno-let-7b, rno-let-7c-1, rno-let-7c-2, rno-let-7e, rno-let-7f-1, rno-let-7f-2, rno-let-7i, rno-mir-15b, rno-mir-16, rno-mir-19b-1, rno-mir-19b-2, rno-mir-19a, rno-mir-21, rno-mir-34b, rno-mir-34c, rno-mir-34a, rno-mir-106b, rno-mir-221, rno-mir-222, mmu-mir-21b, mmu-let-7j, mmu-mir-21c, mmu-let-7k, rno-mir-155, rno-let-7g, rno-mir-15a
miR-16 is implicated in induction of apoptosis by targeting Bcl-2 [25], and is involved in cell cycle regulation by targeting CDK6, cell division cycle protein 27 (CDC27), the caspase recruitment domain-containing protein 10 (CARD10), cyclin D1 and cyclin E [26- 28].
[score:6]
The expression of miR-16, let-7a and miR-34a was consistently upregulated in neural differentiation mo dels.
[score:6]
In contrast, proapoptotic miRNAs are usually downregulated in cancer, and include miR-15, miR-16, the let-7 family and members of the miR-34 family.
[score:4]
Therefore, a possible role for miR-16 in the context of differentiation may be associated with cell cycle control in downregulating the proliferation potential of differentiating cells.
[score:4]
miR-16 was shown to be implicated in cell cycle regulation, as well as apoptosis induction by targeting Bcl-2 [25- 28].
[score:4]
In conclusion, the identification of miR-16, let-7a and miR-34a, whose expression patterns are conserved in mouse, rat and human neural differentiation, implicates these specific miRNAs in mammalian neuronal development.
[score:4]
Interestingly, and similar to miR-34a/b/c, miR-16 was upregulated at both 3 and 8 days of neural differentiation.
[score:4]
C) Expression of miR-16, Let-7a and miR-34a at 4 and 8 days of ES cell differentiation and in control (DMSO -treated) and LY411575 -treated rosette cultures at 8 days.
[score:3]
Indeed, miR-16 expression was markedly increased throughout mouse, rat and human neural differentiation.
[score:3]
Figure 6 Differentiation of PC12 and NT2N cells were associated with modulated levels of miR-16, let-7a and miR-34a expression.
[score:3]
A and B) miR-16, let-7a and miR-34a expression during PC12 and NT2N differentiation, respectively.
[score:3]
Nevertheless, here-to-fore unrecognized miR-16 targets may exert distinct, yet crucial functions during cell differentiation.
[score:3]
Therefore, it is possible that additional mechanisms exist to antagonize let-7a and miR-16 expression during NS cell differentiation.
[score:3]
Importantly, although highly modulated during cell differentiation, both let-7a and miR-16 were significantly expressed in neurospheres (data not shown).
[score:3]
In NT2N, miR-16 expression was increased by 3.6-fold at day 14 (p < 0.001) and almost 4-fold at day 21 (p < 0.05) of differentiation (Figure 6B).
[score:3]
Nevertheless, the onset of miR-16 expression during mouse NS cell differentiation was not associated with the appearance of any specific cell type.
[score:3]
Nevertheless, no difference in miR-16 expression levels was detected at 7 days, under different NGF treatments.
[score:3]
miR-16 and let-7a expressions in cells treated with 5 and 50 ng/ml NGF were also significantly different from NGF untreated cells at day 4 (p < 0.05) and day 2 (p < 0.01), respectively.
[score:3]
Similarly to miR-16 and let-7a, a decrease in miR-34a expression occurred from day 6 to day 8. Figure 2 Apoptosis -associated miRNAs are modulated during mouse NS cell differentiation.
[score:3]
Our results showed that the differential expression of miR-16, let-7a and miR-34a during mouse NS cell differentiation was not associated with cell death.
[score:3]
In conclusion, our results demonstrate that apoptosis -associated miRNAs are differentially expressed during neural differentiation, in the absence of cell death, and identify miR-16, let-7a and miR-34a as important players.
[score:3]
Indeed, miR-16 expression increased by 1.8- (p < 0.01) and 1.4-fold (p < 0.05) at 2 and 4 days, respectively.
[score:3]
Similarly to miR-16 and let-7a, a decrease in miR-34a expression occurred from day 6 to day 8. Figure 2 Apoptosis -associated miRNAs are modulated during mouse NS cell differentiation.
[score:3]
In fact, at this stage of differentiation, expression levels of miR-16, let-7a and miR-34a were increased when compared with day 4 (Figure 5B).
[score:2]
Expression of specific proapoptotic (miR-16, let-7a and miR-34a) and antiapoptotic miRNAs (miR-20a and miR-19a) were analyzed by quantitative Real Time-PCR from 10 ng of total RNA using specific Taqman primers and GAPDH for normalization.
[score:2]
Our results demonstrated that treatment of PC12 cells with 50 ng/ml of NGF markedly induced miR-16 expression at 2 and 4 days, compared with NGF-untreated cells (Figure 6A).
[score:2]
To further validate the role of the proapoptotic miRNAs, miR-16, let-7a and miR-34a in neural cell differentiation, we investigated whether they were upregulated in other neural differentiation mo dels, including mouse ES cells, PC12 and NT2N cell lines.
[score:2]
Surprisingly, increased differentiation after replating was associated with a significant decrease in both miR-16 and let-7a expression by ~ 2 (p < 0.05) and 5-fold (p < 0.001), while miR-34a increased by 4.5-fold (p < 0.05), compared with non-replated cells.
[score:2]
Notably, miR-16 expression levels were significantly increased from 12 hours to 3 days of differentiation, when compared with undifferentiated cells (p < 0.05) (Figure 2).
[score:2]
The involvement of miR-16 in cell differentiation has not been previously reported.
[score:1]
Notably, LY411575 -induced neurogenesis resulted in a significant increased of miR-16 and miR-34a, by 3- and 2-fold (Figure 5B), respectively (p < 0.05), supporting the potential involvement of both miRNAs in neuronal differentiation.
[score:1]
Next, we characterized the expression of proapoptotic miRNAs, including miR-16, let-7a and miR-34a in distinct mo dels of neural differentiation, including mouse embryonic stem cells, PC12 and NT2N cells.
[score:1]
Based on a possible link between miR-16, let-7a and miR-34a with known apoptotic molecules that have already been associated with differentiation, we decided to validate microarray data for the three proapoptotic miRNAs throughout mouse NS cell differentiation by quantitative real time-PCR (Figure 2).
[score:1]
In contrast to let-7a and miR-16, miR-34a was barely detected in undifferentiated cells, supporting its specific involvement in cell differentiation.
[score:1]
Nevertheless, an involvement of miR-16 in cell differentiation is virtually unknown.
[score:1]
Figure 5 miR-16, let-7a and miR-34a are increased during mouse ES cell differentiation.
[score:1]
These results strongly suggested that modulation of miR-16, let-7a and miR-34a was most likely due to cell differentiation rather than cell death.
[score:1]
[1 to 20 of 37 sentences]
|
18 |
![]()
Other miRNAs from this paper: hsa-let-7a-1, hsa-let-7a-2, hsa-let-7a-3, hsa-let-7b, hsa-let-7c, hsa-let-7d, hsa-let-7e, hsa-let-7f-1, hsa-let-7f-2, hsa-mir-21, hsa-mir-26a-1, hsa-mir-26b, hsa-mir-93, hsa-mir-103a-2, hsa-mir-103a-1, hsa-mir-16-2, hsa-mir-192, hsa-mir-10b, hsa-mir-181a-2, hsa-mir-181a-1, hsa-let-7g, hsa-let-7i, hsa-mir-15b, hsa-mir-142, hsa-mir-191, hsa-mir-126, hsa-mir-185, hsa-mir-194-1, hsa-mir-155, hsa-mir-194-2, hsa-mir-301a, hsa-mir-26a-2, hsa-mir-339, hsa-mir-345, hsa-mir-425, hsa-mir-451a, hsa-mir-484, hsa-mir-532, hsa-mir-652, hsa-mir-454, hsa-mir-103b-1, hsa-mir-103b-2, hsa-mir-451b
Therefore, as blood samples from both cancer and control patients are treated identically one would not anticipate this to have a direct effect on miR-16 expression, as evidenced by our results where they was no difference in miR-16 expression between the cancer and control groups.
[score:6]
The relative expression of three target miRNAs (miR-93, miR-181a and miR-652) is presented following normalization using each of four distinct EC strategies: U6 alone, miR-16 alone, miR-425 alone and finally miR-16 and miR-425 in combination.
[score:5]
MiR-652 is under-expressed in the circulation of women with breast cancer, regardless of the choice of candidate EC (U6, miR-425 or miR-16) indicating that it was highly differentially expressed in blood of those with breast cancer.
[score:5]
MiR-181a, which was previously shown to be under-expressed in breast cancer [25](McDermott et al., unpublished data) was under-expressed when miR-16 (p = 0.011) used as EC.
[score:5]
MiR-181a has previously been shown to be under-expressed in breast cancer, but was shown in this study to be significantly under-expressed when miR-16 alone was used as an EC.
[score:5]
Initial miRNA studies on breast tissues by Mattie et al normalized miRNA expression to miR-16 and let-7, which were later shown to be stably expressed across malignant, benign and normal breast tissue by Davoren et al [2], [8].
[score:5]
Several miRNA expression analysis studies based on tissue have reported the use of small RNAs (such as U6, RNU44 or RNU48) or miR-16 to normalize expression data [2]– [6].
[score:5]
This study advocated the use of miR-16 and miR-93, the most stably expressed candidate ECs, for normalization of miRNA expression in serum for gastric cancer.
[score:5]
This study examined the expression stability of five miRNAs (let-7a, miR-10b, miR-16, miR-21 and miR-26b) and 3 small nucleolar RNAs (RNU19, RNU48 and Z30) was determined in normal, benign and malignant breast tissue.
[score:3]
MiR-16 showed the highest expression, with mean C [T] of 15.5 (range 13.5–18.7), followed by miR-425, mean C [T] 20.7 (range 17.4–24.2) and then U6, mean C [T] 21.0 (range 19.0–22.8), see Table 4. 10.1371/journal.
[score:3]
GeNorm identified miR-16 as the single most stably expressed miRNA, with a GeNorm M value of 1.191.
[score:3]
We then used both GeNorm and NormFinder algorithms which identified miR-16 and miR-425, respectively, as the most stably expressed candidate ECs, with NormFinder suggesting their combination as the best combination.
[score:3]
MiR-16 showed the highest expression, with mean C [T] of 15.5 (range 13.5–18.7), followed by miR-425, mean C [T] 20.7 (range 17.4–24.2) and then U6, mean C [T] 21.0 (range 19.0–22.8), see Table 4. 10.1371/journal.
[score:3]
Our initial validation step using raw C [T] values of these 3 candidate ECs displayed that U6 was more abundant in the control group, while there was no difference in miR-16 or miR-425 expression between the cancer or control group.
[score:3]
Further validation by RQ-PCR confirmed that miR-16 and miR-425 were the most stably expressed ECs overall.
[score:3]
In this manner it was identified that there was no difference in expression of miR-16 or miR-425 between the cancer group and the controls, as would be expected for good candidate ECs.
[score:3]
Expression stability of the means of snoRNAS (U6, RNU44 and RNU48) and miRNAs (miR-16, miR-425, miR-142-3p, and miR-484) were assessed using GeNorm (Figure 2).
[score:3]
Combination of miR-16 and miR-425 as EC detected significant dysregulation of miR-652 (p = 0.001).
[score:2]
MiR-181a is underexpressed with mIR-16 was used to normalise RQ data (p = 0.011).
[score:2]
Recent studies have reported on the origin of circulating miR-16, indicating red blood cell hemolysis as a major source of this miRNA in blood [35], [36].
[score:1]
Song et al focused on gastric cancer, examining 6 miRNAs (let-7a, miR-16, miR-93, miR-103, miR-192, and miR-451) and one small nucleolar RNA, RNU6B for suitability as candidate ECs [29].
[score:1]
RNU48 and RNU44 are the least stable ECs while miR-425 and miR-16 are the most stable candidate ECs.
[score:1]
This study identified that the combined use of 2 miRNAs, (miR-16 and miR-425) to normalize RQ-PCR data generated more reliable results than using either miRNA alone, or use of U6.
[score:1]
The optimal combination was achieved by combining miR-16 and miR-425.
[score:1]
MiR-425 and miR-16 were the best combination, achieving the lowest V-value of 0.185.
[score:1]
There was a significant difference in variance between ECs (Bartlett's test, p<0.001) indicating their differing stabilities, with miR-16 showing the greatest variation (Figure 6).
[score:1]
The present study identified that the combined use 2 miRNAs, (miR-16 and miR-425) to normalize RQ-PCR data generated more reliable results than using either miRNA alone, or use of U6, which has been used by several authors to date.
[score:1]
MiR-16 and miR-345 were identified as the best combination of reference miRNAs by both geNorm and NormFinder, with miR-16 and miR-345 being the single best normlizers identified by NormFinder and geNorm, respectively.
[score:1]
It identifies a combination of two miRNAs, miR-16 and miR-425, with application for use as ECs for normalization.
[score:1]
MiR-16 appears to be the most wi dely used EC for blood-related miRNA studies with application to breast, ovarian, pancreatic, gastric, prostate and renal cell cancer, melanoma and the hematological malignancies [9], [14], [25], [30]– [34].
[score:1]
In addition to the candidate ECs identified by microarray profiling, the expression of 7 additional candidates, as chosen from a review of published studies, was investigated in the array dataset (miR-16, miR-425, miR-484, miR-142-3p U6, RNU44 and RNU48, Table 2).
[score:1]
Normalization with the combination of miR-16 and miR-425 increased the p-value to 0.091.
[score:1]
There was no significant difference (p>0.05, t-test) for miR-16 and miR-425.
[score:1]
MiR-16 showed greater variance than miR-425 and U6.
[score:1]
Consistent with the geNorm analysis on the microarray data miR-16 and miR-425 were identified as being the most appropriate ECs.
[score:1]
Three of these (miR-16, U6, and miR-425) were further validated in a larger cohort of blood from breast cancer patients and controls.
[score:1]
NormFinder identified miR-16 and U6 as the best combination, with a stability value of 0.102.
[score:1]
We selected miR-425 from the GME analysis, and both miR-16 and U6 from the literature for further analysis by RQ-PCR in a validation cohort (n = 60).
[score:1]
Early studies on systemic miRNAs in breast cancer normalized to miR-16 [9], [10].
[score:1]
Combination of miR-425 and miR-16 resulted in the lowest V- value of 0.185 (Figure 3).
[score:1]
The best normalization strategy for miRNA analysis in breast tissue was found to be a combination of miR-16 and let-7a.
[score:1]
Six candidate miRNAs (let-7a, miR-16, miR-26a, miR-345, miR-425 and miR-454) and 2 small nucleolar RNAs (RNU48 and Z30) were chosen for for further validation by RQ-PCR in a larger cohort of colorectal tissues.
[score:1]
[1 to 20 of 42 sentences]
|
19 |
![]()
Other miRNAs from this paper: hsa-mir-15a, hsa-mir-16-2, mmu-mir-15b, mmu-mir-128-1, hsa-mir-15b, hsa-mir-128-1, mmu-mir-15a, mmu-mir-16-1, mmu-mir-16-2, mmu-mir-128-2, hsa-mir-128-2
Figure 5 The loss of the retinoblastoma tumor suppressor (RB ) expression plays a role in Smurf2 downregulation in triple -negative breast cancer (TNBC) cells, via upregulation of miR-15, miR-16 and miR-128.
[score:11]
We also have revealed that microRNAs such as miR-15a, miR-15b, miR-16 and miR-128, whose expression is increased by inactivating mutations of the retinoblastoma (RB) gene, downregulate translation of Smurf2 protein in TNBC cells.
[score:9]
Studies using quantitative PCR and specific microRNA inhibitors indicated that increased expression of miR-15a, miR-15b, miR-16 and miR-128 was involved in Smurf2 downregulation in those triple -negative cancer cell lines, which have mutations in the retinoblastoma (RB) gene.
[score:9]
To further delineate the role of the miRNAs in Smurf2 downregulation observed in BT549, MDA-MB-436 and DU4475 cells, cells were transfected with miRNA inhibitors (antagomirs) against miR-15a, miR-15b, miR-16 or miR-128 (Figure 4).
[score:6]
Low expression of Smurf2 protein was also observed in several TNBC cell lines, which had RB mutations and high expression of miR-15a, miR-15b, miR-16 and miR-128.
[score:6]
Forced expression of GFP-RB resulted in a significant increase in cellular levels of Smurf2 protein, accompanied by substantial decreases in the expression of miR-15a, miR-15b, miR-16 and miR-128b (Figure 5C).
[score:5]
DU4475 cells showed increased expression of miR-15b, miR-16 and miR-128, relative to their expression in MCF-10A cells.
[score:5]
Whereas deletion of miR-15a and miR-16 was reported in some non-small cell lung cancers [19], miRNA expression profiling in human breast cancer subtypes showed that basal-like TNBCs expressed higher levels of miR-15b than other subtypes [20].
[score:5]
Figure 4 MicroRNAs such as miR-15, miR-16 and miR-128 are involved in downregulation of Smurf2 protein in triple -negative breast cancer.
[score:4]
A recent study demonstrated that miR-15 and miR-16 are direct targets of the E2F transcription factors [16].
[score:4]
It was previously demonstrated that miR-15 and miR-16 are direct transcriptional targets of E2F-1, and these miRNAs in turn restrict E2F activities [16, 19].
[score:4]
Figure 3 Expression levels of miR-15a, miR-15b, miR-16 and miR-128 in breast cancer cell lines.
[score:3]
Human triple -negative breast cancer cell lines, BT549, MDA-MB-436 and DU4475 cells, were transfected with microRNA inhibitors against miR-15a, miR-15b, miR-16 and miR-128, or nonspecific ssRNA as negative control (NC), and cellular levels of Smurf2 protein were determined at 24 h (A, B) or 48 h (C) post-transfection by immunoblotting.
[score:3]
Cells were transfected with Ambion® Anti-miR™ miRNA Inhibitors specifically against miR-15a, miR-15b, miR-16 and miR-128 (Ambion/Invitrogen, Carlsbad, CA), using the Lipofectamine® RNAiMAX transfection reagent (Invitrogen, Carlsbad, CA) according to the manufacturer’s protocol.
[score:3]
Also in MCF-7 cells, the levels of miR-15a, miR-15b and miR16 were low, whereas the expression of miR-128 was modestly higher.
[score:3]
MDA-MB-436 cells had increased expression of miR-15b, miR-16, and miR-128.
[score:3]
BT549 cells exhibited increased expression of miR-15a, miR-15b and miR-16.
[score:3]
Thus, we measured the expression of miR-15a, miR-15b, miR-16 and miR-128b in the breast cancer cell lines (Figure 3).
[score:1]
The analysis led us to candidates such as miR-128 (binding to Smurf2 3′UTR, 5′-CACUGUGA-3′) and the miR-15 family miRNAs including miR-15a, miR-15b and miR-16 (binding to Smurf2 3′UTR, 5′-GCUGCUA-3′).
[score:1]
[1 to 20 of 19 sentences]
|
20 |
![]()
Other miRNAs from this paper: hsa-let-7a-1, hsa-let-7a-2, hsa-let-7a-3, hsa-mir-21, hsa-mir-26b, hsa-mir-29a, hsa-mir-16-2, hsa-mir-10a, hsa-mir-10b, hsa-mir-210, hsa-mir-221, hsa-mir-222, hsa-mir-191, hsa-mir-126, hsa-mir-146a, hsa-mir-373
MicroRNA Variation * Targets Function miR-16-5p down-regulated FEAT (faint expression in normal tissues, aberrant overexpression in tumors) Tumor, suppressor[31, 32, 33] CCND1 (Cyclin D1) BCL2 (B-cell lymphoma 2) RPS6KB1 (Ribosomal protein S6) miR-29a-3p up-regulated TTP (tristetraprolin) MetastamiR, OncomiR (drug resistance)[34, 35] PTEN miR-126-3p down-regulated VEGF Tumor, suppressor, MetastamiR[36, 37, 38, 39, 40, 41] PIK3R2 (phosphoinositide-3-kinase regulatory subunit 2) IRS-1 (Insulin receptor substrate 1) adapter molecule Crk SDF-1α (stromal cell-derived factor-1 alpha) KRAS miR-222-3p up-regulated ERα OncomiR (drug resistance)[35, 42, 43]p27 [Kip1] (cyclin -dependent kinase inhibitor 1B) p57 (cyclin -dependent kinase inhibitor 1C) TIMP3 (tissue inhibitor of metalloproteinase-3) * As compared with normal tissue or parental cell lines in case of preclinical data.
[score:29]
Taking consistency of median expression between different breast cancer subgroups, the low stability value (NormFinder) of the metastasis subgroup, as well as the stable expression of miR-16-5p on TaqMan [®] Array Human MicroRNA Cards and on SurePrintG3 Human miRNA microarrays from Agilent [®] in our analysis, and a stable expression in the TCGA dataset into account, miR-16-5p seems to be the most suitable endogenous control for microRNA expression in a metastatic sample enriched cohort.
[score:9]
Especially altered expression of miR-29a-3p, miR-126-3p, and miR-222-3p, but also of miR-16-5p can be involved in breast cancer development, tumor spread, proliferation and drug resistance (Table 3).
[score:4]
Despite the stable expression of miR-16-5p, miR-29a-3p miR-126-3p, and miR-222-3p in our patient cohort, these microRNAs have distinct functions in breast cancer.
[score:3]
In 21 malignant, five benign and five normal breast tissue samples, an expression analysis of five microRNAs (let-7a, miR-10b, miR-16, miR-21 and miR-26b) and three snoRNAs (RNU19, RNU48 and Z30) was performed.
[score:3]
miR-16 has been previously described as a stable endogenous control for microRNA expression analysis from breast cancer tissue [16], but also from blood samples [44, 45].
[score:3]
In our dataset, miR-16-5p was the most consistent expressed housekeeper candidate between different subtypes (i. e., hormone receptor positive, HER2 positive, triple negative) as illustrated by a boxplot (Figure 2).
[score:3]
Out of three snoRNAs (RNU19, RNU48 and Z30) and five microRNAs (let-7a-5p, miR-10b-5p, miR-16-5p, miR-21-5p, and miR-26b-5p), let-7a-5p and miR-16-5p were identified as the most stably expressed RNA pair.
[score:3]
Mobarra N. Shafiee A. Rad S. M. Tasharrofi N. Soufi-Zomorod M. Hafizi M. Movahed M. Kouhkan F. Soleimani M. Overexpression of microRNA-16 declines cellular growth, proliferation and induces apoptosis in human breast cancer cells Cell.
[score:3]
In contrast, miR-16-5p and miR-29a-3p expressions were independent of HER2, ER, and PR status.
[score:3]
Let-7a and miR-16-5p were most stably expressed with stability values of 0.312 and 0.379 using NormFinder and 1.327 and 1.473 using geNorm, respectively.
[score:3]
Therefore, miR-16-5p can be recommended as an endogenous control for normalization in microRNA expression analyses using breast cancer tissue.
[score:3]
In breast cancer, miR-16-5p is stably expressed both in samples from primary tumors and from metastatic sites and might be considered as the most relevant housekeeping microRNA.
[score:2]
Furthermore, miR-16-5p has been identified as regulator of osteolytic bone metastasis [30].
[score:2]
A combination of six microRNAs (miR-126-3p, miR-146a-5p, miR-29a-3p, miR-222-3p, miR-191-5p and miR-16-5p) seems to be most reliable for normalization according to this analysis.
[score:1]
miR-16-5p and miR-29a-3p are both strong housekeeper candidates.
[score:1]
In another study of 173 TNBC patients, a microRNA signature including miR-16-5p was associated with prognosis [28].
[score:1]
The combination of let-7a and miR-16-5p achieved lowest stability values of 0.221 using NormFinder and 0.978 using geNorm [16].
[score:1]
Expression levels of four of these microRNAs (miR-16-5p, miR-29a-3p, miR-126-3p, and miR-222-3p) showed also a high correlation with the median of all measured microRNAs (rho ≥ 0.8) and, therefore, might be well suited as endogenous controls.
[score:1]
Ten of these miRNAs can be also found on TaqMan Human MicroRNA array A and B Cards Set v3.0 (Table 2), and two of them (miR-16-5p and miR-29a-3p) were also selected as well-suited endogenous candidates as described above (Table 1).
[score:1]
As illustrated by boxplots (Figure 2 for miR-16-5p, miR-29a-3p miR-126-3p, miR-222-3p and Figure S1 (Supplementary Material) for all other housekeeper candidates), median C [t]-values of miR-16-5p were most consistent between different subgroups (i. e., primary tumor, metastasis, hormone receptor positive, HER2 positive, triple negative).
[score:1]
[1 to 20 of 21 sentences]
|
21 |
![]()
Other miRNAs from this paper: hsa-mir-15a, hsa-mir-19a, hsa-mir-19b-1, hsa-mir-19b-2, hsa-mir-21, hsa-mir-103a-2, hsa-mir-103a-1, hsa-mir-16-2, hsa-mir-181a-2, hsa-mir-181b-1, hsa-mir-181c, hsa-mir-181a-1, hsa-mir-122, hsa-mir-142, hsa-mir-206, hsa-mir-181b-2, hsa-mir-181d, hsa-mir-103b-1, hsa-mir-103b-2
The Bcl-2 mRNA levels in HL60 cells were upregulated to 122% and 137% by downregulating the miR-16 levels by sgR16(1–14) and sgR16(1–22), respectively (Figure 4B,C).
[score:7]
Downregulation of the miR-16 expression by TRUE gene silencing.
[score:6]
In one set of the experiments, we obtained results similar to the above ones, but restoration of the miR-16 level reduction by downregulating the tRNase Z [L] expression was incomplete (Figure S1A).
[score:6]
The reduction in the miR-16 level by sgR16(1–14) was restored by downregulating the tRNase Z [L] expression, while the reduction by sgR16(1–22) was not affected (Figure 1C,D).
[score:6]
sgR16(1–14) and sgR16(1–22) significantly downregulated the miR-16 level, whereas sgR16(9–22) did not at all (Figure 1C,D).
[score:4]
Downregulation of the miR-16 level by TRUE Gene Silencing.
[score:4]
Furthermore, to show that the knockdown of miR-16 is functional, we examined its endogenous target, the Bcl-2 mRNA, for the stability [30].
[score:4]
It has been shown in human cells that miR-15a and miR-16 work as tumor suppressors, while miR-17-92, miR-19a/b, miR-21, and miR-181a/b are oncogenic [18]– [20].
[score:3]
This result implies that sgR16(1–14) can stabilize the Bcl-2 mRNA by reducing the miR-16 level and subsequently inhibiting the mRNA transport to P-bodies.
[score:3]
As expected, miR-16 was cleaved after the 16th A by tRNase Z [L] under the direction of sgR16(1–14), but not sgR16(9–22) (Figure 1B).
[score:2]
tRNase Z [L] can Cleave miR-16 under the Direction of a 14-nt sgRNATo examine if tRNase Z [L] can cleave miRNA under the direction of sgRNA, we performed an in vitro tRNase Z [L] cleavage assay for human miR-16.
[score:2]
tRNase Z [L] can Cleave miR-16 under the Direction of a 14-nt sgRNA.
[score:2]
tRNase Z [L] is responsible at least partly for the reduction in the miR-16 level by sgR16(1–14).
[score:1]
These sgRNAs, sgR16(1–12), sgR16(6–17), sgR16(4–17), and sgR16(4–15), are designed to be complementary to 12 or 14 nucleotides of miR-16 (Figure 1E,F).
[score:1]
The miR-16, miR-19a/b, Bcl-2 mRNA and β-actin mRNA levels were quantitated by real-time PCR using a LightCycler 480 SYBR Green I Kit (Roche).
[score:1]
Reduction in the miR-16 Level by a Naked 14-nt sgRNA.
[score:1]
sgR16(1–14), sgR16(9–22), or the 22-nt antisense RNA sgR16(1–22) was transfected into HEK293 cells, and the cellular miR-16 level was analyzed by northern blotting and real-time PCR.
[score:1]
While sgR16(9–22) and sgR16(1–22) did not reduce the miR-16 level at all, sgR16(1–14) significantly reduced the level to 58% (Figure 4A).
[score:1]
A 14-nt linear-type sgRNA, sgR16(1–14), which is complementary to the 1st–14th nucleotides of miR-16, and a control 14-nt RNA, sgR16(9–22), which is complementary to 9th–22nd nucleotides of miR-16, were chemically synthesized as 2′- O-methyl RNA (Figure 1A).
[score:1]
These results contrast with those obtained with a transfection reagent, in which sgR16(1–22) almost completely eliminated cellular miR-16 (Figure 1D).
[score:1]
The following eleven 5′- and/or 3′-phosphorylated RNAs with full 2′- O-methyl modifications, 3′-Alexa-568-labeled 5′-phosphorylated sgR16(1–14) with full 2′- O-methyl modifications, 3′-FITC-labeled 5′-phosphorylated sgRNA14 with full 2′- O-methyl modifications, and 5′-FITC-labeled miR-16 were chemically synthesized by Nippon Bioservice: sgR16(1–14), 5′-pUUUACGUGCUGCUA(p)-3′; sgR16(9–22), 5′-pCGCCAAUAUUUACG-3′; sgR16(1–22), 5′-pCGCCAAUAUUUACGUGCUGCUA(p)-3′; sgR16(1–12), 5′-pUACGUGCUGCUA-3′; sgR16(6–17), 5′-pAUAUUUACGUGC-3′; sgR16(4–17), 5′-pAUAUUUACGUGCUG-3′; sgR16(4–15), 5′-pAUUUACGUGCUG-3′; sgR142(1–14), 5′-pUAGGAAACACUACAp-3′; sgR142(1–23), 5′-pUCCAUAAAGUAGGAAACACUACAp-3′; sgR206(1–14), 5′-pUUCCUUACAUUCCAp-3′; sgR19(1–14), 5′-pCAUGGAUUUGCACAp-3′; sgRNA14, 5′-pGGGGGCGGCCCCCG-3′; miR-16, 5′-UAGCAGCACGUAAAUAUUGGCG-3′.
[score:1]
Figure S1 The reduction in the miR-16 level by sgR16(1–14) is attributable at least partly to tRNase Z [L].
[score:1]
0038496.g002 Figure 2tRNase Z [L] is responsible at least partly for the reduction in the miR-16 level by sgR16(1–14).
[score:1]
Likewise sgR16(1–14) significantly reduced the miR-16 level to 53%, but in contrast sgR16(1–22) also did work almost perfectly (Figure 4B).
[score:1]
To examine if tRNase Z [L] can cleave miRNA under the direction of sgRNA, we performed an in vitro tRNase Z [L] cleavage assay for human miR-16.
[score:1]
5′-fluorescein-labeled miR-16 was incubated with recombinant human Δ30 tRNase Z [L] in the absence or presence of sgRNA, which was phosphorylated at the 5′ end but not at the 3′ end.
[score:1]
Reduction in the miR-16 level by a naked 14-nt sgRNA.
[score:1]
The mechanism by which sgR16(1–22) acts on the miR-16 level would be through binding and sequestering [20]– [22].
[score:1]
The miR-16 levels are normalized against the 5S rRNA levels.
[score:1]
Next, we examined if sgR16(1–14) works as sgRNA against miR-16 in human cells.
[score:1]
0038496.g001 Figure 1(A and E) Structures of the complexes of sgRNAs with human miR-16.
[score:1]
0038496.g004 Figure 4 (A) Quantitation of the miR-16 level in HEK293 cells with a StepOne Real Time PCR System.
[score:1]
The miR-16 levels are normalized against the RNU48 levels.
[score:1]
L, alkaline ladder of miR-16; I, input RNA.
[score:1]
We also tested 4 more linear-type sgRNAs against miR-16 for their guiding ability.
[score:1]
We cultured HEK293 cells in the presence of 1 µM of naked sgR16(1–14), sgR16(9–22), or sgR16(1–22), and analyzed the cellular miR-16 level by real-time PCR.
[score:1]
[1 to 20 of 36 sentences]
|
22 |
![]()
Other miRNAs from this paper: hsa-let-7a-1, hsa-let-7a-2, hsa-let-7a-3, hsa-let-7b, hsa-let-7c, hsa-let-7d, hsa-let-7e, hsa-let-7f-1, hsa-let-7f-2, hsa-mir-21, hsa-mir-24-1, hsa-mir-24-2, hsa-mir-205, hsa-let-7g, hsa-let-7i, hsa-mir-1-2, hsa-mir-1-1, hsa-mir-34b, hsa-mir-378a, hsa-mir-378d-2, hsa-mir-711, hsa-mir-378b, hsa-mir-378c, hsa-mir-378d-1, hsa-mir-378e, hsa-mir-378f, hsa-mir-378g, hsa-mir-378h, hsa-mir-378i, hsa-mir-378j
Moreover, the miR-16-1 mimics transfection promoted a significant high level of α-synuclein aggregation in the SH-SY5Y-Syn cells, by targeting and inhibiting the Hsp70 expression, though it did not regulate the expression of α-synuclein in both mRNA and protein levels.
[score:10]
Thus, we have identified the promotion of miR-16-1 to the α-synuclein aggregation in the SH-SY5Y-Syn cells, by targeting and inhibiting the Hsp70 expression.
[score:7]
What is more, the Hsp70 expression in both mRNA and protein levels was downregulated by miR-16-1 (Figures 3(c)– 3(e)).
[score:6]
To evaluate whether there was an influence of Hsp70 downregulation by miR-16-1 on the α-Syn aggregation, we firstly constructed an SH-SY5Y cell line overexpressing α-synuclein, SH-SY5Y-Syn, in which chemical inhibition of Hsp70 promoted α-Syn aggregation.
[score:6]
3.3. miR-16-1 Targets the 3′ UTR of Hsp70 and Reduces Hsp70 Expression in Human Neuroblastoma SH-SY5Y Cell Line.
[score:5]
In summary, we firstly found that miR-16-1 could reduce Hsp70 expression in SH-SY5Y cell line and promote high level of α-synuclein aggregation in a α-synuclein overexpressed SH-SY5Y cell line.
[score:5]
3.4. miR-16-1 Mimics Promoted α-Synuclein Aggregation in SH-SY5Y-Syn CellsTo further explore the regulatory role of miR-16-1 on the α-synuclein aggregation, by targeting Hsp70, we transfected SH-SY5Y-Syn cells with 50 nM of miR-16-1 mimics or miRNA control and determined their influence on the α-synuclein aggregation.
[score:4]
In the present study to investigate the possible regulation of microRNAs in Hsp70 expression and the following α-Syn aggregation, we screened the candidate microRNAs against Hsp70, and miR-16-1 was one of the screened target microRNAs, highly pairing sites within the 3′ UTR of Hsp70.
[score:4]
To investigate the possible regulation of microRNAs in Hsp70 expression, we screened the candidate microRNAs targeting Hsp70 by PicTAR and miRanda, and miR-16-1 was on the top list, with three highly paired sites within the 3′ UTR of Hsp70 (Figure 3(a)).
[score:4]
To further explore the regulatory role of miR-16-1 on the α-synuclein aggregation, by targeting Hsp70, we transfected SH-SY5Y-Syn cells with 50 nM of miR-16-1 mimics or miRNA control and determined their influence on the α-synuclein aggregation.
[score:4]
The miR-16-1 mimics transfection in SH-SY5Y cell significantly reduced the Hsp70 expression in both mRNA and protein levels in the cell.
[score:3]
Figures 4(a) and 4(b) indicated that neither 50 nM of miR-16-1 mimics nor 50 nM of miRNA control had influence on the α-synuclein expression in mRNA level or in protein level.
[score:3]
Here, we show that miR-16-1 promotes the aberrant α-synuclein accumulation via targeting heat shock protein 70 in human neuroblastoma cell line SH-SY5Y.
[score:3]
The expression of α-Syn and Hsp70 in mRNA level or of miR-16-1 was quantified by the real-time RT-PCR method with Takara One-Step RT-PCT kit (TaKaRa Bio Inc.
[score:3]
For the analysis of α-Syn, Hsp70, and miR-16-1 expression and the analysis of α-Syn aggregation dots between two groups, statistical evaluations are presented as mean ± SE.
[score:1]
The miR-16-1 mimics or miRNA control (GenePharma, Shanghai, China) with 25 or 50 nM was also transfected with Lipofectamine 2000.
[score:1]
Then the miR-16-1 mimics were used to manipulate the miR-16-1 level in SH-SY5Y-Syn cells; Figure 3(b) indicated that the miR-16-1 mimics transfection with 25 or 50 nM significantly drove the miR-16-1 level (P < 0.001).
[score:1]
3.4. miR-16-1 Mimics Promoted α-Synuclein Aggregation in SH-SY5Y-Syn Cells.
[score:1]
[1 to 20 of 18 sentences]
|
23 |
![]()
Other miRNAs from this paper: hsa-mir-16-2, hsa-mir-196a-1, hsa-mir-196a-2, hsa-mir-215, hsa-mir-15b, hsa-mir-122, hsa-mir-191, hsa-mir-320a, hsa-mir-196b, hsa-mir-448, hsa-mir-320b-1, hsa-mir-320c-1, hsa-mir-320b-2, hsa-mir-320d-1, hsa-mir-320c-2, hsa-mir-320d-2, hsa-mir-320e
B. Combined overview of three modules, including miR-215, miR-16, and 86 miR-215 targets and 191 miR-16 targets (21 targets in common).
[score:7]
B. Heatmap showing down-regulation of miR-16 targets after transfection into cultured cells.
[score:6]
We found that targets in 2 out of 3 predicted modules were significantly down-regulated by the corresponding miRNAs, miR-16 and miR-215 (Figure 3).
[score:6]
For example, miR-16 targets MAPK14 (p38 MAPK) and BID (also a miR-215 target), which are two key regulators in apoptosis -associated pathways [52, 53].
[score:6]
Top row shows miR-16 expressions across 30 liver biopsy samples, rows below for its targets.
[score:5]
Both miRNAs targeted large number of genes, 191 for miR-16 and 86 for miR-215, and 21 genes were targeted by both (Figure 4A and 4B, module # 4, 27 and 28 in Table 2).
[score:5]
A. Heatmap showing inverse expression patterns between miR-16 and its 191 targets (module # 4 in Table 2).
[score:5]
To illustrate the complexity of combinatorial regulations at the miRNA level, we show in Figure 4 a combined network of three identified modules involving two miRNAs, miR-16 and-215, that were up-regulated in HCV+ samples.
[score:5]
In the protein interaction network, miR-16 and miR-215 targets interact with many other proteins, including targets of the same miRNA and another miRNA (Figure 4C).
[score:5]
Also, miR-16 was up-regulated among HCV+ samples by ~2 fold (P = 9e-5).
[score:4]
Schema showing the relationships among module 4, 27, and 28 in Table 2. miRNAs are in red, and mRNA targets are in turquoise (miR-215), or in yellow (miR-215 and miR-16), or in green (miR-16).
[score:3]
This sub-network suggests that HCV may be able to repress the expressions of several key genes in a number of HCV pathways via miR-16, miR-215, or both.
[score:3]
In table at the bottom, row 'Mis_match' shows if miR-16 with mismatches used, indicated by locations.
[score:1]
18,19 represents mismatches at positions 18 and 19 of miR-16 mature sequences counted from 5'.
[score:1]
Out of 24 miRNAs studied, three of them, miR-16, miR-215 and miR-15b, happened to be in at least one of our predicted modules (Table 2).
[score:1]
For example, the correlation between miR-191 and its host gene DALRD3 was 0.65 (Pearson coefficient), P = 9.8e-5. Similarly, the correlation between miR-16 and its host gene SMC4 was 0.55, P = 0.0016.
[score:1]
miR-16 is shown to induce cell cycle arrest [34], and perturbation of cell cycle progression may be a common scenario during HCV infection that impacts the severity of liver injury [35].
[score:1]
[1 to 20 of 17 sentences]
|
24 |
![]()
Other miRNAs from this paper: hsa-let-7a-1, hsa-let-7a-2, hsa-let-7a-3, hsa-let-7b, hsa-let-7c, hsa-let-7d, hsa-let-7e, hsa-let-7f-1, hsa-let-7f-2, hsa-mir-15a, hsa-mir-21, hsa-mir-16-2, hsa-mir-34a, hsa-mir-205, hsa-mir-221, hsa-mir-222, hsa-mir-200b, hsa-let-7g, hsa-let-7i, hsa-mir-15b, hsa-mir-125b-1, hsa-mir-141, hsa-mir-143, hsa-mir-145, hsa-mir-125b-2, hsa-mir-200c, hsa-mir-200a, hsa-mir-375, hsa-mir-488
In this section, we will discuss the roles of certain miRNAs in prostate cancer as summarized in Table 2. Table 2 miRNAs that influence PCa progression miRNA Role in PCa Function Study miR-15a and miR-16 Tumor suppressors Inhibit cell proliferation, invasion and angiogenesis through regulation of multiple targetsAqeilan 2010 [25], Musumeci 2011[72] miR-21 Onco-miRNA Increases tumor growth, invasion and metastasisSi 2007 [79], Selciklu 2009 [80], Li 2009 [81], Ribas 2009 [82] miR-125b Onco-miRNA Increases cell proliferation and inhibits apoptosisLee 2005 [84], Shi 2007 [26], Vere White 2009 [85] miR-143 Tumor suppressor Inhibits cell proliferation and migration by regulating KRAS, MAPK pathways and cell cycle.
[score:15]
Studies have also shown that miR-15a, miR-16-1 are down regulated in pituitary adenomas in comparison with normal pituitary, which basically enhances the assumption that they work as tumor suppressors and that their knock down by allelic loss may contribute to tumorigenesis.
[score:5]
The in vivo knock down of miR-15a, miR-16-1 resulted in hyperplasia associated with CCD1 and WNT3A up regulation, all of the above evidence suggest that loss of miR-15a and miR-16-1 may be a significant pathogenic event during the development of PCa [25].
[score:4]
Lately, it was also proposed that miR-15 and miR-16 direct the expression of VEGF and IL-6, two factors that stimulate tumor angiogenesis and bone metastasis, respectively.
[score:4]
The miR-15 and miR-16 have a tumor suppressor activity on both cancer cell level and at the stromal microenvironment [72].
[score:3]
It has been reported that miR-15a, miR-16-1 cluster targets not only BCL2 but also CCD1 (encoding cyclin D1) and WNT3A mRNAs, which promote many prostate carcinogenic features including; survival, proliferation, and invasion [25].
[score:3]
These observations lead us to conclude that in the context of prostate cancer, miR-15 and miR-16 are tumor suppressors, at least, on two levels such as at the levels of tumor cell and stromal cells.
[score:3]
It was reported that miR-15a, miR-16-1 sequences and BCL2 mRNA sequences share a complementary homology, and thus the previous information collectively suggests that miR-15a, miR-16-1 could suppress BCL2 by post transcriptional repression [25].
[score:3]
In a recent study, the expression of miR-15a, miR-16-1 in PCa samples showed consistent down regulation of these genes in around 80% of cancer samples compared with that of normal samples [25].
[score:3]
Moreover, it was shown that re -expression of miR-15 and miR-16 in cancer -associated fibroblasts (CAFs) will cause attenuation of the stromal support capability, and this will result in the decrease in cell proliferation and migration in primary and metastatic tumors [72].
[score:3]
The role of miRNA-15a and miRNA-16.
[score:1]
The miR-15 and miR-16 are usually down-modulated in the tumor sustaining stroma, an observation that can be explained by the effect of cancer cells on the stroma [72].
[score:1]
The miR-15a and miR-16 are both located at 13q14.3, and the deletions at this location have been reported in many malignancies including: CLL, MM, Mantle cell lymphoma, and Prostate carcinoma [25].
[score:1]
[1 to 20 of 14 sentences]
|
25 |
![]()
Other miRNAs from this paper: hsa-mir-15a, hsa-mir-20a, hsa-mir-16-2, mmu-mir-15b, hsa-mir-15b, mmu-mir-15a, mmu-mir-16-1, mmu-mir-16-2, mmu-mir-20a, hsa-mir-20b, mmu-mir-20b
Thus, the result was the same with VEGF -overexpressing transgenic mice mo del that miR-16 can inhibit lung cancer growth by suppressing VEGF expression.
[score:9]
Hua et al. [29] showed that VEGF is predicted to be targeted by multiple miRNAs, including miR-15b, miR-16, miR-20a and miR-20b, and transfection of these miRNAs into CNE cells (a human nasopharyngeal carcinoma cell line) can inhibit VEGF expression [29].
[score:7]
We further demonstrated that the intranasal administration of miR-16 could inhibit lung cancer growth by significantly suppressing VEGF expression.
[score:7]
Using the lung-specific adenocarcinoma transgenic mouse mo del and the A549-pCAG-iRFP-2A-Verus orthotopic lung tumor mouse mo del, we further investigated the novel approaches for microRNA target therapy and demonstrated that miR-16 effectively inhibits lung cancer growth by suppressing VEGF expression via the intrinsic and extrinsic apoptotic pathways (Figure 8).
[score:7]
Thus, miR-16 can inhibit lung cancer growth by suppressing VEGF expression.
[score:7]
Figure 9A showed that miR-16 lowered pulmonary tumorigenesis via decreased the expression of VEGF in both lung tissues (Figure 9A, lower panel) and circulation blood (Figure 9B), and also decreased the expression of CD105 tumor marker in serum (Figure 9C), affected the formation of lung tumors in human orthotopic non-small cell lung cancer xenograft mo del.
[score:5]
After three intranasal administrations of 20 μg miR-16 or mock miR per mouse once a week, we found that miR-16, which lowered the expression of VEGF in both lung tissues (Figure 8B and 8C) and circulation blood (Figure 8D) (p < 0.01), affected the formation of lung tumors in > 12-month-old lung-specific hVEGF-A [165] overexpressing transgenic mice (Figure 8A).
[score:5]
The results of the western blot analyses revealed that the cleaved forms of caspase 3, 8, 9, and poly (ADP-ribose) polymerase (PARP) were activated after miR-16 treatment in the hVEGF-A [165] overexpressing transgenic mice (Figure 8E).
[score:3]
Therefore, we further investigated the inhibitory effect of microRNA-16 (miR-16) on lung tumors (Figure 8) because recent reports have linked the expression of specific microRNAs with tumorigenesis and metastasis.
[score:3]
MicroRNA-16 reduces pulmonary tumorigenesis in VEGF -overexpressing transgenic mice.
[score:2]
MicroRNA-16 reduces pulmonary tumorigenesis in vascular endothelial growth factor (VEGF) -overexpressing transgenic mice.
[score:2]
The mice were then sacrificed after four weeks of miR-16 administration, and lung tissues were collected for pathological histology, immunohistochemistry staining, and protein extraction.
[score:1]
The mice were then sacrificed after miR-16 administration, and lung tissues and sera were collected for pathological histology, immunohistochemistry staining, serum VEGF and CD105 detections.
[score:1]
Based on these results, miR-16 may induce apoptosis via both the intrinsic and extrinsic pathways.
[score:1]
The transgenic mice were randomly assigned to the following two groups for treatment: Tg/Mock (in vivo-jetPEI in 5% glucose solution) and Tg/miR-16 (miR-16 mixed with in vivo-jetPEI in 5% glucose solution).
[score:1]
[1 to 20 of 15 sentences]
|
26 |
![]()
Other miRNAs from this paper: hsa-mir-15a, hsa-mir-29a, hsa-mir-93, hsa-mir-29b-1, hsa-mir-29b-2, hsa-mir-16-2, hsa-mir-7-1, hsa-mir-7-2, hsa-mir-7-3, hsa-mir-15b, hsa-mir-29c
Regarding the molecular mechanism underlying the oncolytic adenovirus -mediated MCL1 suppression, we demonstrated that OBP-301 upregulated MCL1 -targeted miRNAs, such as miR-15, miR-16 and miR-29, and miR-29 overexpression efficiently suppressed MCL1 expression in human osteosarcoma cells.
[score:14]
OBP-301 dose -dependently upregulated the expression of E2F1 and MCL1 -targeted miRNAs (miR-15a, miR-16, miR-29a) in SaOS-2 and MNNG/HOS cells (Fig. 5a,b).
[score:8]
However, miR-15a, miR-16 and miR-29a may not be the only MCL1 -targeted miRNAs because we cannot exclude the possible involvement of other miRNAs in regulating MCL1 expression.
[score:6]
To investigate the underlying mechanism of OBP-301 -mediated MCL1 suppression, we determined whether OBP-301 upregulates MCL1 -targeted miRNAs (miR-15, miR-16, miR-29) via E2F1 activation in human osteosarcoma cells.
[score:6]
miR-15, miR-16, and miR-29 suppress MCL1 expression in human malignant tumor cells 22.
[score:5]
The expression levels of miR-15a, miR-16, and miR-29a were defined from the threshold cycle (Ct), and relative expression levels were calculated using the 2 [−ΔΔCt] method after normalization with reference to the expression of U6 small nuclear RNA.
[score:5]
Moreover, Ad-E2F1 significantly increased the expression of miR-15a, miR-16, and miR-29a in SaOS-2 cells, although MNNG/HOS cells showed increased expression of miR-15a and miR-16, but not miR-29a, after Ad-E2F1 infection (Fig. 5d).
[score:5]
Moreover, a recent report has suggested that miR-16 and miR-29 are downregulated and miR-15 is associated with chemosensitivity in human osteosarcoma cells 23.
[score:4]
After synthesis of cDNA from 10 ng of total RNA using the TaqMan MicroRNA Reverse Transcription Kit (Applied Biosystems), the expression of miR-15a, miR-16, or miR-29a was determined by quantitative real-time RT-PCR (qRT-PCR) using the Applied Biosystems StepOnePlus [TM] real-time PCR system.
[score:3]
To evaluate the effect of MCL1 -targeted miRNAs in the chemosensitivity of human osteosarcoma cells, we introduced exogenous miR-15a, miR-16, miR-29a or control miRNA into SaOS-2 and MNNG/HOS cells.
[score:1]
To evaluate the expression of miR-15a, miR-16, and miR-29a in tumor cells after OBP-301 infection, SaOS-2 and MNNG/HOS cells were seeded on 6-well plates at a density of 2 × 10 [5] cells/well and 24 hours later infected with OBP-301 at MOIs of 0, 1, 5, 10, 50, or 100 PFU/cell.
[score:1]
Cells were transfected with 10 nM MCL1 siRNA, control siRNA, Pre-miR-15a, Pre-miR-16, Pre-miR-29a, or control Pre-miRNA (Applied Biosystems, Foster City, CA, USA) 48 hours before chemotherapy treatment and treated with CDDP or DOX at the indicated doses for 24 hours.
[score:1]
The values of miR-15a, miR-16, and miR-29a at 0 MOI were set at 1, and the relative levels of miR-15a, miR-16, miR-29a at the indicated MOIs were plotted as fold induction.
[score:1]
[1 to 20 of 13 sentences]
|
27 |
![]()
Other miRNAs from this paper: hsa-let-7a-1, hsa-let-7a-2, hsa-let-7a-3, hsa-let-7d, hsa-mir-21, hsa-mir-16-2, hsa-let-7g, hsa-let-7i, hsa-mir-146a, hsa-mir-146b
We studied in silico if miR-16-5p had a predicted binding site targeting circadian core elements.
[score:3]
MiR-21 and miR-16 were stably expressed in whole milk collected within month 2 of lactation from four mothers.
[score:3]
MiR-16, let-7g and miR-146b expression was significantly higher in skim milk fractions than in lipids and in full milk (* p<0.05; ** p<0.01; *** p<0.001).
[score:3]
They discovered that miR-16 exhibited circadian rhythmicity in the intestinal crypts of adult rats and exerted anti-proliferative effects on intestinal cells by acting directly on five cell cycle regulators (Ccnd1, Ccnd2, Ccnd3, Ccne1 and Cdk6) [44].
[score:3]
We discovered higher miR-16 levels in evening milk, collected from 18:00 to 20:00, than in morning milk, expressed from 7:00 to 9:00 (p<0.
[score:3]
0140488.g004 Fig 4Endogenous references (let-7a, let-7g, let-7d, miR-16, miR-146b and miR-21) have been analyzed in milk samples collected from four mothers (A to D) and expressed at different times throughout a day.
[score:3]
Endogenous references (let-7a, let-7g, let-7d, miR-16, miR-146b and miR-21) have been analyzed in milk samples collected from four mothers (A to D) and expressed at different times throughout a day.
[score:3]
Here we found miR-21 and miR-16 stably expressed within month 2 of lactation in raw pooled milk samples (Fig 1).
[score:3]
The daily miR-16 fluctuations in breast milk might act in the gastrointestinal epithelium of the lactating infant helping to establish and/or fine-regulate gastrointestinal rhythmicity and to coordinate it with the maternal rhythmicity.
[score:2]
In this paper, we propose a set of endogenous reference genes (hsa-let-7d-5p, hsa-let7g-5p, and hsa-miR-146b-5p) to normalize raw quantification cycle (Cq) data and we identified a daily fluctuation of miR-16-5p in preterm milk.
[score:1]
From this study, we propose that another link can be explored between gastrointestinal rhythms of the breastfed infant and the lactocrin circadian signaling which, in part, might be mediated by the anti-proliferative miR-16.
[score:1]
These data revealed that miR-21 (mean Cq = 28.24, SD = 0.76) and miR-16 (mean Cq = 28.47, SD = 0.99) were highly stable during lactation in mature milk.
[score:1]
In skim milk, let-7d (mean Cq = 31.35, SD = 1.0) and miR-21 (mean Cq = 28.15, SD = 1.0) were also stable, while miR-16, let-7g and let-7a showed higher variability (Cq SD > 1.8).
[score:1]
C) Positive correlation between Cq values of two endogenous references (miR-16 and miR-21).
[score:1]
We have tested the stability of six candidate endogenous controls (ECs), with selection based on the literature: hsa-miR-146b-5p [5, 10, 14], hsa-miR-16-5p [17, 18], hsa-miR-21-5p [17], hsa-let-7a-5p [18], hsa-let-7g-5p [19], and hsa-let-7d-5p [18– 20].
[score:1]
The TaqMan probe identifiers were as follows: hsa-miR-16-5p (#000391), hsa-let7g-5p (#002282), hsa-let-7a-5p (#000377), hsa-let-7d-5p (#002283), hsa-miR-146b-5p (#001097), hsa-miR-21-5p (#000397).
[score:1]
MiR-16 is the most constantly released and, for that reason, the authors used it as an endogenous reference to normalize miRNAs levels in human milk.
[score:1]
We speculate that daily miR-16 fluctuations in breast milk may have a dual meaning: in part it may reflect the metabolism of the mammary gland during lactation; conversely, it might have a role in transmitting maternal rhythms to breast-fed infants.
[score:1]
We have identified clock time -dependent fluctuations of miR-16-5p in preterm breast milk (Fig 4C).
[score:1]
However, when the endogenous references miR-16, miR-21 or let-7a were plotted against the external RNA cel-lin-4 for each sample, no correlation was found (S4A Fig).
[score:1]
We identified a daily oscillation of miR-16-5p.
[score:1]
MiRNA -RNA duplex: miR-16-5p-3’UTR mRNA CLOCK.
[score:1]
0140488.g003 Fig 3Raw Cq data of endogenous references (let-7a, let-7g, let-7d, miR-16, miR-146b and miR-21) analyzed in full milk, lipids, and skim milk, were represented in a Tukey box plot.
[score:1]
On the other hand, miR-16 and miR-21 Cq values, which are both candidate ECs, were both positively correlated (r = 0.58, p = 0. 006; S4C Fig).
[score:1]
We have tested the two suggested combinations, let-7g/d and let-7g/d/miR-146b, in normalizing miR-21, miR-16 and let-7a levels.
[score:1]
In lipids, let-7d (mean Cq = 34.37, SD = 0.92), let-7a (mean Cq = 30.69m SD = 1.0) and miR-21 (mean Cq = 29.9, SD = 1.26) were also stable, whilst miR-16 and let-7g showed higher variability (Cq SD > 1.4).
[score:1]
Up to now, circadian changes of miR-16 have been reported in the intestinal crypts of adult rats [44].
[score:1]
To determine the stability of six literature -based candidate miRNAs (miR-21, miR-16, let-7a, let-7g, let-7d) and miR-146b, we analyzed human breast milk (n = 15) collected within month 2 of lactation from four healthy mother donors (Table 1).
[score:1]
Of these, miR-16-5p has been used as an EC in human breast milk [17] and hsa-miR-146b-5p is one of the most abundant miRNAs in human milk [10, 14].
[score:1]
Raw Cq data of endogenous references (let-7a, let-7g, let-7d, miR-16, miR-146b and miR-21) analyzed in full milk, lipids, and skim milk, were represented in a Tukey box plot.
[score:1]
In the work of Pigati et al., miR-16 has been used as an EC in human breast milk [17].
[score:1]
We used the comparative 2 [-ΔCq] method to evaluate expression levels of miR-16, miR-21 and let-7a during clock time, using the geometric mean of let-7g and let-7d (let-7g/d) or the geometric mean of let-7g, let-7d and miR-146b (let-7g/d/miR146-b) as normalization factors.
[score:1]
No significant difference was found between fresh and stored milk, at least for miR-16, miR-21, let-7a, let-7g and let-7d.
[score:1]
We found variability in miR-16 patterns between donors and within a woman (month 2 of lactation).
[score:1]
As we could not possibly obtain a similar baseline time for all the donors, the four mothers differ in miR-16 fluctuations in their milk (S5 Fig); moreover, an intra-individual variability was found (S6 Fig).
[score:1]
Our results are not in favor of using hsa-miR-16-5p as endogenous control in preterm milk.
[score:1]
C) MiR-16, using both normalization factors (let-7g/d/miR-146b and let-7g/d), exhibits daily fluctuations in the milk from four mothers (p = 0. 04).
[score:1]
In order to test miRNA stability throughout a single day of lactation and detect daily fluctuations, milk samples (n = 39) from four donor mothers, collected at different clock times, throughout 2 or 3 days (Table 2) were analyzed for miR-21-5p, miR-16-5p, let-7a-5p, let-7g-5p, let-7d-5p and miR-146b-5p.
[score:1]
MiR-16 and miR-21 levels are constantly released in the culture media of human mammary epithelial cells with levels reflecting the cellular abundance.
[score:1]
Both allowed identification of miR-16 fluctuations throughout the 24H (p = 0. 04).
[score:1]
MiR-146b, let-7d and let-7g appeared relatively stable (Cq SDs respectively were 0.9, 1.5 and 1.6), while miR-16, miR-21 and let-7a were more variable (Cq SD ≥ 2; Fig 4A).
[score:1]
On the other hand, miR-16, let-7g and miR-146b Cq values were significantly higher in skim milk fractions than in lipids (respectively p<0.
[score:1]
S4 Fig A) Plot of external spike-in cel-lin-4 Cq values against Cq values of internal miRNA controls (miR-16, miR-21 and let-7a) indicating no correlation.
[score:1]
[1 to 20 of 43 sentences]
|
28 |
![]()
Other miRNAs from this paper: hsa-let-7a-1, hsa-let-7a-2, hsa-let-7a-3, hsa-let-7b, hsa-let-7c, hsa-let-7d, hsa-let-7e, hsa-let-7f-1, hsa-let-7f-2, hsa-mir-15a, hsa-mir-17, hsa-mir-20a, hsa-mir-21, hsa-mir-92a-1, hsa-mir-92a-2, hsa-mir-106a, hsa-mir-16-2, hsa-mir-147a, hsa-mir-214, hsa-mir-221, hsa-mir-222, hsa-let-7g, hsa-let-7i, hsa-mir-1-2, hsa-mir-15b, hsa-mir-132, hsa-mir-143, hsa-mir-145, hsa-mir-125a, hsa-mir-127, hsa-mir-195, hsa-mir-1-1, hsa-mir-155, hsa-mir-302d, hsa-mir-370, hsa-mir-371a, hsa-mir-372, hsa-mir-373, hsa-mir-20b, hsa-mir-515-1, hsa-mir-515-2, hsa-mir-92b, hsa-mir-147b, hsa-mir-371b
It was found that miR-15a and miR-16 were deleted or downregulated in lymphocytic leukaemia [39]; let-7 was downregulated in lung cancers [40, 41]; the miR-17 cluster was amplified in several types of lymphoma and solid tumours [31, 42, 43]; miR-21 was overexpressed in glioblastoma [44, 45] and breast cancer [46]; levels of miR-143 and miR-145 were decreased in colorectal neoplasia, breast, prostate and cervical cancers [46, 47]; miR155 was upregulated in Burkitt and B-cell lymphomas [48- 50] and also in breast cancer [46].
[score:12]
We present evidence for the down-regulation of c-MYC, one of the most potent and frequently deregulated oncogenes, by let-7 miRNA, via the predicted binding site in the 3'UTR, and verify the suppression of BCL-2 by miR16.
[score:7]
Both let-7 and miR-16 have been shown to downregulate their target oncogenes, c-MYC and BCL-2, respectively.
[score:6]
Moreover, we have confirmed that miR-16 regulates BCL-2, (previously reported by others [51]), and we have proposed the other putative targets for different oncomirs, validation of which would be of special interest.
[score:4]
The suppression was stronger when a construct that contained a triple miR-16 binding site was used and resulted in 2.18 fold downregulation – only 45.8% of the original luciferase activity measured (Fig. 3B).
[score:4]
Although at the time we were conducting our experiments the regulation of BCL-2 by miR-16 was reported [51], we nevertheless decided to include this interaction in the study, as an additional control of the approach we used for miRNA target verification.
[score:4]
It has been previously reported that miR-15a and miR-16-1 target BCL2 mRNA [51].
[score:3]
The miRNAs studied here, let-7c and miR-16, are predicted to interact with their potential binding sites c-MYC and BCL-2 respectively, in a so-called canonical interaction, in agreement with the report that the canonical sites have higher binding energy and may be more efficient suppressors [26].
[score:3]
In our system, using only the expected miR-16 binding site of BCL-2 3'UTR, we confirmed that BCL-2 oncogene is targeted by miR-16.
[score:3]
Moreover, two predicted interactions (cMYC/let7 and BCL2/miR-16) have been tested experimentally in a reporter gene assay, which presently seems to be the "gold-standard" method to validate miRNA::target interactions.
[score:2]
Click here for file Sequences of oligos used to create sensor constructs carrying c-MYC b. s. for let-7c and BCL-2 b. s. for miR-16.
[score:1]
Although the BCL-2/miR-16 interaction has been already shown [51], we demonstrate it here with the use of BCL-2 binding site for miR-16 only and not BCL-2 3'UTR segment of 546 bp, as before [51].
[score:1]
Sequences of oligos used to create sensor constructs carrying c-MYC b. s. for let-7c and BCL-2 b. s. for miR-16.
[score:1]
This miRNA, miR-195, shares the same seed region with miR-15 and miR-16 and shows high similarity to the rest of the miR-15 family sequence.
[score:1]
We have found that also another member of the miRNA 15 family is predicted to bind exactly on the same site as miR-16 (pos.
[score:1]
More specifically, we obtained 1.78 fold reduction of the luciferase activity even when the sensor construct carried a single binding site for miR-16.
[score:1]
The free energy of the miR-195/ BCL2 (26.5 kcal/mol) is even stronger than for miR-16/ BCL2 (23.3 kcal/mol).
[score:1]
Specific oligonucleotides having BstEII ends and containing binding sites (single or triple repeats) for the analysed microRNAs: c-MYC b. s. for let-7c and BCL-2 b. s. for miR-16 were generated (Metabion, Martinsried, Germany).
[score:1]
The following reporter constructs were tested: (A) BCL-2 reporter constructs carrying a single binding site for miR-16, (B) BCL-2 reporter construct carrying a triple binding site for miR-16, (C) c-MYC reporter constructs carrying a single binding site for let-7, (D) c-MYC reporter constructs including sensors carrying the whole 3'UTRs from the c-MYC gene.
[score:1]
-36.5 BCL-2 2500 hsa-miR-16.
[score:1]
[1 to 20 of 20 sentences]
|
29 |
![]()
Other miRNAs from this paper: hsa-mir-19b-1, hsa-mir-19b-2, hsa-mir-21, hsa-mir-24-1, hsa-mir-24-2, hsa-mir-29a, hsa-mir-16-2, hsa-mir-15b, hsa-mir-125b-1, hsa-mir-125b-2
A–D: Expression levels of miR-21 (A), miR-29a (B), miR-125b (C) and miR-16 (D) in freshly prepared and stored serum samples.
[score:3]
Thereafter, we examined the expression levels of miR-21, miR-29a, miR-125b and miR-16 in hemolyzed controls.
[score:3]
Among the four miRNAs examined, the expression levels of miR-16 were significantly higher in plasma than in serum.
[score:3]
During our analysis of a limited number of miRNAs, we identified differences only in miR-16 levels; nonetheless, our data raises the possibility that miRNA expression in plasma specimens is generally higher even when one takes precautions during plasma preparation.
[score:3]
The expression levels of miR-16 and the degree of hemolysis were significantly higher in plasma than in serum (P<0.0001).
[score:3]
0112481.g005 Figure 5 A–D: Expression levels of miR-21 (A), miR-29a (B), miR-125b (C) and miR-16 (D) in freshly prepared and stored serum samples.
[score:3]
Expression levels of miR-21, miR-29a, miR-125b and miR-16 (A) and the degree of hemolysis (B) are shown.
[score:3]
0112481.g002 Figure 2Expression levels of miR-21, miR-29a, miR-125b and miR-16 (A) and the degree of hemolysis (B) are illustrated.
[score:3]
Correlation between miR-125b and miR-16 expression and the degree of hemolysis were significant even while analyzing serum samples without any visible hemolysis (i. e. hemolysis score of 0 and 1, Figure 4C ).
[score:3]
Here, we illustrate that elevated miR-21, miR-29a, miR-125b and miR-16 expression was easily detected in hemolyzed controls.
[score:3]
In fact, expression levels of miR-21, miR-29a, miR-125b and miR-16 showed a significant correlation with the degree of hemolysis in serum samples from subjects without apparent colorectal lesions.
[score:3]
0112481.g006 Figure 6Expression levels of miR-21, miR-29a, miR-125b and miR-16 (A) and the degree of hemolysis (B) are shown.
[score:3]
Expression levels of miR-21, miR-29a, miR-125b and miR-16 (A) and the degree of hemolysis (B) are illustrated.
[score:3]
Real-time RT-PCR was performed to examine the expression levels of miR-21, miR-29a, miR-125b and miR-16 using the TaqMan MicroRNA Assays (Applied Biosystems, Foster City, CA, USA) specific for each miRNA.
[score:2]
was performed to examine the expression levels of miR-21, miR-29a, miR-125b and miR-16 using the TaqMan MicroRNA Assays (Applied Biosystems, Foster City, CA, USA) specific for each miRNA.
[score:2]
B: Correlation between the degree of hemolysis and serum levels of miR-21, miR-29a, miR-125b and miR-16.
[score:1]
This is particularly important when using miR-16 as an internal control.
[score:1]
Interestingly, we showed a significant increase in the levels of miR-21, miR-29a and miR-16 in post-prep than in pre-prep sera.
[score:1]
In contrast, another study showed higher levels of miR-15b, miR-16 and miR-24 in plasma than in serum.
[score:1]
C: Levels of miR-21, miR-29a, miR-125b and miR-16 were elevated from baseline in hemolyzed control with 1/64 [th] dilution, and their levels increased along with the presumed hemoglobin concentration.
[score:1]
RNA was extracted from serum, plasma or hemolyzed controls with spiked-in cel-miR-39, and levels of miR-21, miR-29a, miR-125b and miR-16 were examined by real-time RT-PCR.
[score:1]
In fact, serum levels of miR-125b and miR-16 significantly correlated with the degree of hemolysis even in samples with no visually recognizable hemolysis (i. e. a visual hemolysis score of 0 and 1).
[score:1]
The degree of hemolysis in serum samples correlated significantly with the levels of miR-21 (P<0.0001), miR-29a (P = 0.0002), miR-125b (P<0.0001) and miR-16 (P<0.0001).
[score:1]
C: Correlation between the degree of hemolysis and serum levels of miR-21, miR-29a, miR-125b and miR-16 in visually non-hemolysed sera (hemolysis score of 0 and 1).
[score:1]
MiR-21, miR-29a, miR-125b and miR-16 in serial dilutions of hemolyzed control samples.
[score:1]
Measured miR-21, miR-29a, miR-125b and miR-16 expression increased with hemoglobin levels in hemolyzed controls.
[score:1]
As shown in Figure 6A, levels of miR-21, miR-29a and miR-16 were significantly higher in sera drawn after the prep.
[score:1]
Levels of miR-21 (P<0.0001), miR-29a (P<0.0001) and miR-16 (P = 0.0003), and the degree of hemolysis (P = 0.0002) were significantly higher in sera drawn after vs.
[score:1]
Levels of miR-21, miR-29a and miR-125b were not significantly different between matched serum and plasma, while miR-16 levels were significantly higher in plasma than in serum (Figure 2A ).
[score:1]
[1 to 20 of 29 sentences]
|
30 |
![]()
Other miRNAs from this paper: hsa-mir-15a, hsa-mir-16-2, hsa-mir-15b, hsa-mir-195, hsa-mir-424, hsa-mir-497
Interestingly, the levels of mature miR-15a and miR-16 also remained unchanged, which is in line with a recent report where incubation of CLL cells with a inhibitor of histone deacetylases (HDACi) led to upregulation of miR-15a and miR-16-1 in only 35% of patient samples [53].
[score:6]
The tumor suppressor mechanism at 13q14.3 is multifactorial and is likely to involve other genetic elements than miR-15a/16-1, since (i) knocking out miR-15a and miR-16-1 in mice leads to a lymphoproliferative disease [16], but rare cases of CLL have been described where the deletion at 13q14.3 does not encompass the miRNA genes [10], [17], [18].
[score:6]
The miR-15/miR-16 family of miRNAs has been reported to target several genes involved in NF-kB signalling: IKKa/CHUK, the NF-kB activating kinase itself (Gene ID: 1142) [66], TAB3 (Gene ID:257397), an adaptor protein connecting TRAF6 with the NF-kB activating kinase TAK1 [60], and the transcriptional coregulator NCOR2/SMRT (Gene ID: 9612) [67].
[score:4]
Thus we reproduced previously reported findings on gene targets of the miR-15/miR-16 family that modulate NF-kB transcription factor activity either directly (NCOR2/SMRT) or via upstream kinases (IKKa/CHUK) or upstream adaptor proteins (TAB3).
[score:4]
miR-15/miR-16 family represses genes that modulate NF-kB activityThe miR-15/miR-16 family of miRNAs has been reported to target several genes involved in NF-kB signalling: IKKa/CHUK, the NF-kB activating kinase itself (Gene ID: 1142) [66], TAB3 (Gene ID:257397), an adaptor protein connecting TRAF6 with the NF-kB activating kinase TAK1 [60], and the transcriptional coregulator NCOR2/SMRT (Gene ID: 9612) [67].
[score:4]
The strong induction of NF-kB by the miR-15/miR-16 family in our screen however suggests that additional genes are targeted by these miRNAs that are part of the NF-kB circuitry.
[score:3]
Impact of miR-15a, miR-15b, and miR-16 on the expression of TAB3, IKKa/CHUK, SMRT, and SMAD7.
[score:3]
In order to delineate the molecular mode of induction of NF-kB activity by miR-15a, miR-15b and miR-16, the respective miR -mimics were cotransfected with luciferase reporter constructs containing 3′UTRs or parts of the 3′UTRs of the candidate target genes into HEK293T cells.
[score:3]
To this end, 4×10 [5] cells were seeded in the wells of 24 well plates with 0.45 µg of pMIR-Report, 0.05 µg TK Renilla and 10 pmol of either miR-15a-3p, miR-15a-5p, miR-15b-5p or miR-16 miR -mimics or miR -inhibitors (Life Technologies, Darmstadt, Germany), respectively.
[score:3]
While constructs containing 3′UTRs of genes previously reported to be targets of miR-15a and/or miR-16 (CHUK/IKKa, SMRT and TAB3) showed lower luciferase activity after miRmimics-15a/-16 transfection, luciferase activity from the control reporter SMAD7 selected using in-silico prediction remained constant (Figure 4F).
[score:3]
Examples are miR-15a and miR-16-1, for which a role in regulation of the cell cycle has been shown [16], [57]– [59].
[score:2]
No correlation could be found with levels of mature miR-15a and miR-16, probably because these transcripts are also deregulated by a posttranscriptional processing defect in CLL cells (Allegra, manuscript submitted).
[score:2]
Levels of mature miR-15a and miR-16 showed no significant correlation with DNA-methylation levels, probably because they are subject to additional posttranscriptional deregulation (Allegra et al., manuscript submitted).
[score:2]
DLEU2 splicing variants have been suggested to represent the primary transcripts (pri-miR) of miR-15a (Gene ID: 406948) and miR-16-1 (Gene ID: 406950) because of their localization and coregulation [11].
[score:2]
1003373.g004 Figure 4 MiR-15/miR-16 family is the strongest inducer of NF-kB.
[score:1]
MiR-15/miR-16 gene family is the strongest inducer of NF-kB in the miRNome.
[score:1]
miR-15/miR-16 family represses genes that modulate NF-kB activity.
[score:1]
TRIM proteins: 57% similarity, e value: 1e-65; ARL proteins: 62% similarity, e value: 2e-53; KPNA proteins 92% similarity, e value: 0. Similarly, sequence alignment of hsa-mir-16-1 and hsa-mir-16-2 showed 68,9% identity of a 90 bp overlap and alignment of hsa-mir-15a and hsa-mir-15b showed 56,1% identity of a 98 bp overlap.
[score:1]
Interestingly, for these miRNA genes and for several additional gene products at 13q14.3, an involvement in the NF-kB pathway has been postulated: miR-15a and miR-16-1 (inducing NF-kB) [60] and DLEU7 (repressing NF-kB) [61] modulate this central signalling pathway.
[score:1]
Of 810 miR -mimics transduced into HEK293 cells, the miR-15a/miR-16 family (miR-15a, miR-15b, miR-16, miR195, miR424, miR497) showed the strongest induction of NF-kB of all tested miRNA families (Figure 4A).
[score:1]
In vitro methylation was performed using SssI methylase (NEB) according to manufacturer's instructions but incubating for 4 h at 37°C and adding 1 µl fresh SAM after 2 h. To measure the impact of miR-15a, miR-15b and miR-16 on potential target genes, parts of or the whole 3′UTRs of TAB3, CHUK, SMAD7 and SMRT were cloned into the vector pMIR-Report (Applied Biosystems).
[score:1]
The miRNA genes miR-15a and miR-16-1 were identified together with other members of this miR family to be among the strongest activators of NF-kB activity.
[score:1]
MiR-15/miR-16 family is the strongest inducer of NF-kB.
[score:1]
[1 to 20 of 23 sentences]
|
31 |
![]()
Other miRNAs from this paper: hsa-let-7a-1, hsa-let-7a-2, hsa-let-7a-3, hsa-let-7b, hsa-let-7c, hsa-let-7d, hsa-let-7e, hsa-let-7f-1, hsa-let-7f-2, hsa-mir-15a, hsa-mir-21, hsa-mir-26a-1, hsa-mir-26b, hsa-mir-31, hsa-mir-32, hsa-mir-96, hsa-mir-98, hsa-mir-29b-1, hsa-mir-29b-2, hsa-mir-103a-2, hsa-mir-103a-1, hsa-mir-107, hsa-mir-16-2, hsa-mir-192, hsa-mir-148a, hsa-mir-10b, hsa-mir-183, hsa-mir-203a, hsa-mir-212, hsa-mir-214, hsa-mir-222, hsa-let-7g, hsa-let-7i, hsa-mir-15b, hsa-mir-23b, hsa-mir-122, hsa-mir-124-1, hsa-mir-124-2, hsa-mir-124-3, hsa-mir-125b-1, hsa-mir-128-1, hsa-mir-132, hsa-mir-135a-1, hsa-mir-135a-2, hsa-mir-138-2, hsa-mir-140, hsa-mir-141, hsa-mir-143, hsa-mir-144, hsa-mir-145, hsa-mir-152, hsa-mir-191, hsa-mir-125b-2, hsa-mir-126, hsa-mir-134, hsa-mir-150, hsa-mir-184, hsa-mir-186, hsa-mir-193a, hsa-mir-320a, hsa-mir-200c, hsa-mir-155, hsa-mir-128-2, hsa-mir-29c, hsa-mir-200a, hsa-mir-34b, hsa-mir-130b, hsa-mir-26a-2, hsa-mir-369, hsa-mir-381, hsa-mir-326, hsa-mir-148b, hsa-mir-424, hsa-mir-493, hsa-mir-432, hsa-mir-524, hsa-mir-516b-2, hsa-mir-516b-1, hsa-mir-516a-1, hsa-mir-516a-2, hsa-mir-503, hsa-mir-570, hsa-mir-574, hsa-mir-582, hsa-mir-592, hsa-mir-601, hsa-mir-603, hsa-mir-548c, hsa-mir-629, hsa-mir-542, hsa-mir-320b-1, hsa-mir-320c-1, hsa-mir-766, hsa-mir-320b-2, hsa-mir-765, hsa-mir-300, hsa-mir-450b, hsa-mir-744, hsa-mir-938, hsa-mir-103b-1, hsa-mir-103b-2, hsa-mir-320d-1, hsa-mir-320c-2, hsa-mir-320d-2, hsa-mir-320e, hsa-mir-203b
In 2005, miR-15a and miR-16-1 were reported to have lower expression in both GH-secreting and PRL-secreting pituitary adenomas than in normal tissues, and their downregulation was correlated with greater tumor volume and impaired secretion of p43, a potent anticancer cytokine, suggesting that miR-15a and miR-16-1 may function as tumor suppressors and their inactivation may contribute to tumor growth in pituitary adenomas [26].
[score:8]
Specifically, five miRNAs (miR-26b, miR-26a, miR-212, miR-107, and miR-103) were upregulated and twelve miRNAs (miR-125b, miR-141, miR-144, miR-164, miR-145, miR-143, miR-15b, miR-16, miR-186, let-7b, let-7a3, and miR-128) were downregulated.
[score:7]
For example, mutations in the miR-16-1 gene have been reported to be partially responsible for its aberrant expression in CLL patients [29], and expressions of miR-124 and miR-203 are decreased because of CpG methylation [101].
[score:6]
Regarding the deregulation in pituitary adenomas, miR-15a and miR-16-1 may exert their roles as tumor suppressors by regulating cell cycle.
[score:5]
In CLL, some other apoptosis related genes were identified to be targets of miR-15a and miR-16-1 cluster, such as MCL1, which could enhance cell survival by inhibiting apoptosis.
[score:5]
In another study on ACTH-secreting pituitary tumors, miR-15a and miR-16 were also expressed at a lower level [27], but no association between miRNAs expression and tumor size was observed in this study.
[score:5]
Mutations in miR-16-1 gene have been reported to be partially responsible for its altered expression in chronic lymphocytic leukemia (CLL) patients [29].
[score:4]
miR-15a and miR-16-1 are the first two miRNAs shown to have differential expression in pituitary adenomas.
[score:3]
Therefore, it is possible that, in pituitary adenomas, miR-15a and miR-16-1 influence apoptosis by targeting multiple antiapoptotic genes.
[score:3]
Recently, a study revealed that miR-15a and miR-16-1 cluster could modulate prostate cancer by targeting multiple genes, including cyclin D1 [68].
[score:3]
miR-15a and miR-16-1 were demonstrated to induce apoptosis by targeting Bcl-2 in CLL [73].
[score:3]
In addition to the decrease of let-7a, miR-15a, and miR-16, they also found underexpression of miR-21, miR-141, miR-143, miR-145, and miR-150 in ACTH-secreting pituitary adenomas compared with normal pituitary tissues [27].
[score:2]
miR-15a and miR-16-1 genes are located at chromosome 13q14, a region which is frequently deleted in pituitary tumors [24].
[score:1]
[1 to 20 of 13 sentences]
|
32 |
![]()
Other miRNAs from this paper: hsa-let-7b, hsa-mir-21, hsa-mir-30a, hsa-mir-92a-1, hsa-mir-92a-2, hsa-mir-16-2, hsa-mir-223, hsa-mir-320a, hsa-mir-423, hsa-mir-483, hsa-mir-320b-1, hsa-mir-320c-1, hsa-mir-320b-2, hsa-mir-320d-1, hsa-mir-320c-2, hsa-mir-320d-2, hsa-mir-320e
Note that, although both CD63 and Ago2 are expressed in MVs, only Ago2 is associated with miR-16.
[score:3]
B) Upper panel, Ago2 expression level in HL60 cells induced by ATRA is detected by western blotting; Lower panel, relative levels of total miR-16, miR-30a, miR-223 and miR-320b, as well as Ago2 complex -associated miR-16, miR-30a, miR-223 and miR-320b in the HL60 cells with or without ATRA treatment.
[score:3]
As shown in Figure 1A, miR-16, miR-223, miR-30a, miR-320b, let-7b, miR-92a, miR-423-5p and miR-21 were confirmed by qRT-PCR to have high expression levels in human plasma.
[score:3]
As shown in the in vitro digestion assay with RNase A (Figure 3), Ago2 complex -associated miR-16 was significantly resistant to RNase A compared with free miR-16, which was rapidly degraded by RNase A. These results suggest that certain cell secreted miRNAs are pre -loaded with Ago2 complexes in MVs released by origin cells and can be delivered into recipient cells where they start inhibiting their targets.
[score:3]
A) Upper panel, Ago2 expression level in HeLa cells induced by serum starvation and TNFα is detected by western bolting; Lower panel, relative levels of total miR-16, miR-30a, miR-223, miR-320b and miR-423-5p, as well as Ago2 complex -associated miR-16, miR-30a, miR-223, miR-320b and miR-423-5p in the HeLa cells with or without apoptotic reagent treatment.
[score:3]
To study whether the association of MV-encapsulated miRNAs with Ago2 complexes and their resistance to RNaseA degradation is dynamically regulated by cellular biological function, we assessed the relationship between the association of Ago2 complexes with miR-16 or miR-223 and the resistance of these miRNAs to RNaseA under cell apoptotic or differentiation conditions.
[score:2]
For instance, although miR-16 and miR-223 differ in their protein mediated stability by about 50% (Figure 1D), the difference in Ago2 association of these two miRNAs is far greater (∼85%) (Figure 2D).
[score:1]
D) The differentiation of HL60 cells induced by 20 µM ATRA for 48 h. E) Relative levels of total miR-16, miR-30a, miR-223, miR-320b and the levels of these miRNAs associated with Ago2 complexes in the MVs derived from HL60 cells with or without induced by ATRA.
[score:1]
Through the disruption of the association of miRNAs, including miR-16, with Ago2 complexes by TPF treatment, we successfully decreased the resistance of miRNAs in the cell-derived exosomes to RNase A. In contrast, when we increased the percentage of Ago2 complex -associated miR-16 by inducing apoptosis or the percentage of Ago2 complex -associated miR-223 by inducing cell differentiation, we found that the resistance of miR-16 or miR-223 in the cell-derived exosomes to RNase A was significantly enhanced.
[score:1]
As expected, with the percentage of Ago2 -associated miR-16 being increased, the resistance of the miR-16 in the MVs to RNaseA was significantly enhanced (Figure 5C).
[score:1]
B) The levels of total miR-16, miR-30a, miR-223 and miR-320b, as well as Ago2 complex -associated miR-16, miR-30a, miR-223 and miR-320b in cells were assessed by qRT-PCR.
[score:1]
As shown in Figure 5B, under the early cell apoptotic conditions induced by serum depletion or TNFα, the percentage of miR-16 associated with Ago2 complexes in the MVs was markedly increased, although the total amount of miR-16 was not changed.
[score:1]
Synthetic miR-16 and 3′- and 5′-biotin-labeled miR-16 oligonucleotides were purchased from Invitrogen (Shanghai, China).
[score:1]
C) The resistance of miR-16 in HeLa cell-derived MVs to RNaseA.
[score:1]
As shown in Figure 2C, although both Ago2 and CD63 were enriched in the MVs, only Ago2 was found to be associated with miR-16.
[score:1]
As expected, the stability of miR-16 in the MVs derived from the TPF -treated HeLa cells was significantly lower than that of non -treated MVs (Figure 4B).
[score:1]
The levels of total miR-16, miR-30a, miR-223, miR-320b and Ago2 complex -associated miR-16, miR-30a, miR-223, miR-320b in the MVs were assessed by qRT-PCR.
[score:1]
We tested whether TPF treatment can decrease the stability of miRNAs, including miR-16, miR-30a, miR-223 and miR-320b, in secreted MVs by decreasing the miRNA-Ago2 association.
[score:1]
Ago2 -associated miR-16 is highly resistant to RNaseA.
[score:1]
Note that, although the total miR-16 levels are not changed, the percentage of miR-16 associated with Ago2 complexes is increased under apoptosis induced by either serum starvation or TNFα treatment.
[score:1]
The pull-down product by the biotin-labeled probe complementary to human miR-16 (add adenosine at the 5′ and 3′ ends, respectively) was further separated by SDS-PAGE followed by silver staining or by western blotting using anti-Ago2 and anti-CD63 antibodies in a parallel fashion.
[score:1]
Interestingly, we found that the association of the MV-encapsulated miRNAs with the Ago2 complexes was variable, and among the eight miRNAs that we tested, miR-16 showed the highest percentage of total miRNA to associate with the Ago2 complexes.
[score:1]
Synthetic RNA molecules, including pre-miR-16 and scrambled negative control oligonucleotides, were purchased from Ambion (Austin, TX, USA).
[score:1]
A similar elevation of Ago2 complex -associated miR-16 but not total miR-16 was also observed in apoptotic HeLa cells (Figure S3A, lower panel).
[score:1]
As can be seen, Ago2 was also identified as a major protein band associated with miR-223 though the amount of Ago2 associated with miR-223 was slightly less than that associated with miR-16.
[score:1]
The Ago2 complex -associated miR-16 was obtained by immunoprecipitation using an anti-Ago2 antibody.
[score:1]
The MV lysate was pretreated with DNase I (Takara) and then incubated with probe-coated magnetic beads at 37°C for 3 h. After washing 6 times with the wash/binding buffer, a magnet was applied to attract the beads/miR-16/Ago2 complex to the side of the tube.
[score:1]
A) Equal amounts of Ago2 -associated miR-16 and protein-free, synthetic, mature miR-16 were treated with 20 µg/ml RNase A or 20 µg/ml RNaseA plus 100 µg/ml PK for various lengths of time.
[score:1]
B) Relative levels of total and Ago2 complex -associated miR-16, miR-30a, miR-223 and miR-320b in the MVs derived from HeLa cells with or without apoptotic reagent treatment.
[score:1]
An equal amount of Ago2 -associated miR-16 and free, synthetic miR-16 were then treated with RNaseA at various concentrations and for various time periods.
[score:1]
B) A schematic illustration of the miR-16 pull-down strategy using a biotin-labeled probe complementary to human miR-16.
[score:1]
In agreement with many previous studies [11], [16], [17], [37], [38], we found that the majority of the circulating miRNAs in human peripheral blood, such as miR-16, miR-223, miR-30a, miR-320, let-7b, miR-92a, miR-423-5p and miR-21 were located in the MV fraction.
[score:1]
However, recent studies also showed that the majority of circulating miRNAs, including miR-16, were not associated with cell-derived microvesicles [18], [19].
[score:1]
In this experiment, the Ago2 -associated miRNAs in the MVs, including miR-16, were harvested by immunoprecipitating the lysate of MV fraction using an anti-Ago2 antibody, and the amount of Ago2 -associated miR-16 in the precipitated product was quantitatively analyzed by qRT-PCR, referring to the standard curve of miR-16.
[score:1]
As shown in Figure 3A and 3B, Ago2 complexes strongly protect miR-16 against RNaseA degradation in a time- and dose -dependent fashion, and the protection by the Ago2 complexes can be completely abolished by PK treatment.
[score:1]
B) Equal amounts of Ago2 -associated miR-16 and protein-free, synthetic, mature miR-16 were treated with various concentrations of RNaseA or RNaseA plus 100 µg/ml PK for 30 min.
[score:1]
Because the miR-16 in the MVs was strongly protected by a proteinase-sensitive mechanism (Figure 1D), we designed a miR-16 pull-down strategy to isolate potential miR-16 -associated proteins using the MV fractions isolated from human plasma (Figure 2B).
[score:1]
It has been shown that miR-16 [31] and miR-223 [32], [33] are linked to cellular apoptosis and differentiation process, respectively.
[score:1]
C) The relative levels of miR-16, miR-223, miR-30a, miR-320b, let-7b, miR-92a, miR-423-5p and miR-21 in the MV vs.
[score:1]
The sequences of the probes used were as follows: anti-miR-16 pull-down probe, ACGCCAATATTACGTGCTGCTAA; random probe, TGATGTCTAGCGCTTGGGCTTTG; anti-miR-223 pull-down probe, ATGGGGTATTTGACAAACTGACAA.
[score:1]
Briefly, a DNA probe that was complementary to human mature miR-16 was synthesized, labeled with biotin at both the 5′ and 3′ ends and dissolved in 500 µl of wash/binding buffer (500 mM NaCl, 20 mM Tris-HCl and 1 mM EDTA, pH 7.5) at a final concentration of 8.0 pmol/µl.
[score:1]
C) Silver staining and western blotting of pull-down product from human plasma MVs by miR-16 probe.
[score:1]
B) The resistance of miR-16, miR-30a, miR-223 and miR-320b in MVs with/without TPF treatment against RNaseA.
[score:1]
0046957.g003 Figure 3 A) Equal amounts of Ago2 -associated miR-16 and protein-free, synthetic, mature miR-16 were treated with 20 µg/ml RNase A or 20 µg/ml RNaseA plus 100 µg/ml PK for various lengths of time.
[score:1]
[1 to 20 of 44 sentences]
|
33 |
![]()
In this study we analyzed the expression of COX-2, miR-101 and miR-16 -both with COX-2 inhibiting effects- and miR-21 -with pro-angiogenic and pro-inflammatory effects- in relation to expression of various angiogenic factors in human HCC in cirrhotic and noncirrhotic liver.
[score:7]
The aims of the study are (1) to analyze expression of Cox-2 mRNA, Cox-2 protein, miR-16, miR-21 and miR-101 in HCC and adjacent liver parenchyma in cirrhotic and noncirrhotic liver, (2) to investigate the relation between COX-2 expression, miR-21 expression and angiogenic factors in these tissues and (3) to investigate the association between miR-16 and miR-101 and COX-2 expression.
[score:5]
Another miRNA shown to inhibit COX-2 expression is miR-16.
[score:5]
The study aimed at analysing (1) the correlation between COX-2 expression and angiogenic factors, (2) the correlation between COX-2 expression and miR-101/miR-16 and (3) the correlation between angiogenic factors and miR-21 in cirrhotic and non-cirrhotic HCC, both in tumor tissue and adjacent liver parenchyma.
[score:5]
MiR-16 expression in HCC and liver parenchyma and correlation with COX-2 expression.
[score:4]
Plots representing relative expression of COX-2 mRNA (A), COX-2 protein (B), miR-16 (C), miR-21 (D) and miR-101 (E) in in normal liver, HCC tumor tissue (T) and tumor-adjacent parenchyma (Ad) in noncirrhotic and in cirrhotic liver.
[score:3]
Also no correlation between miR-16 expression and either COX-2 mRNA or COX-2 protein was found.
[score:3]
Figure 1C shows the relative expression of miR-16 in normal liver, tumor adjacent liver and in cirrhotic and noncirrhotic HCC tumor tissue.
[score:3]
miR-16, miR-21 and miR-101 gene expression levels were quantified in HCC tumor tissue.
[score:3]
The same authors describe a negative correlation between COX-2 protein and miR-16 expression in seven human HCC and paired non-tumoral liver biopsies.
[score:3]
The lack of correlation between miR-16, miR-101 and COX-2 expression is in contrast to findings in other tumor types like gastric and colon cancer.
[score:3]
Expression levels of miR-16, miR-21 and miR-101 were determined by qRT-PCR using RNU49 as housekeeping gene with miRNA qRT-PCR assays (Applied Biosystems, Foster City, USA) as described previously [22].
[score:2]
Expression of COX-2 mRNA, COX-2 protein, miR-16, miR-21 and miR-101 were compared using a two-tailed Mann-Whitney-U test (non-related samples) in cirrhotic versus noncirrhotic liver of HCC and adjacent parenchyma separately.
[score:2]
In several hepatoma cell lines an inverse relation between miR-16 and COX-2 was found [20].
[score:1]
Especially miR-21, miR-101 and miR-16 seem to be relevant for the present study.
[score:1]
We found that neither miR-101 nor miR-16 had a correlation with COX-2 mRNA or COX-2 protein.
[score:1]
MiR-16 and miR-101 levels do not correlate with COX-2 mRNA and protein levels.
[score:1]
[1 to 20 of 17 sentences]
|
34 |
![]()
Other miRNAs from this paper: hsa-let-7a-1, hsa-let-7a-2, hsa-let-7a-3, hsa-let-7b, hsa-let-7c, hsa-let-7d, hsa-let-7e, hsa-let-7f-1, hsa-let-7f-2, hsa-mir-18a, hsa-mir-21, hsa-mir-33a, hsa-mir-103a-2, hsa-mir-103a-1, hsa-mir-16-2, hsa-mir-210, hsa-let-7g, hsa-let-7i, hsa-mir-138-2, hsa-mir-138-1, hsa-mir-103b-1, hsa-mir-103b-2
To test whether the selective inhibition of pre-miR-210 cleavage by ATD_13.6 results from the specific interactions between these two molecules, we performed control reactions involving several pre-miRNA species, i. e., pre-miR-16-1, -21, and -33a.
[score:3]
For the pre-miR-16-1/AL16-1_2 and pre-miR-21/AL-21 pairs, we observed that the oligomers similarly inhibited miRNA processing in both tested systems (commercial enzyme vs.
[score:3]
This result is consistent with the observations of Michlewski et al., who reported that oligonucleotides targeting the terminal loop of miR-16-1 precursor (pri-miR-16-1) did not block the formation of mature miR-16-1. Michlewski et al. postulated that the processing of the miR-16-1 precursor was not affected by complementary oligonucleotides because it lacks a conserved structural element and consequently is not recognized by auxiliary factors.
[score:3]
As expected, 2OMe-AL-16-1_2 was also a more effective inhibitor of pre-miR-16-1 processing than its counterpart 2OMe-AL-16-1. 10.1371/journal.
[score:3]
Again, to prove that the selective inhibition of pre-miR-210 cleavage by ATD_15.52 (precisely by its 5′ fragment) results from the specific interactions between the two molecules, we performed control reactions involving several pre-miRNA species, i. e., pre-miR-16-1, -21, and -33a (Fig. S2B).
[score:3]
As expected, 2OMe-AL-16-1_2 was also a more effective inhibitor of pre-miR-16-1 processing than its counterpart 2OMe-AL-16-1. 10.1371/journal.
[score:3]
In contrast, oligonucleotides targeting nonconserved terminal loops of miR-16-1 and -27a precursors did not affect maturation of these miRNAs.
[score:3]
0077703.g005 Figure 5(A) Comparison of the efficiency of miR-16-1 production by hDicer in the presence of the two oligomers targeting distinct apical regions of pre-miR-16-1. Radiolabeled pre-miR-16-1 was incubated with hDicer in the presence of either 2OMe-AL-16-1 (Left panel) or 2OMe-AL-16-1_2 (Right panel).
[score:3]
Radiolabeled ATD_13.6 was incubated with hDicer and then the appropriate pre-miRNA was added (pre-miR-16-1, -21, -33a, and -210).
[score:1]
Finally, one oligomer, AL-16-1, did not efficiently reduce pre-miR-16-1 digestion by hDicer (Fig. 3B).
[score:1]
Radiolabeled oligomer (either ATD_13.6 or ATD_15.52) was denatured and renatured alone (−) or in the presence of pre-miR-16-1, -21, -33a, and -210, respectively.
[score:1]
To determine whether these observations are specific cases of a more general rule, we tested the effects of four 12-nt oligomers, AL-16-1, AL-21, AL-33a and AL-210, on pre-miR-16-1, pre-miR-21, pre-miR-33a and pre-miR-210 processing.
[score:1]
An EMSA using pre-miR-16-1 and 2OMe-AL-16-1_2 proved that the new oligomer bound more tightly to pre-miR-16-1 than 2OMe-AL-16-1 (Fig. 5B).
[score:1]
However, we also observed that the RNA oligomer complementary to the terminal loop region of miR-16-1 precursor only weakly influenced the maturation of this miRNA (Fig. 3).
[score:1]
Triangles represent increasing amounts of the indicated 2OMe-oligomers (pre-miR-16-1:oligomer molar ratios of 1∶1, 1∶10, and 1∶100).
[score:1]
To address this problem, we designed a new 2OMe-oligomer (2OMe-AL-16-1_2) complementary to the other partially single-stranded sequence of the apical fragment of pre-miR-16-1 (Fig. 5A, Right panel ).
[score:1]
Almost no miR-16-1 or miR-210 was produced at a 100-fold molar excess of 2OMe-AL-16-1_2 or 2OMe-AL-210.
[score:1]
As expected, we found that pre-miR-16-1, -21, and -33a displaced ATD_13.6 from binding to the enzyme (Fig. S3).
[score:1]
Oligomers AL-16-1 and 2OMe-AL-16-1 similarly affected the formation of miR-16-1, especially at the highest concentration (Figs. 3B and 4A).
[score:1]
In addition, we tested the effects of increasing concentrations of pre-miR-16-1, -21, -33a, and -210 (1, 10, and 100 pmoles) on ATD_13.6 binding to hDicer.
[score:1]
When we applied RNA oligomers that were complementary to the other partially single-stranded fragment of pre-miR-16-1, we observed a more efficient blocking of miR-16-1 maturation (Fig. 5).
[score:1]
The stability of the complexes formed by pre-miR-16-1 and complementary oligomers determines the efficacy of miR-16-1 production by hDicer.
[score:1]
According to our expectations, we did not observe interactions between ATD_15.52 and pre-miR-16-1, -21, and -33a even when their high molar excess was applied.
[score:1]
We did not observe interactions between ATD_13.6 and pre-miR-16-1, -21, and -33a even when their high molar excess was applied (Fig. S2A).
[score:1]
The authors suggested that hnRNP A1 is not essential for the processing of miRNA precursors bearing nonconserved terminal loops, such as miR-16-1 and -27a.
[score:1]
Radiolabeled oligomers were denatured and renatured alone (−) or in the presence of pre-miR-16-1 (+).
[score:1]
The predicted secondary structures of pre-miR-16-1 are shown next to the diagrams.
[score:1]
0077703.g003 Figure 3(A) The predicted secondary structures of four tested pre-miRNAs (pre-miR-16-1, pre-miR-21, pre-miR-33a and pre-miR-210).
[score:1]
Each radiolabeled pre-miRNA (pre-miR-16-1, -21, -33a, or -210) was incubated with hDicer and 100 pmoles of the 12-nt 2′-O-methylated oligomer (2OMe-AL-16-1_2, 2OMe-AL-21, 2OMe-AL-33a, and 2OMe-AL-210), as indicated.
[score:1]
The diagrams show the average efficiency of miR-16-1 production based on three independent experiments; error bars represent the standard deviations.
[score:1]
The most profound effect was observed for pre-miR-16-1. These findings suggest that the applied pre-miRNAs outcompeted ATD_13.6 for binding to hDicer.
[score:1]
The results of the experiments performed for four pairs, 2OMe-AL-16-1_2:pre-miR-16, 2OMe-AL-21:pre-miR-21, 2OMe-AL-33a:pre-miR-33a, and 2OMe-AL-210:pre-miR-210, are shown (Fig. 6).
[score:1]
The positions of the complexes formed by 2OMe-AL-16-1_2 and pre-miR-16-1 are indicated with arrows.
[score:1]
Our results indicate that the nucleotide composition of the apical fragment of the miR-16-1 precursor (AU-rich sequence) may be responsible for the observed effect.
[score:1]
[1 to 20 of 34 sentences]
|
35 |
![]()
Other miRNAs from this paper: hsa-let-7a-1, hsa-let-7a-2, hsa-let-7a-3, hsa-let-7b, hsa-let-7c, hsa-let-7d, hsa-let-7e, hsa-let-7f-1, hsa-let-7f-2, hsa-mir-15a, hsa-mir-17, hsa-mir-21, hsa-mir-26a-1, hsa-mir-29a, hsa-mir-29b-1, hsa-mir-29b-2, hsa-mir-16-2, hsa-mir-148a, hsa-mir-10a, hsa-mir-10b, hsa-mir-34a, hsa-mir-199b, hsa-mir-210, hsa-mir-214, hsa-mir-218-1, hsa-mir-218-2, hsa-mir-223, hsa-let-7g, hsa-let-7i, hsa-mir-15b, hsa-mir-133a-1, hsa-mir-133a-2, hsa-mir-152, hsa-mir-125a, hsa-mir-126, hsa-mir-146a, hsa-mir-155, hsa-mir-29c, hsa-mir-200a, hsa-mir-34b, hsa-mir-34c, hsa-mir-26a-2, hsa-mir-148b, hsa-mir-146b, hsa-mir-574
miRNA Function (A animal studies, H human studies) References miR-17-92 cluster important in lung development and homeostasis (A)[69, 76, 77] miR-155 important for normal lung airway remo delling (A)[70] alteration of T-cell differentiation (A)[71] miR-26a highly expressed within bronchial and alveolar epithelial cells, important for lung development (H)[75] let-7 highly expressed in normal lung tissue, functions as a tumor suppressor in lung cells (H)[78] miR-29 functions as tumor suppressor in lung cells (H)[79] miR-15, miR-16 function as tumor suppressor genes (H)[80, 81] miR-223 control of granulocyte development and function (A)[82] miR-146a/b central to the negative feedback regulation of IL-1β -induced inflammation (H)[83, 84] miR-200a, miR-223 contribution to the extreme virulence of the r1918 influenza virus (A)[85] miR-17 family, miR-574-5p, miR-214 upregulated at the onset of SARS infection (A, H)[86]Two miRNAs, miR-146a and miR-146b, have been shown to play central role in the negative feedback regulation of IL-1β -induced inflammation; the mechanism is down-regulation of two proteins IRAK1 and TRAF6 involved in Toll/interleukin-1 receptor (TIR) signalling [83, 84].
[score:22]
miRNA Function (A animal studies, H human studies) References miR-17-92 cluster important in lung development and homeostasis (A)[69, 76, 77] miR-155 important for normal lung airway remo delling (A)[70] alteration of T-cell differentiation (A)[71] miR-26a highly expressed within bronchial and alveolar epithelial cells, important for lung development (H)[75] let-7 highly expressed in normal lung tissue, functions as a tumor suppressor in lung cells (H)[78] miR-29 functions as tumor suppressor in lung cells (H)[79] miR-15, miR-16 function as tumor suppressor genes (H)[80, 81] miR-223 control of granulocyte development and function (A)[82] miR-146a/b central to the negative feedback regulation of IL-1β -induced inflammation (H)[83, 84] miR-200a, miR-223 contribution to the extreme virulence of the r1918 influenza virus (A)[85] miR-17 family, miR-574-5p, miR-214 upregulated at the onset of SARS infection (A, H)[86] Two miRNAs, miR-146a and miR-146b, have been shown to play central role in the negative feedback regulation of IL-1β -induced inflammation; the mechanism is down-regulation of two proteins IRAK1 and TRAF6 involved in Toll/interleukin-1 receptor (TIR) signalling [83, 84].
[score:22]
Other miRNAs found to be involved in the pulmonary homeostasis are members of let-7 family [78], miR-29 [79], miR-15 and miR-16 [80, 81], which function as tumor suppressors in lung cells.
[score:3]
Several miRNAs such as miR-155, miR-26a, let-7, miR-29, miR-15/miR-16, miR-223, miR-146a/b and the miR-17-92 cluster have been shown to be involved in homeostasis and in the lung development (Table 4).
[score:2]
[1 to 20 of 4 sentences]
|
36 |
![]()
Other miRNAs from this paper: hsa-mir-22, hsa-mir-16-2
This PFOS -induced decrease in miR-16 may cause a multitude of effects in SH-SY5Y cells, such as regulating the expression level of Tau protein, which plays a critical role in maintaining neuronal microtubule stability; furthermore, abnormal expression of Tau induces neuronal cytotoxicity and neurodegenerative diseases, such as Alzheimer's disease (AD) [51].
[score:10]
We examined the relative expression levels of miR-16 and miR-22 in SH-SY5Y cells after a 48-hour PFOS treatment as previous studies demonstrated that miR-16 [29] and miR-22 [28] regulated BDNF mRNA translation at the posttranscriptional level.
[score:6]
However, the relative expression of miR-16, which directly targets the 3′UTR of BDNF mRNA and decreases BDNF protein levels, was decreased significantly after PFOS exposure.
[score:6]
miRNA-16 and miRNA-22 are two such mediators that are known to inhibit BDNF expression [28, 29].
[score:5]
Our results indicate that PFOS most likely acts through miRNA-22 rather than miRNA-16 to suppress BDNF gene expression.
[score:5]
These results indicate that PFOS influenced the relative expression of miR-16 and miR-22.
[score:3]
Effect of PFOS on the Relative Expression of miR-16 and miR-22.
[score:3]
To determine the relative mechanism through which PFOS alters BDNF expression, the relative expression of BDNF related miRNAs miR-16 and miR-22-3p was measured by RT-PCR.
[score:3]
BDNF mRNA has been previously reported to the target molecule of miR-16 [29, 30] and miR-22 [28].
[score:3]
As shown in Figure 5, compared with the control, the relative expression of miR-16 was significantly reduced in all the experiment groups.
[score:2]
The expression levels of specific miRNAs (has-miR-16 and has-miR-22-3p) were analysed using the miScript SYBR Green PCR Kit and miScript Primer Assays (Qiagen, USA) according to the manufacturer's instructions and normalized to U6 expression; the corresponding primer sequences used for miRNA reverse transcription and QPCR were not listed in the instructions.
[score:2]
[1 to 20 of 11 sentences]
|
37 |
![]()
This region is frequently deleted or downregulated in CLL cells and the miR16-1 (C > T) + 7 germ line mutation was found in one of the familial CLL patients who also had a family history of breast cancer [5].
[score:5]
A miR16-1 mutation in the 3′ flanking region was recently identified in NZB mice that serve as a mo del for human CLL, further supporting a unique role for miR16-1 in CLL [13], and it was shown that the C > T substitution on miR16-1 gene affects the level of expression of mature microRNAs [5].
[score:4]
The germline mutation found in the miR-16-1 and miR15a primary precursor caused low levels of microRNA expression in vitro and in vivo and was associated with deletion of the normal allele in CLL [5].
[score:4]
One germline mutation, miR16-1 C > T + 7, resulted in reduced expression of miR-16-1 both in vitro and in vivo.
[score:4]
Recently, Calin et al. identified mutations in six microRNA genes (miR-16-1, miR-27b, miR-29b2/29a, miR122a, miR-187, miR-206) in patients with Chronic Lymphocytic Leukemia (CLL) [5]; none of these mutations were found in a set of 160 individuals without cancer (P <.
[score:3]
Our results for miR16-1 C > T + 7 mutation in CLL are concordant with the study of Borkhardt et al. The frequency of mutation can be different for a particular population and hereditary background of patients and ethnicity can affect the results.
[score:3]
Previous data indicated that miR16-1 and miR15a behave as tumor suppressors in CLL.
[score:3]
Since miR16-1 induces apoptosis by repressing bcl-2, a decrease in miR16-1 will result in bcl-2 overexpression, which is a common feature in CLL [6].
[score:3]
Perhaps the mutation in miR16-1 can interact with inactivation of miR16-1 to modify the clinical phenotype [7].
[score:2]
In our large scale study with representation from different ethnicities and with various levels of hereditary risk, we did not identify any cases with the miR-16-1 (C > T) + 7 mutation in any of the cancers tested.
[score:2]
Thus, the presence of deleterious mutations in miR-15a and miR-16-1 suggests that this new class of RNAs may play a significant role in many sporadic and hereditary cancers.
[score:2]
To understand this, we searched 1428 biological specimens including tissue and blood DNA from a total of 1365 patients diagnosed with different types of cancer, including breast and ovarian cancers, HCC, CML, CLL, nasopharyngeal carcinoma and retinoblastoma for the miR16-1 (C > T) + 7 mutation.
[score:2]
miR16-1 C > T + 7 mutation may be important in other solid tumors such as colorectal and lung cancer and especially B-cell Non Hodgkin lymphoma which arise from the same progenitor branch of cell lineage as CLL.
[score:2]
BRCA2 and Rb, mutated in hereditary breast and ovarian cancer and retinoblastoma patients, are relatively close to the miR16-1 gene, and some tumors such as nasopharyngeal and HCC have some LOH in the region suggesting that the miR16-1 C > T + 7 mutation may be important in other cancers.
[score:2]
Moreover, we did not identified any miR16-1 C > T + 7 mutation in our CLL subgroup of cases who had no hereditary CLL and cancer history in their family.
[score:2]
Several cancers, including nasopharyngeal and HCC, have a high frequency of LOH near miR15a/miR16-1. Shao et al. found that 78% of nasopharyngeal tumors had LOH at 13q [8]; another group found that the highest frequency of LOH in nasopharyngeal cancer was at loci D13S133 (53.6%) on 13q14.3 [9].
[score:1]
miR-15a and miR-16-1 are located on chromosome 13q14.3 close to BRCA2, which is frequently mutated in hereditary breast and ovarian cancers, and Rb, which is deleted or mutated in retinoblastoma and sarcomas.
[score:1]
MicroRNAs miR-15a and miR-16-1 are located in the region of a deletion at 13q13.4.
[score:1]
[1 to 20 of 18 sentences]
|
38 |
![]()
Other miRNAs from this paper: hsa-let-7a-1, hsa-let-7a-2, hsa-let-7a-3, hsa-let-7b, hsa-let-7c, hsa-let-7d, hsa-let-7e, hsa-let-7f-1, hsa-let-7f-2, hsa-mir-15a, hsa-mir-25, hsa-mir-26b, hsa-mir-103a-2, hsa-mir-103a-1, hsa-mir-16-2, mmu-let-7g, mmu-let-7i, mmu-mir-27b, mmu-mir-146a, mmu-mir-184, mmu-mir-122, mmu-let-7d, hsa-let-7g, hsa-let-7i, hsa-mir-27b, hsa-mir-122, hsa-mir-146a, hsa-mir-184, mmu-let-7a-1, mmu-let-7a-2, mmu-let-7b, mmu-let-7c-1, mmu-let-7c-2, mmu-let-7e, mmu-let-7f-1, mmu-let-7f-2, mmu-mir-15a, mmu-mir-16-1, mmu-mir-16-2, mmu-mir-26b, mmu-mir-103-1, mmu-mir-103-2, mmu-mir-25, hsa-mir-103b-1, hsa-mir-103b-2, mmu-let-7j, mmu-let-7k
Highest-ranking miRNAs included miR-16/15a (46 targets), miR-27b (44 targets), let-7f (35 targets), miR-26b (33 targets), and miR-25 (30 targets).
[score:11]
Both upregulated and downregulated genes predicted to be regulated by miR-16/15a were included in the analysis.
[score:8]
This miRNA belongs to the miR-16/15 superfamily [41] and is predicted to regulate a large number of mRNA transcripts (476 conserved targets according to TargetScan.
[score:6]
Interestingly, PI3K/Akt and mTOR signaling, involved in translational control and protein output, are among the pathways potentially regulated by miR-16/15.
[score:4]
Detailed analysis of miR-16/15-regulated genes (ranked first) showed an association with biological terms such as neurological disease (P<0.001), cell death and survival (P<0.001), and PIK3/Akt signaling (P<0.001) (Fig. 3C).
[score:4]
Furthermore, we highlighted potential pathologically-relevant networks (genes) regulated by miR-16/15.
[score:2]
This was exemplified by the generation of networks related to the miRNA family involved in the regulation of the highest number of genes, miR-16/15.
[score:2]
Changes in miR-16/15a levels were confirmed by qRT-PCR.
[score:1]
A representative amplification curve of miR-16 by real-time qRT-PCR shows a significant enrichment (∼500 fold) of this miRNA pulled down by RIP-Ago2.
[score:1]
miR-16/15 are also involved with mitochondrial dysfunction and apoptosis [33], [42].
[score:1]
These observations were validated by qRT-PCR on “positive” miRNAs (i. e., miR-16, miR-15a, and miR-25) (Fig. 4D) in an independent set of animals (n = 3 per group).
[score:1]
The top-ranking miRNAs are miR-16 and miR-15a, which harbour the same seed sequence (GCTGCT), and thus functional mRNA binding site.
[score:1]
Here, a representative qRT-PCR using miR-16 is shown.
[score:1]
These predictions are in agreement with the literature suggesting a role for miR-16/15 in cell survival [32], [33].
[score:1]
[1 to 20 of 14 sentences]
|
39 |
![]()
Other miRNAs from this paper: hsa-let-7a-1, hsa-let-7a-2, hsa-let-7a-3, hsa-mir-21, hsa-mir-26b, hsa-mir-30a, hsa-mir-16-2, hsa-mir-30c-2, hsa-mir-30d, hsa-mir-10b, hsa-mir-30b, hsa-mir-30c-1, hsa-mir-30e
Known functions of the candidates are listed in Table 4. Table 4 Details of candidate endogenous control (EC) genes and their PCR amplification efficiencies Name Mature length (nt) RNA species Accession number Function Reference PCR Amplification efficiency (%) let-7a 22 miRNA MI0000060* Negatively regulates RAS oncogene[57] 96.3 miR-10b 22 miRNA MI0000267 * No functionally-verified targets 104.1 miR-16 22 miRNA MI0000070 * Negatively regulates B-cell lymphoma mRNA in chronic lymphocytic leukaemia patients[7] 104.3 miR-21 22 miRNA MI0000077 * Antiapoptotic, negatively regulates apoptosis-related genes[42] 96.8 miR-26b 22 miRNA MI0000084 * No functionally-verified targets 98.1 RNU19 198 snoRNA X94290 ** May be involved in pre-rRNA processing[59- 61] 99.2 RNU48 63 snoRNA NR_002745 ** Guides the 2'O-ribose methylation of 28S rRNA[62] 108.9 Z30 97 snoRNA AJ007733 ** Guides the methylation of the Am47 residue in U6 snRNA[63] 104.1 *mirBase database accession number ** Entrez gene ID Each reaction was primed using a gene-specific stem-loop primer.
[score:7]
From a panel of 345 miRNAs, miR-16 was selected in the top 15 most stably-expressed miRNAs across 40 normal human tissue types [58].
[score:3]
U6 snRNA (RNU6B), commonly used to normalise miRNA RQ-PCR data [49, 50] was found to be less stably expressed than let-7a and miR-16, the EC pair proposed by this study [51].
[score:3]
Significant differences in miR-30* expression were detected between tissue groups using either the one EC (P = 0.007) or the two EC (P = 0.01) approach, however the BM and MF tissue groups were found to be significantly different using the EC pair, let-7a and miR-16 but this was not detected when let-7a was used as the sole EC gene.
[score:3]
The expression of eight small RNAs was determined in 36 fresh-frozen breast tissues; three small nucleolar RNAs (snoRNAs, RNU19, RNU48 and Z30) and five miRNAs (let-7a, miR-10b, miR-16, miR-21 and miR-26b).
[score:3]
Depending on the tissue sample set, both let-7a and miR-16 were ranked in the top 10–15 most stably-expressed miRNAs, supporting the findings of the present study.
[score:3]
MiR-16 and miR-21 showed relatively high expression with median Cts of 21, while let-7a, miR-10b, miR-26b and RNU48 were moderately abundant with median Cts of between 23 and 27.
[score:3]
Thus the effect of using either let-7a as a single gene or using the recommended EC pair, let-7a and miR-16, on miR-30* expression was assessed.
[score:3]
Whilst deletion of the miR-16 gene has been implicated in the development of chronic lymphocytic leukemia [7], a specific role for this miRNA in breast cancer has not been identified.
[score:2]
GeNorm selected let-7a and miR-16 as the most stable EC pair and let-7a was selected as the single most stable EC gene using NormFinder.
[score:1]
The EC(s) used in these studies were let-7a and miR-16 [24], U6 small nuclear RNA (snRNA) and tRNA for initiator methionine [25], 18S rRNA [26], glyceraldehyde-3-phosphate dehydrogenase (GAPDH) [27] and in one article, the EC used for RQ-PCR analysis was not given [28].
[score:1]
Let-7a and miR-16 were identified as the most stable pair of EC genes using geNorm.
[score:1]
The number of genes to use in a normalisation strategy is in most cases, a trade off between required resolution and practicality and for most purposes the EC gene combination let-7a and miR-16 should suffice.
[score:1]
We recommend the combined use of Let-7a and miR-16 in this context.
[score:1]
[1 to 20 of 15 sentences]
|
40 |
![]()
Other miRNAs from this paper: hsa-mir-15a, hsa-mir-17, hsa-mir-21, hsa-mir-100, hsa-mir-107, hsa-mir-16-2, hsa-mir-212, hsa-mir-224, hsa-mir-125b-1, hsa-mir-140, hsa-mir-125a, hsa-mir-125b-2, hsa-mir-146a, hsa-mir-155, hsa-mir-146b, hsa-mir-455
hsa-miR-16-1 is up-regulated while hsa-miR-155 miRNA is down-regulated in individuals infected with invasive candidiasis as compared to normal expression levels (control).
[score:8]
0136454.g004 Fig 4 hsa-miR-16-1 is up-regulated while hsa-miR-155 miRNA is down-regulated in individuals infected with invasive candidiasis as compared to normal expression levels (control).
[score:8]
As compared to normal expression in control individuals, the aberrant expression of hsa-miR-16-1 and hsa-miR-17-3p (the most significant genes in this study) has been shown in Fig 4. 10.1371/journal.
[score:4]
Some miRNAs, such as miR-16-1, 106a, 106b and 224, were significantly up-regulated [31] leading to uncontrolled proliferation.
[score:4]
As compared to normal expression in control individuals, the aberrant expression of hsa-miR-16-1 and hsa-miR-17-3p (the most significant genes in this study) has been shown in Fig 4. 10.1371/journal.
[score:4]
This dysregulation was statistically important, as it has been shown that miR-16-1 was overexpressed in infected cells as compared to non-infected ones.
[score:3]
A qRT-PCR analysis was performed on randomly selected six miRNAs (miR-16-1, 106a, 16–2, 100, 140*, 17-3p) from 55 differentially expressed miRNAs to validate accuracy of array-generated data.
[score:3]
Aberrant expression of hsa-miR-16-1 and hsa-miR-155 (the most significant genes based on fold change and p-values).
[score:3]
It has been found that miR-16-1 and miR-15a are associated with E2F activity which is generated by pRB-E2F to regulate cell division process and migration [24].
[score:2]
Some of which, including miR-16-1, miR-16-2, have been shown to play a potential role in pulmonary edema.
[score:1]
[1 to 20 of 10 sentences]
|
41 |
![]()
Other miRNAs from this paper: hsa-let-7d, hsa-let-7e, hsa-mir-15a, hsa-mir-17, hsa-mir-19b-1, hsa-mir-19b-2, hsa-mir-20a, hsa-mir-23a, hsa-mir-25, hsa-mir-27a, hsa-mir-92a-1, hsa-mir-92a-2, hsa-mir-16-2, hsa-mir-148a, hsa-mir-34a, hsa-mir-181a-2, hsa-mir-181a-1, hsa-mir-221, hsa-mir-15b, hsa-mir-23b, hsa-mir-27b, hsa-mir-130a, hsa-mir-133a-1, hsa-mir-133a-2, hsa-mir-99b, hsa-mir-331, hsa-mir-133b, hsa-mir-483, hsa-mir-625, hsa-mir-660, hsa-mir-744, hsa-mir-1246, hsa-mir-23c
The ANOVA test showed significant differences between control, MGUS, diagnostic and CR samples in the expression levels of miR-16 (P < 0.001), miR-17 (P < 0.001), miR-19b (P < 0.001), miR-20a (P = 0.002), miR-660 (P < 0.001) and miR-25 (P < 0.001), with the highest levels of expression observed in samples from healthy controls.
[score:5]
A non-significant trend towards a difference in miR-331 expression was observed, and there were no significant differences between expression levels of miR-16, miR-17, miR-20a, miR-25 or miR-660.
[score:5]
In addition, the main goal in the Italian study was to examine the prognostic impact of the serum expression of miR-16 and miR-25 at diagnosis, together with cytogenetics by FISH and ISS, which were already well established as prognostic factors, and to compare the expression of these miRNAs in 32 paired samples of serum and bone marrow plasma cells.
[score:5]
Interestingly, miR-16 has a tumor suppressor role in MM pathogenesis by targeting clonal plasma cells, reducing bone marrow neoangiogenesis and reducing interaction between the tumor cells and the bone marrow.
[score:5]
For example, downregulation of circulating miR-16 and miR-25 were related to poor prognosis in multiple myeloma [23].
[score:4]
For example, miR-16 has previously been found elevated during osteoclast/osteoblast differentiation [30] and its ectopic expression in serum correlated with bone metastasis burden in breast cancer [31].
[score:3]
Moreover, the expression of five of these miRNAs – miR-16, miR-17, miR-19b, miR-20a and miR-660 – increased at the time of CR, and two of the 14 miRNAs – miR-19b and miR-331 – were linked to PFS after ASCT.
[score:3]
The analysis of the 14 miRNAs identified in the screening phase confirmed the differential expression of five miRNAs between the diagnostic and CR samples of the patients with MM: miR-16 (P = 0.028), miR-17 (P = 0.016), miR-19b (P = 0.009), miR-20a (P = 0.017) and miR-660 (P = 0.048) (Figure 2).
[score:3]
The components of the 14-miRNA signature can be classified in five expression clusters: miR-16, miR-17-92 cluster and paralogs, miR-23/24/27a, miR-331 and miR-660.
[score:3]
Recently, miR-16 and miR-25 have been proposed as independent prognostic markers in newly diagnosed MM [23].
[score:1]
Differential serum levels of miR-16, miR-17, miR19b, miR-20a, miR-25 and miR-660 in patients with multiple myeloma (MM) at diagnosis (Dx) and at complete remission (CR), in patients with monoclonal gammopathy of undetermined significance (MGUS), and in healthy controls (HC).
[score:1]
miR-16, miR-17, miR-19b, miR-20a and miR-660 as markers of CR.
[score:1]
miR-16 induced a 60% reduction in MM cells proliferation at 72 h after pre-miR-16 transfection [38].
[score:1]
[1 to 20 of 13 sentences]
|
42 |
![]()
Other miRNAs from this paper: hsa-let-7a-1, hsa-let-7a-2, hsa-let-7a-3, hsa-let-7b, hsa-let-7c, hsa-let-7d, hsa-let-7e, hsa-let-7f-1, hsa-let-7f-2, hsa-mir-30a, hsa-mir-99a, hsa-mir-16-2, mmu-let-7g, mmu-let-7i, mmu-mir-30a, mmu-mir-99a, mmu-mir-182, mmu-mir-186, mmu-mir-143, hsa-mir-7-1, hsa-mir-7-2, hsa-mir-7-3, hsa-mir-182, mmu-let-7d, hsa-let-7g, hsa-let-7i, hsa-mir-143, hsa-mir-186, hsa-mir-320a, mmu-let-7a-1, mmu-let-7a-2, mmu-let-7b, mmu-let-7c-1, mmu-let-7c-2, mmu-let-7e, mmu-let-7f-1, mmu-let-7f-2, mmu-mir-16-1, mmu-mir-16-2, mmu-mir-7a-1, mmu-mir-7a-2, mmu-mir-7b, hsa-mir-376c, hsa-mir-376a-1, hsa-mir-378a, hsa-mir-379, mmu-mir-376a, mmu-mir-378a, mmu-mir-379, hsa-mir-335, mmu-mir-335, mmu-mir-376b, hsa-mir-448, mmu-mir-448, hsa-mir-376b, hsa-mir-493, hsa-mir-376a-2, mmu-mir-376c, hsa-mir-378d-2, mmu-mir-675, hsa-mir-675, mmu-mir-493, hsa-mir-378b, hsa-mir-378c, hsa-mir-378d-1, hsa-mir-378e, hsa-mir-378f, hsa-mir-378g, hsa-mir-378h, hsa-mir-378i, mmu-mir-378b, hsa-mir-378j, mmu-let-7j, mmu-mir-378c, mmu-mir-378d, mmu-let-7k
Figure 4. The ‘extended VCR’ of stratum 2 (shared by Homo and Pelodiscus sequences): (a) miR-16 target site (also shown in Fig. 2e) and nearby target sites for miR-376a, miR-335-3p, miR-493 and miR-379 (the Xenopus sequence contains a 44-bp insertion at the site of the asterisk that includes two target sites for miR-335-3p are shown in red); (b) conserved pair of target sites for miR-320a and miR-182; (c) conserved triplet of target sites for miR-378, miR-99a and miR-30aA notable feature of stratum 2 is a pair of complementary sequences, 800 nucleotides apart, that are predicted to form the stems of a strong double helix (18 bp, –32.3 kcal/mol).
[score:11]
Figure 4. The ‘extended VCR’ of stratum 2 (shared by Homo and Pelodiscus sequences): (a) miR-16 target site (also shown in Fig. 2e) and nearby target sites for miR-376a, miR-335-3p, miR-493 and miR-379 (the Xenopus sequence contains a 44-bp insertion at the site of the asterisk that includes two target sites for miR-335-3p are shown in red); (b) conserved pair of target sites for miR-320a and miR-182; (c) conserved triplet of target sites for miR-378, miR-99a and miR-30a A notable feature of stratum 2 is a pair of complementary sequences, 800 nucleotides apart, that are predicted to form the stems of a strong double helix (18 bp, –32.3 kcal/mol).
[score:11]
The 4.8-kb gigaloop is a putative structure formed by pairing of VCR and a complementary sequence (cVCR) Figure 2. Conserved sequences of stratum 1 (shared by Homo and Callorhinchus IGF1R 3'-UTRs): (a) the 3' end of the long IGF1R transcript; (b) a miR-7-3p target site that has been lost from the Pelodiscus sequence; (c) let-7-3p target site; (d) miR-186 target site; (e) The VCR with predicted binding sites for miR-376c, miR-675 (derived from the imprinted H19 RNA) and miR-16.
[score:7]
The VCR contains a target site for miR-675 [13], a target site for the miR-16 family of microRNAs [24, 25] and a target site for miR-376c [26].
[score:7]
The miR-675 and miR-16 target sites are proximal to the polyadenylation site and thus included within the short transcript.
[score:3]
Although the facile alignment of Homo and Callorhinchus 3’-UTRs ends shortly after the miR-16 binding site of the VCR at the location of the polyadenylation site for the short human transcript (Fig. 2e), strong similarity continues beyond this point for Homo, Mono delphis, Pelodiscus and Xenopus sequences.
[score:1]
[1 to 20 of 6 sentences]
|
43 |
![]()
Other miRNAs from this paper: hsa-let-7b, hsa-let-7d, hsa-mir-21, hsa-mir-24-1, hsa-mir-24-2, hsa-mir-92a-1, hsa-mir-92a-2, hsa-mir-16-2, hsa-mir-15b, hsa-mir-150, hsa-mir-155, hsa-mir-342, hsa-mir-339, hsa-mir-523, hsa-mir-92b
Moreover, we compared the difference in let-7b, let-7d, miR-150, miR-339, miR-342, and miR-523 expression between AML patients and healthy controls and obtained the same differences in their expression regardless of whether cel-miR-39 or miR-16 was used as the normalizer (Figure 3), which further supports that miR-16 is a stable reference in this study.
[score:4]
MiR-150 (A, B) and miR-342 (C, D) expression levels were assessed by qRT-PCR and normalized by cel-miR-39 and hsa-miR-16 respectively in healthy controls and Acute Myeloid Leukemia patients.
[score:3]
The change in candidate miRNAs for the AML patients versus the healthy controls is shown in Figure 1. These data have been normalized by the expression level of miR-16, a wi dely used endogenous reference miRNA that was also confirmed to be unchanged in our experiments (TLDA cards).
[score:3]
We measured the expression of cel-miR-39, miR-16 and the validated differentially expressed microRNAs in AML patients (diagnosis and complete remission) and healthy controls.
[score:3]
All RNA samples were analyzed for miR-16 expression, a stable endogenous reference miRNA, to assess an approximate yield of RNA extraction and to ensure that comparable amounts of starting material were used in each reverse transcription reaction [22, 28- 31].
[score:3]
Figure 2 miR-16 expression level is stable in both healthy controls and AML patients.
[score:3]
Due to a lack of generally accepted standards, all qRT-PCR data on single miRNA expression were analyzed as unadjusted Ct values and standardized to miR-16.
[score:3]
MiR-16 expression levels were assessed by qRT-PCR and normalized by cel-miR-39.
[score:3]
Figure 3 Relative plasma miR-150 and miR-342 expression levels normalized by cel-miR-39 and hsa-miR-16.
[score:3]
The expression level of these two microRNAs was normalized to miR-16.
[score:3]
Afterwards, the expression of the validated microRNAs in AML patients and healthy controls was compared with miR-16 and cel-miR-39 normalizers, respectively.
[score:2]
After the preamplification step, the products were diluted with RNase-free water, combined with TaqMan gene expression Master Mix and then loaded into TaqMan Human MicroRNA Array A (#4398965; Applied Biosystems), which is a 384-well formatted plate and real-time PCR -based microfluidic card with embedded TaqMan primers and probes in each well for the 380 different mature human miRNAs; MiR-16 transcript was used as a normalization signal.
[score:2]
In addition, as cel-miR-39, miR-16 is stable (Figure 2).
[score:1]
In our study, miR-16 was used as an internal control for plasma miRNA quantification as is the case of other studies carried out on different tumors, including CRC [25] breast cancer [37] ovarian cancer [38] where miR-16 was present in plasma/serum at similar levels across normal controls and patients.
[score:1]
Recently, it has been reported that microRNAs are circulating in serum/plasma [20, 21] and tumor-derived microRNAs such as miR-155, miR-21, miR-15b, miR-16 and miR-24 have been detected in the plasma and sera of tumor-bearing patients [22, 23].
[score:1]
[1 to 20 of 15 sentences]
|
44 |
![]()
Other miRNAs from this paper: hsa-mir-21, hsa-mir-26b, hsa-mir-29a, hsa-mir-29b-1, hsa-mir-29b-2, hsa-mir-16-2, hsa-mir-10a, hsa-mir-134, hsa-mir-29c, hsa-mir-20b
Furthermore the expression of miR-16 in noradrenergic cells has been described to reduce the expression of SERT in these cells as an important factor in the serotonin-metabolism and the pathophysiology of depressive and other psychiatric disorders [39].
[score:5]
Likewise, miR-16 has been associated with depressive disorder, especially being integrated in the regulation of the de novo expression of serotonin transporter (SERT) [39].
[score:4]
The expression levels of miR-16 and miR-134 showed a non-significant tendency to change across the procedure.
[score:3]
Furthermore, the miR-16 family appears to be associated with several different types of cancer, and it is suggested to be possibly useful as biomarker in whole blood, serum, plasma, urine or tissue, for those cancer diseases [40].
[score:3]
For miR-16 the changes of were close to the significance level (p [Friedman] = 0.059) and, hence, the median expression level at T5 (ΔCT = −0.75) was likely higher compared to T9 (ΔCT = 0.00).
[score:2]
Baudry, A., Mouillet-Richard, S., Schneider, B., Launay, J. -M. & Kellermann, O. MiR-16 Targets the Serotonin Transporter: A New Facet for Adaptive Responses to Antidepressants.
[score:2]
In the study of Honda et al., the concentrations of miR-16, miR-20b, miR-26b and miR-29a assessed in whole blood were increased in healthy male students who perceived chronic mental stress due to an upcoming examination as a psychological stressor [22].
[score:1]
However, 6 miRNAs (miR-16; -20b; -21; -26b; -29a and -134) could be detected reliably and changes in their concentration levels could be analyzed across the test procedure.
[score:1]
Previously, miR-16 and miR-26b had been reported to be associated with psychological stress responses or psychiatric disorders [38].
[score:1]
T1 T5 T8 T9 d Cortisol (μg/dl)**0.190.11–0.220.230.13–0.48T10.240.12–0.410.180.11–0.29T5, T8 0.8216 α-Amylase (U/ml)***6939–13017894–233T1, T8, T99340–1278035–105 2.5182 miRNA16 (ΔCT)*−0.37−1.14–0.38−0.75−1.83–0.53−0.17−0.66–0.530.00−0.49–0.55T5 0.6796miRNA20b (ΔCT) [##]2.741.26–5.222.111.
[score:1]
While in the study of Honda et al. stress-responsive changes in miR-16 concentration in whole blood were significant, we could detect changes in the concentration of salivary miR-16, which were close to the significance level (p [Friedman] = 0.059).
[score:1]
We found 11 candidates that seemed eligible for this study design: miR-16; -20b; -26b; -29a; -126; -144; -144* 12, 22; -134; -183 [25]; -10a; -21 [23] (Table 1).
[score:1]
With respect to the epigenetic parameters, VAS showed weak to moderate negative correlations to the ΔCT-values of miR-16 (r = −0.37, p < 0.001; Fig. 3D) and miR-21 (r = −0.22, p < 0.05; Fig. 3E).
[score:1]
Changes in two miRNAs were not significant but showed trends close to significance: miR-16 (p [Friedman] = 0,059) and miR-134 (p [Skillings-Mack] = 0,068).
[score:1]
Medium effects were also demonstrated for miR-16 (n [post-hoc] = 26, d = 0.6796) and miR-134 (n [post-hoc] = 27, d = 0,6622).
[score:1]
The concentration of miR-16 significantly correlates with the VAS, indicating the increase of miR-16 to be associated to the subjective stress-perception.
[score:1]
Thus, it might that a stress-related increase of miR-16 could affect remo deling processes in association with perceived psychological stress.
[score:1]
Furthermore, miR-26b and miR-16 were positively interrelated, too (r = 0.36, p < 0.001; Fig. 5B).
[score:1]
Interestingly, a possible integration of miR-16 in higher cortical functions – such as coping mechanisms of psychological stress – was already described in current literature; Hunsberger et al. reported an association of miR-16 with stress -associated psychiatric disorders [38].
[score:1]
Of these, miR-20b, -21, and -26b showed significant changes in response to the TSST, while the changes in miR-16 and-134 were only close to significance (Table 3, Fig. 2).
[score:1]
The ΔCT-values of miR-21 were also moderately positive correlated with miR-16 (r = 0.42, p < 0.001; Fig. 5A).
[score:1]
As an answer to our primary research question, we found 6 of the 11 miRNAs tested (miR-16; -20b; -21; -26b; -29a and -134) to be reliably detectable in the exosomal fraction of our subjects’ saliva.
[score:1]
The ΔCT-values of miR-29a strongly correlate with miR-20b (r = 0.62, p < 0.001; Fig. 5E), miR-21 (r = 0.63, p < 0.001; Fig. 5F) and miR-26b (r = 0.71, p < 0.001; Fig. 5G), and weakly to moderately with miR-16 (r = 0.28, p < 0.01; Fig. 5D) and miR-134 (r = 0.33, p < 0.05; Fig. 5H).
[score:1]
[1 to 20 of 23 sentences]
|
45 |
![]()
Other miRNAs from this paper: hsa-mir-15a, hsa-mir-21, hsa-mir-16-2, hsa-mir-34a, hsa-mir-15b, hsa-mir-186, hsa-mir-34b, hsa-mir-34c
Thus, curcumin can induce miR-15a and miR-16 expression and it can probably serve as potential gene therapy targets for Bcl-2 -overexpressing tumors [355].
[score:7]
In breast carcinoma cell lines, it was also found that curcumin was capable to upregulate these miRNA and the use of anti-miRNA15a and anti-miRNA16 promoted a renovation of Bcl-2 expression.
[score:6]
Yang J. Cao Y. Sun J. Zhang Y. Curcumin reduces the expression of Bcl-2 by upregulating miR-15a and miR-16 in MCF-7 cells Med.
[score:6]
Gao S. Yang J. Chen C. Chen J. Ye L. Wang L. Wu J. Xing C. Yu K. Pure curcumin decreases the expression of WT1 by upregulation of miR-15a and miR-16-1 in leukemic cells J. Exp.
[score:6]
Curcumin increased miRNA16 in A549 human lung adenocarcinoma cell line, but promoted a significantly downregulation in miRNA186*.
[score:4]
According to the literature, Bcl-2 is a target of miRNA15a and miRNA16 [354].
[score:3]
Cimmino A. Calin G. A. Fabbri M. Iorio M. V. Ferracin M. Shimizu M. Wojcik S. E. Aqeilan R. I. Zupo S. Dono M. miR-15 and miR-16 induce apoptosis by targeting BCL2 Proc.
[score:3]
[1 to 20 of 7 sentences]
|
46 |
![]()
Other miRNAs from this paper: hsa-let-7a-1, hsa-let-7a-2, hsa-let-7a-3, hsa-let-7b, hsa-let-7c, hsa-let-7d, hsa-let-7e, hsa-let-7f-1, hsa-let-7f-2, hsa-mir-15a, hsa-mir-17, hsa-mir-19a, hsa-mir-21, hsa-mir-24-1, hsa-mir-24-2, hsa-mir-26a-1, hsa-mir-26b, hsa-mir-31, hsa-mir-103a-2, hsa-mir-103a-1, hsa-mir-106a, hsa-mir-16-2, hsa-mir-192, hsa-mir-10a, hsa-mir-34a, hsa-mir-181a-2, hsa-mir-181b-1, hsa-mir-181c, hsa-mir-203a, hsa-mir-181a-1, hsa-mir-221, hsa-mir-222, hsa-mir-200b, hsa-let-7g, hsa-let-7i, hsa-mir-15b, hsa-mir-124-1, hsa-mir-124-2, hsa-mir-124-3, hsa-mir-143, hsa-mir-9-1, hsa-mir-9-2, hsa-mir-9-3, hsa-mir-126, hsa-mir-206, hsa-mir-200c, hsa-mir-155, hsa-mir-181b-2, hsa-mir-106b, hsa-mir-200a, hsa-mir-34b, hsa-mir-34c, hsa-mir-26a-2, hsa-mir-335, hsa-mir-181d, hsa-mir-629, hsa-mir-103b-1, hsa-mir-103b-2, hsa-mir-203b
Loss of miR-15 and miR-16 reflects their tumor-suppressor function via uncontrolled expression of their anti-apoptotic target protein BCL2 in an in vitro mo del as well as in patient specimens of B-CLL (14).
[score:7]
The importance of genetic lesions reducing miR-15/16-1 cluster expression in CLL was furthermore confirmed by the identification of a point mutation located in the 3` flanking region of miR-16 that reduces miR-16 expression in a naturally occurring CLL mouse mo del, the New Zealand black (NZB) mouse, that develops a hematological disorder similar to the human CLL (16).
[score:6]
In fact, the De Maria group demonstrated that, in prostate cancer, miR-15a/miR-16 levels are strongly down-regulated in the vast majority of cases (up to 85% of the analyzed samples) (20).
[score:4]
Even more definitive genetic evidence of the tumor-suppressive effects of miR-15 and miR-16 came recently from the Dalla-Favera lab where miR-15/16 knock-out mice were generated (17).
[score:4]
Furthermore, they also demonstrated that miR-15 and miR-16 are down-regulated in fibroblasts surrounding the prostate tumors.
[score:4]
Increased miR-15 and miR-16 expression in cancer -associated fibroblasts impaired tumor growth and expansion of prostate tumors in xenograft mo dels through the reduced post-transcriptional repression of Fgf-2 and its receptor Fgfr1 (21).
[score:3]
Targeted deletion of miR-15 and miR-16 in mice at the age of 18 months recapitulates the spectrum of CLL -associated lymphoproliferations in humans, including CLL, CD5(+) monoclonal B-cell lymphocytosis, and CD5- non-Hodgkin lymphomas (17).
[score:3]
Interestingly, intraprostatic injection of miRNA antisense RNA oligonucleotide (‘antagomirs’) specific to miR-15a and miR-16 in 6-week-old male BALB/c mice resulted in marked hyperplasia, and knock-down of miR-15a and miR-16 promoted survival, proliferation, and invasiveness of untransformed prostate cells, which became tumorigenic in immunodeficient NOD-SCID mice (20).
[score:2]
We identified that the miR-15 and miR-16 genomic locus is heterozygously deleted in 68% of all patients with B-cell chronic lymphocytic leukemia (CLL) (13).
[score:1]
[1 to 20 of 9 sentences]
|
47 |
![]()
Other miRNAs from this paper: hsa-mir-16-2, hsa-mir-30d, hsa-mir-203a, hsa-mir-145, hsa-mir-126, hsa-mir-296, hsa-mir-451a, hsa-mir-203b
Expression profiling of human airway biopsies has showed miR-16 to be highly expressed, leading to the hypothesis that miR-16 along with other miRNAs may have a significant influence on gene expression in the airways [38].
[score:7]
miRNA (red circle) and validated miRNA targeted genes (light magenta circles) predicted by miRTarbase 6.1 in Cytoscape CyTargetLinker with miR-16 having a central connection to other miRNA in the gene network.
[score:5]
In addition to its central effect on downstream gene expression, miR-16 mimics result in decreased airway smooth muscle growth.
[score:3]
Based on our prior miRNA sequencing of human airway smooth muscle cells, [28] of the miRNAs in the PC [20] network (Fig 2), two, miR-16-5p and miR-30d-5p, are significantly expressed.
[score:3]
Our network analysis demonstrated that miR-16 plays a key role as the central hub, both interacting with other miRNAs and mediating expression of dozens of genes (Fig 2).
[score:3]
miR-16-5p was also significant in our study and differential expression of this miRNA in asthmatic airway cells has been reported [37].
[score:3]
miR-16-5p and -30d-5p regulate airway smooth muscle phenotypes critically involved in asthma pathogenesis, supporting a mechanistic link to these findings.
[score:2]
These miRNA appear to be associated with individual and pathway evidence of immune modulation that could affect AHR; complementary functional validation of miR-16-5p and miR-30d-5p in HASM demonstrate effects on cell growth and diameter, respectively.
[score:1]
For the miR-16 and miR-30d experiments, the p-value is 0.0009 and 0.03, respectively.
[score:1]
0180329.g005 Fig 5 HASM cells were transfected with 10 nM of either scramble control or miR-16-5p mimic (left panel; or miR-30d-5p in right panel).
[score:1]
of miR-16-5p and miR-30d-5p in human airway smooth muscle cells (HASM) demonstrated effects on cell growth and average cell diameter, respectively, supporting a mechanistic link to these findings.
[score:1]
As noted above, miR-16 also appears to be a central hub in our serum microRNA network and may work in concert with other miRNA to modulate immune pathways and subsequently AHR.
[score:1]
Thus, miR-16 appears to play a notable role in the modulation of genes influencing airways hyperresponsiveness in asthma.
[score:1]
Pathway analysis revealed miR-16-5p as a network hub, and involvement of multiple miRNAs interacting with genes in the FoxO and Hippo signaling pathways by KEGG analysis.
[score:1]
HASM cells were transfected with 10 nM of either scramble control or miR-16-5p mimic (left panel; or miR-30d-5p in right panel).
[score:1]
[1 to 20 of 15 sentences]
|
48 |
![]()
Other miRNAs from this paper: hsa-let-7c, hsa-let-7d, hsa-mir-21, hsa-mir-24-1, hsa-mir-24-2, hsa-mir-28, hsa-mir-29a, hsa-mir-30a, hsa-mir-31, hsa-mir-99a, hsa-mir-101-1, hsa-mir-16-2, mmu-let-7g, mmu-let-7i, mmu-mir-27b, mmu-mir-30a, mmu-mir-99a, mmu-mir-101a, mmu-mir-125b-2, mmu-mir-126a, mmu-mir-128-1, mmu-mir-9-2, mmu-mir-142a, mmu-mir-144, mmu-mir-145a, mmu-mir-151, mmu-mir-152, mmu-mir-185, mmu-mir-186, mmu-mir-24-1, mmu-mir-203, mmu-mir-205, hsa-mir-148a, hsa-mir-34a, hsa-mir-203a, hsa-mir-205, hsa-mir-210, hsa-mir-221, mmu-mir-301a, mmu-let-7d, hsa-let-7g, hsa-let-7i, hsa-mir-27b, hsa-mir-125b-1, hsa-mir-128-1, hsa-mir-142, hsa-mir-144, hsa-mir-145, hsa-mir-152, hsa-mir-9-1, hsa-mir-9-2, hsa-mir-9-3, hsa-mir-125b-2, hsa-mir-126, hsa-mir-185, hsa-mir-186, mmu-mir-148a, mmu-mir-200a, mmu-let-7c-1, mmu-let-7c-2, mmu-mir-16-1, mmu-mir-16-2, mmu-mir-21a, mmu-mir-24-2, mmu-mir-29a, mmu-mir-31, mmu-mir-34a, mmu-mir-148b, mmu-mir-339, mmu-mir-101b, mmu-mir-28a, mmu-mir-210, mmu-mir-221, mmu-mir-9-1, mmu-mir-9-3, mmu-mir-125b-1, mmu-mir-128-2, hsa-mir-128-2, hsa-mir-200a, hsa-mir-101-2, hsa-mir-301a, hsa-mir-151a, hsa-mir-148b, hsa-mir-339, hsa-mir-335, mmu-mir-335, hsa-mir-449a, mmu-mir-449a, hsa-mir-450a-1, mmu-mir-450a-1, hsa-mir-486-1, hsa-mir-146b, hsa-mir-450a-2, hsa-mir-503, mmu-mir-486a, mmu-mir-542, mmu-mir-450a-2, mmu-mir-503, hsa-mir-542, hsa-mir-151b, mmu-mir-301b, mmu-mir-146b, mmu-mir-708, hsa-mir-708, hsa-mir-301b, hsa-mir-1246, hsa-mir-1277, hsa-mir-1307, hsa-mir-2115, mmu-mir-486b, mmu-mir-28c, mmu-mir-101c, mmu-mir-28b, hsa-mir-203b, hsa-mir-5680, hsa-mir-5681a, mmu-mir-145b, mmu-mir-21b, mmu-mir-21c, hsa-mir-486-2, mmu-mir-126b, mmu-mir-142b, mmu-mir-9b-2, mmu-mir-9b-1, mmu-mir-9b-3
Of the miRNAs found to be down-regulated in the metastatic xenografts, miR-16, showing a >17-fold decrease in expression, has been reported to be down-regulated in prostate cancer [23], [24] and to have a metastasis-suppressing function.
[score:11]
Of the down-regulated miRNAs a number have been reported to be down-regulated in prostate cancer relative to benign prostate tissues, i. e. miR-16 [23]– [25], miR-24 [26]– [28], miR-29a [26], miR-145 [23], [24], [27], [29], [30], and miR-205 [24], [31], [32].
[score:7]
The down-regulation of miR-16 [25], miR-34a [33], miR-126* [34], miR-145 [35] and miR-205 [36] correlated with the development of prostate cancer metastasis.
[score:5]
Thus some of the miRNAs have already been linked to this phenomenon, in particular down-regulated miRNAs such as miR-16, miR-34a, miR-126*, miR-145 and miR-205, supporting the validity of our analytical approach.
[score:4]
A number of these miRNAs (21/104) have previously been reported to show similar down- or up-regulation in prostate cancers relative to normal prostate tissue, and some of them (e. g., miR-16, miR-34a, miR-126*, miR-145, miR-205) have been linked to prostate cancer metastasis, supporting the validity of the analytical approach.
[score:4]
Moreover, metastatic prostate tumor growth in vivo could be inhibited by systemic delivery of synthetic miRNA-16 [25].
[score:3]
[1 to 20 of 6 sentences]
|
49 |
![]()
Other miRNAs from this paper: hsa-let-7a-1, hsa-let-7a-2, hsa-let-7a-3, hsa-let-7b, hsa-let-7c, hsa-let-7d, hsa-let-7e, hsa-let-7f-1, hsa-let-7f-2, hsa-mir-15a, hsa-mir-17, hsa-mir-21, hsa-mir-24-1, hsa-mir-24-2, hsa-mir-26a-1, hsa-mir-26b, hsa-mir-27a, hsa-mir-29a, hsa-mir-30a, hsa-mir-98, hsa-mir-101-1, hsa-mir-29b-1, hsa-mir-29b-2, hsa-mir-106a, hsa-mir-107, hsa-mir-16-2, hsa-mir-198, hsa-mir-148a, hsa-mir-30d, hsa-mir-7-1, hsa-mir-7-2, hsa-mir-7-3, hsa-mir-34a, hsa-mir-181a-2, hsa-mir-181c, hsa-mir-182, hsa-mir-183, hsa-mir-205, hsa-mir-210, hsa-mir-181a-1, hsa-mir-222, hsa-mir-224, hsa-mir-200b, hsa-let-7g, hsa-let-7i, hsa-mir-23b, hsa-mir-27b, hsa-mir-124-1, hsa-mir-124-2, hsa-mir-124-3, hsa-mir-125b-1, hsa-mir-128-1, hsa-mir-132, hsa-mir-137, hsa-mir-140, hsa-mir-141, hsa-mir-142, hsa-mir-143, hsa-mir-144, hsa-mir-153-1, hsa-mir-153-2, hsa-mir-9-1, hsa-mir-9-2, hsa-mir-9-3, hsa-mir-125a, hsa-mir-125b-2, hsa-mir-126, hsa-mir-134, hsa-mir-136, hsa-mir-146a, hsa-mir-150, hsa-mir-184, hsa-mir-185, hsa-mir-186, hsa-mir-206, hsa-mir-320a, hsa-mir-200c, hsa-mir-128-2, hsa-mir-200a, hsa-mir-101-2, hsa-mir-34b, hsa-mir-34c, hsa-mir-299, hsa-mir-26a-2, hsa-mir-373, hsa-mir-376a-1, hsa-mir-342, hsa-mir-133b, hsa-mir-424, hsa-mir-429, hsa-mir-433, hsa-mir-451a, hsa-mir-146b, hsa-mir-494, hsa-mir-193b, hsa-mir-455, hsa-mir-376a-2, hsa-mir-33b, hsa-mir-644a, hsa-mir-548d-1, hsa-mir-548d-2, hsa-mir-320b-1, hsa-mir-320c-1, hsa-mir-320b-2, hsa-mir-301b, hsa-mir-320d-1, hsa-mir-320c-2, hsa-mir-320d-2, hsa-mir-320e, hsa-mir-3613, hsa-mir-4668, hsa-mir-4674, hsa-mir-6722
During the preclinical phase of prion disease, a cluster of genes and miRNAs are dysregulated, such as miRNA-132-3p, miRNA-124a-3p, miRNA-16-5p, miRNA-26a-5p, miRNa-29a-3p, and miRNA-140-5p, and they follow associated patterns of expression (Majer et al., 2012).
[score:6]
Recently, Burak et al. (2018) demonstrated that miRNA-16 localized within the CA1 region of the hippocampus was upregulated in the early stage of prion infection.
[score:4]
MicroRNA-16 targets mRNA involved in neurite extension and branching in hippocampal neurons during presymptomatic prion disease.
[score:4]
Similarly, Miller et al. (2013) also showed the upregulation of miRNA-16 in PD patients.
[score:4]
It is observed that miRNA-16 restores BDNF levels by downregulating p13-Akt-mTOR pathway (Yang et al., 2017).
[score:4]
Similarly, many researchers found that the amyloid precursor protein (APP) expression is also influenced by miRNA-101, miRNA-16, miRNA-106a, and miRNA-644 (Patel et al., 2008; Delay et al., 2011; Long and Lahiri, 2011; Liu et al., 2012).
[score:3]
The novel targets of miRNA-16 were APP, BCL2, MAPK, and ERK.
[score:3]
MicroRNA-16 targets amyloid precursor protein to potentially modulate Alzheimer’s -associated pathogenesis in SAMP8 mice.
[score:2]
They showed that miRNA-16 plays a crucial role in neurite growth and branching (Burak et al., 2018).
[score:1]
The role of miRNA-16 in reversing autophagic and apoptotic changes during chronic stress are studied recently in a rat mo del of chronic stress.
[score:1]
miR-16 and fluoxetine both reverse autophagic and apoptotic change in chronic unpredictable mild stress mo del rats.
[score:1]
[1 to 20 of 11 sentences]
|
50 |
![]()
Other miRNAs from this paper: hsa-mir-15a, hsa-mir-17, hsa-mir-21, hsa-mir-26a-1, hsa-mir-27a, hsa-mir-29a, hsa-mir-99a, hsa-mir-106a, hsa-mir-16-2, hsa-mir-196a-1, hsa-mir-197, hsa-mir-199a-1, hsa-mir-148a, hsa-mir-10a, hsa-mir-196a-2, hsa-mir-199a-2, hsa-mir-199b, hsa-mir-203a, hsa-mir-205, hsa-mir-214, hsa-mir-15b, hsa-mir-132, hsa-mir-133a-1, hsa-mir-133a-2, hsa-mir-142, hsa-mir-143, hsa-mir-145, hsa-mir-9-1, hsa-mir-9-2, hsa-mir-9-3, hsa-mir-126, hsa-mir-127, hsa-mir-146a, hsa-mir-149, hsa-mir-155, hsa-mir-200a, hsa-mir-26a-2, hsa-mir-302b, hsa-mir-372, hsa-mir-373, hsa-mir-133b, hsa-mir-512-1, hsa-mir-512-2, hsa-mir-521-2, hsa-mir-521-1, hsa-mir-522, hsa-mir-513a-1, hsa-mir-513a-2, hsa-mir-513b, hsa-mir-513c, hsa-mir-203b
Also, miR-16 is deleted or down-regulated in Chronic Lymphocytic Leukemia and miR-205 is located in a chromosomal region, which is amplified in lung cancer and is down-regulated in human prostate cancer.
[score:7]
The authors showed that miR-126, miR-143 and miR-145 were down-regulated and miR-15b, miR-16, mi-146 and miR-155 were up-regulated.
[score:7]
Among the miRNAs that were down-regulated between normal and pre-neoplasic cervical samples, but had increased expression in cervical cancer samples, were miR-106a, miR-205, miR-197, miR-16, miR-27a and miR-142-5p.
[score:6]
Our data set suggests that miR-16 and miR-205 may have an oncogenic role or at least they seem to promote abnormal cell growth in basal epithelial cells since they are down-regulated in CINI and CINIII compared with normal cervical tissue and are up-regulated in cervical samples.
[score:6]
Six miRNAs displayed relative decreased expression in the transition from normal cervix to atypical dysplasia and increased expression in the transition from atypical dysplasia to cervical carcinoma, namely miR-106a, miR-205, miR-197, miR-16, miR-27a and miR-142-5p (Figure 4B).
[score:5]
This is supported by the observation that the 13q14 deletion, which is present in more than half of all chronic lymphocytic leukemias (CLL) results in loss of miR-15a and miR-16-1 genes [11].
[score:1]
[1 to 20 of 6 sentences]
|
51 |
![]()
Other miRNAs from this paper: hsa-let-7a-1, hsa-let-7a-2, hsa-let-7a-3, hsa-let-7b, hsa-let-7c, hsa-let-7d, hsa-let-7e, hsa-let-7f-1, hsa-let-7f-2, hsa-mir-15a, hsa-mir-17, hsa-mir-18a, hsa-mir-21, hsa-mir-24-1, hsa-mir-24-2, hsa-mir-25, hsa-mir-27a, hsa-mir-30a, hsa-mir-31, hsa-mir-29b-1, hsa-mir-29b-2, hsa-mir-103a-2, hsa-mir-103a-1, hsa-mir-16-2, mmu-let-7g, mmu-let-7i, mmu-mir-15b, mmu-mir-29b-1, mmu-mir-30a, mmu-mir-30b, mmu-mir-125a, mmu-mir-125b-2, mmu-mir-126a, mmu-mir-127, mmu-mir-9-2, mmu-mir-141, mmu-mir-145a, mmu-mir-155, mmu-mir-10b, mmu-mir-24-1, mmu-mir-205, mmu-mir-206, hsa-mir-30c-2, hsa-mir-30d, mmu-mir-30e, hsa-mir-10b, hsa-mir-34a, hsa-mir-205, hsa-mir-221, mmu-mir-290a, mmu-mir-34c, mmu-mir-34b, mmu-let-7d, mmu-mir-106b, hsa-let-7g, hsa-let-7i, hsa-mir-15b, hsa-mir-30b, hsa-mir-125b-1, hsa-mir-141, hsa-mir-145, hsa-mir-9-1, hsa-mir-9-2, hsa-mir-9-3, hsa-mir-125a, hsa-mir-125b-2, hsa-mir-126, hsa-mir-127, hsa-mir-206, mmu-mir-30c-1, mmu-mir-30c-2, mmu-mir-30d, mmu-let-7a-1, mmu-let-7a-2, mmu-let-7b, mmu-let-7c-1, mmu-let-7c-2, mmu-let-7e, mmu-let-7f-1, mmu-let-7f-2, mmu-mir-15a, mmu-mir-16-1, mmu-mir-16-2, mmu-mir-18a, mmu-mir-21a, mmu-mir-24-2, mmu-mir-27a, mmu-mir-31, mmu-mir-34a, mmu-mir-103-1, mmu-mir-103-2, mmu-mir-322, hsa-mir-200c, hsa-mir-155, mmu-mir-17, mmu-mir-25, mmu-mir-200c, mmu-mir-221, mmu-mir-29b-2, mmu-mir-9-1, mmu-mir-9-3, mmu-mir-125b-1, hsa-mir-106b, hsa-mir-30c-1, hsa-mir-34b, hsa-mir-34c, hsa-mir-30e, hsa-mir-373, hsa-mir-20b, hsa-mir-520c, hsa-mir-503, mmu-mir-20b, mmu-mir-503, hsa-mir-103b-1, hsa-mir-103b-2, mmu-mir-145b, mmu-mir-21b, mmu-let-7j, mmu-mir-21c, mmu-mir-30f, mmu-let-7k, mmu-mir-126b, mmu-mir-290b, mmu-mir-9b-2, mmu-mir-9b-1, mmu-mir-9b-3
The miR-16 family act as tumor suppressors that induce cell cycle arrest at the G1 phase by targeting several cyclin-CDK genes including CDK6, cyclin D1, cyclin D3, E2F3 and WEE1 and all the miRNAs in this family are downregulated in a wide variety of tumors [136].
[score:8]
Wang F. Fu X. D. Zhou Y. Zhang Y. Down-regulation of the cyclin e1 oncogene expression by microrna-16–1 induces cell cycle arrest in human cancer cells BMB Rep.
[score:5]
This investigation revealed that miR-21 and miR-29b were significantly up-regulated and miR-15b, miR-16 were significantly down-regulated in breast cancers in both species [131].
[score:5]
Takeshita F. Patrawala L. Osaki M. Takahashi R. U. Yamamoto Y. Kosaka N. Kawamata M. Kelnar K. Bader A. G. Brown D. Systemic delivery of synthetic microrna-16 inhibits the growth of metastatic prostate tumors via downregulation of multiple cell-cycle genes Mol.
[score:5]
Calin G. A. Dumitru C. D. Shimizu M. Bichi R. Zupo S. Noch E. Aldler H. Rattan S. Keating M. Rai K. Frequent deletions and down-regulation of micro- rna genes mir15 and mir16 at 13q14 in chronic lymphocytic leukemia Proc.
[score:4]
Linsley P. S. Schelter J. Burchard J. Kibukawa M. Martin M. M. Bartz S. R. Johnson J. M. Cummins J. M. Raymond C. K. Dai H. Transcripts targeted by the microrna-16 family cooperatively regulate cell cycle progression Mol.
[score:3]
Liu Q. Fu H. Sun F. Zhang H. Tie Y. Zhu J. Xing R. Sun Z. Zheng X. Mir-16 family induces cell cycle arrest by regulating multiple cell cycle genes Nucleic Acids Res.
[score:1]
[1 to 20 of 7 sentences]
|
52 |
![]()
Other miRNAs from this paper: hsa-mir-17, hsa-mir-20a, hsa-mir-21, hsa-mir-23a, hsa-mir-16-2, hsa-mir-27b, hsa-mir-146a
In addition to targeting CCND3, hsa-miR-16-5p is also known to regulate the expression of various angiogenic (e. g., PTGS2, VEGF, FGFR) and/or carcinogenic factors (e. g. EGFR, BMP7, MAPKs) with key roles in cancer/disease signaling pathways (Fig 5B).
[score:8]
The expression of some downregulated miRNAs including hsa-miR-16-5p, despite their low statistical significance, were consistent with and also showed coordinated changes with respect to significantly dysregulated lncRNAs (Fig 5B).
[score:7]
In fact, some of the miRNAs (e. g., ↑hsa-miR-20a-5p, ↑hsa-miR-21-5p, ↑hsa-miR-23a-5p, ↓hsa-miR-16-5p) and their mRNA targets aberrantly expressed in exposed workers are known to play critical roles in cell proliferation, apoptosis, tumor invasiveness and tumorigenesis as well as the pathogenesis of cancer including and NSCLC [103, 112– 120].
[score:5]
The up-regulation of CCND3 is further corroborated by the decreased levels of hsa-miR-16-5p in MWCNT-exposed workers (albeit with a p-value > 0.05).
[score:4]
Some of the selected genes (e. g., CCND1, E2F2, CCND3) are known targets of the miR-16-5p or other dysregulated miRNAs belonging to the oncogenic miR-17-92 family in MWCNT-exposed workers.
[score:4]
The hsa-miR-16-5p was located in the central position with most of the target mRNAs.
[score:3]
[1 to 20 of 6 sentences]
|
53 |
![]()
Other miRNAs from this paper: hsa-mir-16-2, rno-mir-16
Analysis of the average expression level of each small ncRNA, relative to the standard pool, confirmed that little variation was present in U6 snRNA, miR-16, U87, and 4.5S RNA (H) “Variant 1” expression.
[score:5]
However, the lower degree of variability observed in expression levels of U6 snRNA and miR-16 suggest they may be more appropriate for use in normalizing miRNA expression levels.
[score:5]
Expression of five small ncRNAs (U6 snRNA, miR-16, U87, 4.5S RNA (H) “Variant 1”, and 5S ribosomal RNA [rRNA]) were tested on a standard RNA pool and representative retinal samples from P5, P6, P9, and P14 from room air– and cyclic hyperoxia–exposed rats using reverse transcription (RT)-qPCR, to assess the effect of developmental stage and exposure to fluctuations in oxygen levels, respectively.
[score:4]
We conclude that U6 snRNA and miR-16 are the most suitable reference RNAs for normalizing miRNA expression, as they are relatively stable with strain, exposure to cyclic hyperoxia, and developmental stage in a rat mo del of OIR.
[score:4]
Taken together, the data suggest that from the limited number of rat-reactive small ncRNA control TaqMan assays available U6 snRNA and miR-16 are most suitable for normalizing miRNA expression in rat mo dels of OIR, as these reference genes are relatively stable with strain, exposure to cyclic hyperoxia, and developmental stage.
[score:3]
Expression of U87, miR-16, and 4.5S RNA (H) “Variant 1” was somewhat variable with exposure to cyclic hyperoxia, although not to the same extent as for 5S rRNA.
[score:3]
In comparison, miR-16 showed less stable average expression with changes in oxygen levels and between rat strains compared with U6 snRNA.
[score:2]
U6 snRNA, miR-16, U87, 4.5S RNA (H) “Variant 1”, and 5S rRNA were chosen for further analysis, as the expression levels of these small ncRNAs were adequate for determining primer PCR amplification efficiencies.
[score:2]
Levels of U6 snRNA and miR-16 showed slight increases with increasing developmental age; however, these differences were not statistically significant (Figure 1).
[score:2]
MiR-16 showed less stable expression with changes in oxygen levels and between strains compared to U6 snRNA.
[score:1]
[1 to 20 of 10 sentences]
|
54 |
![]()
Other miRNAs from this paper: hsa-let-7b, hsa-mir-15a, hsa-mir-20a, hsa-mir-26a-1, hsa-mir-29a, hsa-mir-93, hsa-mir-103a-2, hsa-mir-103a-1, hsa-mir-107, hsa-mir-16-2, hsa-mir-208a, hsa-mir-15b, hsa-mir-23b, hsa-mir-150, hsa-mir-195, hsa-mir-26a-2, hsa-mir-370, hsa-mir-326, hsa-mir-424, hsa-mir-497, hsa-mir-522, hsa-mir-503, hsa-mir-532, hsa-mir-628, hsa-mir-646, hsa-mir-103b-1, hsa-mir-103b-2, hsa-mir-5739
Tijsen et al. (2014[155]) also demonstrated that when mice were injected subcutaneously with locked nucleic acid (LNA) -based antimiR-15b, the loss of the miR-15 family members (miR-15-5p, miR-16-5p, miR-195-5p, miR-322 (mouse homolog to human miR-424-5p), and miR-497-5p resulted in a significant up-regulation of TGFβR1 and SMAD3 mRNA, and a trend towards up-regulation of p38, TGFβR2, TGFβR3, SMAD4, SMAD7, and endoglin mRNA.
[score:7]
Although Tijsen et al. (2014[155]) demonstrated that multiple miR-15/107 family members, including miR-16-5p, were up-regulated in human diseased heart samples they did not investigate whether or not endoglin mRNA and/or protein levels were reduced in these samples, especially since their TargetScan analyses suggested that human endoglin would not be regulated by this miRNA family.
[score:7]
The miR-15/107 family includes miR-15a-5p, miR-15b-5p, miR-16-5p, miR-103-3p, miR-107 (which are expressed in all vertebrates), miR-195-5p, miR-424-5p, miR-497-5p, miR-503-5p (which are expressed in mammals), and miR-646 (human specific) (Finnerty et al., 2010[53]).
[score:5]
7) (References in Table 7: let-7b-5p: Selbach et al., 2008[145]; miR-16-5p: Balakrishnan et al., 2014[14]; miR-20a-3p: Balakrishnan et al., 2014[14]; miR-23b-5p: Balakrishnan et al., 2014[14]; miR-29a-5p: Balakrishnan et al., 2014[14]; miR-103a-3p: Balakrishnan et al., 2014[14]; miR-107: Balakrishnan et al., 2014[14]; miR-532-5p: Haecker et al., 2012[63]; miR-628-5p: Balakrishnan et al., 2014[14]; miR-522-3p: Tan et al., 2014[153]) documents ten human experimentally supported miRNA/endoglin mRNA interactions, and the methodology utilized to substantiate the interaction, the tissue and/or cell line used for experimentation, the location of the MRE if known, the type of interaction (direct or indirect), and the literature reference.
[score:3]
7) (miR-16-5p and miR-628-5p) were predicted to interact with human endoglin mRNAs by the Diana-microT-CDS algorithm.
[score:1]
It is now clear that miR-16-5p, miR-103-3p, and miR-107 belong to a group of paralogous, evolutionarily-conserved miRNAs termed the miR-15/107 family (Finnerty et al., 2010[53]).
[score:1]
This algorithm computed that the human S-endoglin mRNA isoform harbors three miR-16-5p MREs, one site was identified (5′ GCUGCU 3′, 6mer “seed” region) in the 3′-UTR, 842 nts downstream from the stop codon and two additional sites were identified in the CDS (5′ UGCUGCU 3′, 7mer “seed” region), 34 and 473 nts downstream from the start codon.
[score:1]
Additionally, the Diana-microT-CDS algorithm predicted that human S-endoglin mRNAs harbor three miR-16-5p MREs, one 3′-UTR and two CDS interaction sites (Table 7 (Tab.
[score:1]
Again, it is important to note that the miR-15/107 family members, miR-16-5p, miR-103a-3p, and miR-107 were identified to interact with human endoglin mRNAs by the HITS-CLIP technique (Table 7 (Tab.
[score:1]
Importantly this group of miRNAs shares a sequence (5′ AGCAGC 3′) near the 5′ end that complements with the Diana-microT-CDS algorithm predicted miR-16-5p MREs (5′ GCUGCU 3′) and the manually identified miR-103-3p and miR-107 MREs within the human S-endoglin mRNA.
[score:1]
7)), including the 3′-UTR miR-16-5p or miR-628-5p MRE.
[score:1]
Finally, sequence analysis detected three identical miR-103-3p and miR-107 MREs harbored in the human S-endoglin mRNA which overlaped with the three Diana-microT-CDS algorithm predicted miR-16-5p MREs above (3′-UTR MRE [5′ GCUGCU 3′, 6mer “seed” region] 842 nts downstream from the stop codon and two CDS MREs [5′ UGCUGCU 3′, 7mer “seed” region] 34 and 473 nts downstream from the start codon).
[score:1]
[1 to 20 of 12 sentences]
|
55 |
![]()
Other miRNAs from this paper: hsa-let-7a-1, hsa-let-7a-2, hsa-let-7a-3, hsa-let-7b, hsa-let-7c, hsa-let-7d, hsa-let-7e, hsa-let-7f-1, hsa-let-7f-2, hsa-mir-15a, hsa-mir-21, hsa-mir-26a-1, hsa-mir-29a, hsa-mir-98, hsa-mir-101-1, hsa-mir-29b-1, hsa-mir-29b-2, hsa-mir-16-2, hsa-mir-196a-1, hsa-mir-148a, hsa-mir-139, hsa-mir-10b, hsa-mir-34a, hsa-mir-181b-1, hsa-mir-181c, hsa-mir-196a-2, hsa-mir-203a, hsa-mir-205, hsa-mir-212, hsa-mir-214, hsa-mir-224, hsa-mir-200b, hsa-let-7g, hsa-let-7i, hsa-mir-15b, hsa-mir-124-1, hsa-mir-124-2, hsa-mir-124-3, hsa-mir-125b-1, hsa-mir-137, hsa-mir-141, hsa-mir-143, hsa-mir-144, hsa-mir-152, hsa-mir-9-1, hsa-mir-9-2, hsa-mir-9-3, hsa-mir-125b-2, hsa-mir-127, hsa-mir-129-2, hsa-mir-185, hsa-mir-200c, hsa-mir-155, hsa-mir-181b-2, hsa-mir-29c, hsa-mir-200a, hsa-mir-101-2, hsa-mir-34b, hsa-mir-34c, hsa-mir-26a-2, hsa-mir-342, hsa-mir-196b, hsa-mir-429, hsa-mir-449a, hsa-mir-494, hsa-mir-519d, hsa-mir-449b, hsa-mir-449c, hsa-mir-708, hsa-mir-941-1, hsa-mir-941-2, hsa-mir-941-3, hsa-mir-941-4, hsa-mir-1237, hsa-mir-1247, hsa-mir-203b, hsa-mir-941-5
The first report of altered miRNA expression in cancer was related to the frequent chromosomal deletion and downregulated expression of miR-15 and miR-16, two miRNAs thought to target the antiapoptotic factor B cell lymphoma 2 (BCL2) in chronic lymphocytic leukemia (CLL; Calin et al., 2002).
[score:10]
It is well documented that loss of miR-15a and miR-16 in CLL is associated with 13q loss; however, these miRNAs are also often downregulated in CLL samples without observable deletions in 13q, and Sampath et al. (2012) found that overexpression of HDACs (HDAC1, HDAC2, and HDAC3) is associated with downregulation of miR-15a, miR-16, and miR-29b.
[score:9]
Frequent deletions and down-regulation of micro -RNA genes miR15 and miR16 at 13q14 in chronic lymphocytic leukemia.
[score:4]
Myc represses miR-15a/miR-16-1 expression through recruitment of HDAC3 in mantle cell and other non-Hodgkin B-cell lymphomas.
[score:3]
In another study, MYC interacted with HDAC3, which then colocalized to the promoters of miR-15a/miR-16-1 and their host gene DLEU2, resulting in MYC -induced suppression of these miRNAs in mantle cell lymphoma (Zhang et al., 2012a).
[score:3]
Histone deacetylases mediate the silencing of miR-15a, miR-16, and miR-29b in chronic lymphocytic leukemia.
[score:1]
[1 to 20 of 6 sentences]
|
56 |
![]()
Other miRNAs from this paper: hsa-let-7a-1, hsa-let-7a-2, hsa-let-7a-3, hsa-let-7b, hsa-let-7c, hsa-let-7d, hsa-let-7e, hsa-let-7f-1, hsa-let-7f-2, hsa-mir-15a, hsa-mir-21, hsa-mir-26a-1, hsa-mir-26b, hsa-mir-28, hsa-mir-30a, hsa-mir-99a, hsa-mir-100, hsa-mir-101-1, hsa-mir-29b-1, hsa-mir-29b-2, hsa-mir-16-2, hsa-mir-30c-2, hsa-mir-30d, hsa-mir-221, hsa-let-7g, hsa-let-7i, hsa-mir-1-2, hsa-mir-30b, hsa-mir-130a, hsa-mir-133a-1, hsa-mir-133a-2, hsa-mir-135a-1, hsa-mir-135a-2, hsa-mir-140, hsa-mir-142, hsa-mir-126, hsa-mir-150, hsa-mir-1-1, hsa-mir-155, hsa-mir-29c, hsa-mir-30c-1, hsa-mir-101-2, hsa-mir-34b, hsa-mir-30e, hsa-mir-26a-2, hsa-mir-342, hsa-mir-151a, hsa-mir-135b, hsa-mir-151b
Using 15 down-regulated miRNAs (let-7 g, miR-101, miR-133a, miR-150, miR-15a, miR-16, miR-29b, miR-29c, miR-30a, miR-30b, miR-30c, miR-30d, miR-30e, miR-34b and miR-342), known to be associated with cancer, we found 16.5% and 11.0% of our PLS-predicted miRNA-targets, on average, were also predicted as targets for the corresponding miRNAs by TargetScan5.1 and miRanda, respectively (Table 2).
[score:10]
We found that ten of the down-regulated miRNAs (miR101, miR26a, miR26b, miR30a, miR30b, miR30d, miR30e, miR34b, miR-let7 g and miRN140) were grouped together in a functional network (Figure 3A) and nine of the down-regulated miRNAs (miR-130a, miR-133a, miR-142, miR-150, miR15a, miR-16, miR-29b, miR-30c and miR-99a) were grouped together in a second network (Figure 3B).
[score:7]
Studies suggest that three of these miRNAs, miR-15a, miR-16 [12, 13] and let-7 [14, 15] can function as tumor suppressors, while miR-155 and miR-21 play roles in oncogenesis [16, 17].
[score:3]
By restricting our attention to only the 15 cancer -associated miRNAs in the top four mRNA networks, we found that all 15 miRNAs were involved in network 1, all but miR-16 were in network 2, and all but miR-29c were in network 3 and 4, as shown in the fourth column of Table 4. We also checked which miRNAs associated with the mRNA targets predicted by PLS regression method were linked to the cancer-related function.
[score:3]
We found that all 15 miRNAs were involved in cancer and tumorigenesis, 12 of them (all except miR-101, miR-15a and miR-29c) were in carcinoma, malignant tumor and primary tumor and 8 of them (all except let-7 g, miR-101, miR-150, miR-15a, miR-16, miR-29c and miR-342) were in angiogenesis as were shown in the last column of Table 5. Furthermore, we examined which associated miRNAs among the 15 cancer-related miRNAs were involved in the canonical pathways associated with cancer.
[score:1]
Networks were also developed for the seven miRNAs (let-7 g, miR-101, miR-133a, miR-15a, miR-16, miR-29b and miR-29c) closely related to cancer and their associated mRNAs (Figure 2C).
[score:1]
C. A sub-network depicting miRNA:mRNA interactions predicted from other cancer -associated miRNAs: let-7 g, miR-101, miR-133a, miR-15a, miR-16, miR-29b and miR-29c.
[score:1]
[1 to 20 of 9 sentences]
|
57 |
![]()
Other miRNAs from this paper: hsa-let-7c, hsa-mir-21, hsa-mir-23a, hsa-mir-16-2, mmu-mir-9-2, mmu-mir-146a, mmu-mir-153, mmu-mir-181a-2, mmu-mir-183, mmu-mir-191, mmu-mir-195a, hsa-mir-181a-2, hsa-mir-181b-1, hsa-mir-181c, hsa-mir-183, hsa-mir-181a-1, hsa-mir-153-1, hsa-mir-153-2, hsa-mir-191, hsa-mir-9-1, hsa-mir-9-2, hsa-mir-9-3, hsa-mir-146a, mmu-let-7c-1, mmu-let-7c-2, mmu-mir-16-1, mmu-mir-16-2, mmu-mir-21a, mmu-mir-23a, hsa-mir-181b-2, mmu-mir-181a-1, mmu-mir-9-1, mmu-mir-9-3, mmu-mir-181b-1, mmu-mir-181c, mmu-mir-181b-2, hsa-mir-181d, mmu-mir-181d, mmu-mir-1195, mmu-mir-2137, mmu-mir-486b, mmu-mir-21b, mmu-mir-21c, mmu-mir-9b-2, mmu-mir-9b-1, mmu-mir-9b-3
Both miR-21-5p and miR-16-5p were downregulated significantly in our study, and this is associated with increased mRNA levels of BCL2 (at 18 h post exposure, Fig. 5b) that may contribute to inhibition of apoptosis and cell proliferation in SP-A2 males, but not in KO males, where the expression of BCL2 did not change (Fig. 5c).
[score:8]
This mRNA is targeted by miR-9-5p [47], miR-21-5p, miR-16-5p (TargetScan), miR-183-5p [47], miR-486b-5p [82], and miR-153-3p [47].
[score:5]
miR-195a-5p that has the same seeding sequence with miR-16-5p, is predicted to bind BCL2 mRNA, and this was also downregulated in our study and may increase further the anti-apoptotic effects of miR-21-5p and miR-16-5p.
[score:4]
Both miR-21-5p and miR-16-5p were significantly downregulated in our study.
[score:4]
miR-195a-5p that has the same seeding sequence with miR-16-5p and is predicted to bind BCL2 mRNA was also downregulated while miR-153-3p that was also found to bind BCL2 experimentally (by Western blot, qRT-PCR, and LUC) [45] was increased.
[score:4]
FOXO1 is targeted by a multitude of miRNAs that are changed in our study miR-9-5p, miR-21-5p, miR-16-5p, miR-183-5p [47], miR-486b-5p, and miR-153-3p.
[score:3]
miR-21-5p is predicted to bind both, BCL2 and STAT3 mRNAs (TargetScan), and miR-16-5p has been shown to bind BCL2 by several experimental approaches (Western blot, qRT-PCR, and luciferase reporter assays) [69, 70].
[score:2]
[1 to 20 of 7 sentences]
|
58 |
![]()
Other miRNAs from this paper: hsa-let-7a-1, hsa-let-7a-2, hsa-let-7a-3, hsa-let-7b, hsa-let-7c, hsa-let-7d, hsa-let-7e, hsa-let-7f-1, hsa-let-7f-2, hsa-mir-15a, hsa-mir-17, hsa-mir-18a, hsa-mir-19a, hsa-mir-19b-1, hsa-mir-20a, hsa-mir-21, hsa-mir-26a-1, hsa-mir-26b, hsa-mir-29a, hsa-mir-29b-1, hsa-mir-29b-2, hsa-mir-16-2, hsa-mir-7-1, hsa-mir-7-2, hsa-mir-7-3, hsa-mir-10b, hsa-mir-34a, hsa-mir-221, hsa-mir-222, hsa-let-7g, hsa-let-7i, hsa-mir-15b, hsa-mir-122, hsa-mir-125b-1, hsa-mir-128-1, hsa-mir-143, hsa-mir-145, hsa-mir-9-1, hsa-mir-9-2, hsa-mir-9-3, hsa-mir-125b-2, hsa-mir-155, hsa-mir-128-2, hsa-mir-106b, hsa-mir-29c, hsa-mir-34b, hsa-mir-34c, hsa-mir-26a-2, hsa-mir-375
In addition to miR-15a/miR-16-1 and let-7, miR-29 family members (miR-29a, b, c) were shown to function as tumor suppressor miRNAs, their downregulation being associated with the development and progression of several human malignancies, including CLL, lung cancer, invasive breast cancer and hepatocellular carcinoma [36, 37, 43, 48].
[score:7]
In CLL, the loss of miR-15a and miR-16-1 was associated with decreased apoptotic activity due to the overexpression of the anti-apoptotic protein Bcl-2, while miR-15a/miR-16-1 reconstitution increased apoptosis through repression of Bcl-2 mRNA translation [38].
[score:5]
Calin G. A. Dumitru C. D. Shimizu M. Bichi R. Zupo S. Noch E. Aldler H. Rattan S. Keating M. Rai K. Frequent deletions and down-regulation of micro-rna genes mir15 and mir16 at 13q14 in chronic lymphocytic leukemia Proc.
[score:4]
Bonci D. Coppola V. Musumeci M. Addario A. Giuffrida R. Memeo L. D’Urso L. Pagliuca A. Biffoni M. Labbaye C. The mir-15a-mir-16-1 cluster controls prostate cancer by targeting multiple oncogenic activities Nat.
[score:3]
The loss of miR-15a and miR-16-1, due to chromosomal deletion of the locus 13q14 or germline mutation in their primary precursor, was associated with the development of the indolent form of CLL [31].
[score:3]
Cimmino A. Calin G. A. Fabbri M. Iorio M. V. Ferracin M. Shimizu M. Wojcik S. E. Aqeilan R. I. Zupo S. Dono M. Mir-15 and mir-16 induce apoptosis by targeting bcl2 Proc.
[score:3]
The first indication that miRNA dysregulation could play a role in cancer was provided by Calin and colleagues, who demonstrated that two clustered miRNA genes, miR-15a and miR-16-1, were located in a region of the 13q14 locus that is commonly deleted in patients diagnosed with B-cell chronic lymphocytic leukemia (CLL) [31].
[score:2]
Loss of miR-15a and miR-16-1 has also been observed in prostate cancer and multiple myeloma [40, 41].
[score:1]
[1 to 20 of 8 sentences]
|
59 |
![]()
Other miRNAs from this paper: hsa-mir-15a, hsa-mir-17, hsa-mir-16-2, hsa-mir-346, hsa-mir-584, hsa-mir-1827
The mmu-miR-16*, mmu-miR-1195, and endo-siRNA-1196 were expressed in the PC14 cells via the miR-Vec miRNA -expressing system [47] and mmu-miR-709 was expressed via miRNA mimic.
[score:7]
In addition, miR-709 has been shown to regulate the biogenesis of miR-15a and miR-16-1 through suppression of pre-miR-15a/16-1 maturation, suggesting a role for miR-709 in the regulation of apoptosis through the miR-16/ Bcl 2 pathway [51].
[score:5]
The sRNAs chosen for this analysis were mmu-miR-16*, mmu-miR-709, mmu-miR-1195 and endo-siRNA-1196, all shown on microarray analysis to exhibit marked differences in fold change, and whose reported gene targets may have relevant protective activity, for example in connection with apoptosis, cell cycle, and p53-signaling pathways (Qiagen's Ingenuity [®] Pathway Analysis).
[score:3]
To this end we exogenously expressed mmu-miR-16*, mmu-miR-709, mmu-miR-1195 and endo-siRNA-1196 sRNAs in PC14 cells.
[score:3]
The human genome does not contain obvious homologues of miR-16*, miR-1195 and Endo-siRNA-1196; it does, however, contain target sequences of these sRNAs in some of their 3′UTR mRNAs.
[score:3]
To examine the possibility that the transferred sRNAs protect the cancer cells from chemotherapy, we focused on four sRNAs (mmu-miR-16*, mmu-miR-709, mmu-miR-1195, and endo-siRNA-1196), all found here to be transferred from astrocytes to PC14 cells.
[score:1]
With respect to miR-16*, precursor miRNAs are processed in the cytoplasm by the endonuclease DICER, producing a mature miRNA and a passenger strand.
[score:1]
Transfection with miR-16*+ miR-1195+ endo-siRNA-1196 did not protect PC14 cells relative to control (76.7% ± 6.5% and 66.7% ± 5.8% respectively; Figure 6C).
[score:1]
Four additional biological repeats (total of 6 repeats) were subjected to miRNA real-time (RT)-PCR using specific TaqMan [®] Small RNA probe sets for mmu-miR-16*, mmu-miR-709, mmu-miR-1195, endogenous siRNA-1196 (endo-siRNA, custom made, sequence: AAAUCUACCUGCCUCUGCCU), mmu-miR-346, and mmu-miR-669c (Applied Biosystems).
[score:1]
Our results showed that mmu-miR-1195, endo-siRNA-1196 and mmu-miR-16* may also contribute to the protective effect, although only when administered in combination with miR-709.
[score:1]
CBX significantly reduced the transfer of 22bpCy3 as well as of mmu-miR-709, mmu-miR-1195, endo-siRNA-1196, and mmu-miR-16*.
[score:1]
RNA was extracted, quantified, and subjected to miRNA RT-PCR for mmu-miR-16*, mmu-miR-709, mmu-miR-1195 and endo-siRNA-1196, as described above.
[score:1]
[1 to 20 of 12 sentences]
|
60 |
![]()
Other miRNAs from this paper: hsa-mir-15a, hsa-mir-28, hsa-mir-16-2, hsa-mir-15b, hsa-mir-600, hsa-mir-660
Although miR-15 and miR-16 are mainly reported to be tumor suppressors, they have been reported to be upregulated in various kinds of cancer and be correlated with tumor cells metastasis, indicating their potential roles as oncomiRs 5. miR-660 expression was used as a good candidate for prognosis prediction in breast cancer 19.
[score:8]
Among these miRs, up-regulation of miR-16, miR-15a, miR-28 and miR-660 were also seen significantly changes in high HIP1 expressers in a large and independent cohort of TCGA patients (Fig. 3).
[score:6]
Specifically, among these 1137 aberrantly expressed genes, 84 genes were predicted to be targeted by miR-28-5p, 100 by miR-15a, 100 by miR-16 and 58 by miR-600 (Figure S6–9).
[score:5]
In the KEGG analysis, these targeted genes of miR-28-5p, miR-15a and miR-16, miR-660 respectively involved in 77, 70, 83 and 33 different metabolic networks with oncogenic potential (Table S7–10).
[score:3]
By means of miRNA-mRNA integrative analysis, we found several targeted genes of miR-28-5p, miR-15a, miR-16 and miR-660.
[score:3]
Importantly, HIP1 interference in THP-1 cell line dramatically reduced the expression of miR-16, miR-15a, miR-28 and miR-660 (Fig. 5A).
[score:3]
[1 to 20 of 6 sentences]
|
61 |
![]()
Other miRNAs from this paper: hsa-let-7a-1, hsa-let-7a-2, hsa-let-7a-3, hsa-mir-21, hsa-mir-23a, hsa-mir-16-2, hsa-mir-223, hsa-mir-23b, hsa-mir-125b-1, hsa-mir-132, hsa-mir-125b-2, hsa-mir-126, hsa-mir-146a, hsa-mir-155, hsa-mir-23c
Six out of ten miRNAs selected for validation were found significantly upregulated by anti-TNFα/DMARDs combination therapy (miR-16-5p, miR-23-3p, miR125b-5p, miR-126-3p, miRN-146a-5p, miR-223-3p).
[score:4]
Filková M Aradi B Senolt L Ospelt C Vettori S Mann H Association of circulating miR-223 and miR-16 with disease activity in patients with early rheumatoid arthritisAnn Rheum Dis.
[score:3]
Consistent with our results, a recent study has shown the association of two of the miRNAs found significantly increased in response to anti-TNFα/DMARDs combination therapy in our study (hsa-miR-223-3p, and hsa-miR-16-5p) with disease activity in RA patients newly diagnosed [34].
[score:3]
The miRNAs validated by RT-PCR in our cohort of patients (miR146a-5p, miR-16-5p, miR-23-3p, miR-125b-5p, miR223-3p; miR126-3p) have been previously reported to act as relevant regulators of immune cells development, playing crucial roles in the inflammatory response, and acting as key players in the pathogenesis of various chronic and autoimmune disorders, including RA itself [24].
[score:3]
Furthermore, three trials in 2008 indicated the existence of altered expression of some of those miRNAs (hsa-miR-16-3p, hsa-miR-132, hsa-miR-146a-5p and hsa-miR-155-3p) in leukocytes of arthritic patients [35].
[score:3]
To validate the PCR array data,10 miRNAs differentially expressed were selected (hsa-miR-125b, hsa-miR-23a-3p, hsa-miR-21-5p, hsa-miR-126-3p, hsa-miR-146a-5p, hsa-let-7a-5p, hsa-miR-16-5p, hsa-miR-124a-3p, hsa-miR-155-5p, and hsa-miR-223).
[score:3]
To validate the PCR array data, ten miRNAs differentially expressed were selected (hsa-miR-125b, hsa-miR-23a-3p, hsa-miR-21-5p, hsa-miR-126-3p, hsa-miR-146a-5p, hsa-let-7a-5p, hsa-miR-16-5p, hsa-miR-124a-3p, hsa-miR-155-5p, and hsa-miR-223).
[score:3]
A second group of five miRNAs under 2-fold change but involved in processes such as inflammation, cardiovascular and autoimmune diseases, and RA were also selected (hsa-let-7a-5p, hsa-miR-16-5p, hsa-miR-124a-3p, hsa-miR-155-5p, hsa-miR-223-3p).
[score:3]
In total population, six of the ten miRNAs clearly distinguished RA serum samples after anti-TNFα/DMARDs combination therapy with high confidence level (P <0.05): (hsa-miR-125b, hsa-miR-126-3p, hsa-miR146a-5p, hsa-miR-16-5p, hsa-miR-23-3p, and hsa-miR-223-3p) all of them being increased after treatment (Figure 2A; Tables S3 and S4 in Additional file 1).
[score:1]
The changes observed in three miRNAs (hsa-miR-146a-5p, hsa-miR-223-3p and hsa-miR-16-5p) significantly correlated with the changes observed in clinical parameters (that is, DAS28), and five of them at least with changes in inflammatory parameters such as CRP or ESR (hsa-miR-146a-5p, hsa-miR-223-3p,hsa-miR-16-5p, hsa- miR-126-3p and hsa-miR-23-3p) (Figure 4).
[score:1]
[1 to 20 of 10 sentences]
|
62 |
![]()
A T → A point mutation and G deletion on the negative strand in the 3’ flanking region of mir-16-1 was discovered NZB mice (de novo mouse mo del of CLL) and was associated with 50% reduction in expression of mature miR-15a/16-1 [11– 13].
[score:4]
In summary, the results presented here show that the alterations found in the mir-15a/16-1 loci of NZB lead to decreased processivity resulting in decreased expression of mature miR-15a and miR-16-1, which in turn gives rise to B-1 expansion.
[score:3]
While there was no difference in the free energy between the wild-type and the mutated mo deled structures, the presence of the mutation alters the structure of the pre-miR-16-1 perhaps reducing accessibility to Drosha and decreasing the processivity of this microRNA precursor.
[score:2]
Raveche et al reported the discovery of a germline point mutation and deletion (T → A and G deletion on the negative strand) in the 3’ flanking region of miR-16-1 of NZB mice [12].
[score:2]
Calin et al also reported a similar point mutation (G→A on negative strand) in the 3’ flanking region of miR-16-1 in a small population of CLL patients [13].
[score:2]
Based on mo deling analysis, there is a significant potential structural alteration in pre-miR-16-1 due to the mutation present in NZB mice (Fig 1C).
[score:2]
Additionally no difference in the free energy value of pre-miR-16-1 was observed with and without the mutation using the RNA mfold program (Fig 1C).
[score:2]
Reduced mature miR-15a/16-1 in DBA congenic mice (D [miR-/-]) and its reverse in NZB congenic mice (N [miR+/-]) is a further proof that the NZB mir-15a/16-1 locus is the cause for reduction in mature miR-15a/16-1. Given the synteny between mouse and human in this loci, it is likely that a similar processivity block is present in the CLL patients with germline mutations in miR-16-1 as reported by Calin et al [13, 44].
[score:2]
Computer predicted structure of pre-miR-16-1. Statistics.
[score:1]
B) RQ values for pri-miR-16-1, pre-miR-16-1 and mature miR-16-1 in NZB (light) and non-NZB (dark) cell lines.
[score:1]
Decreased pre-miR16-1 and Mature miR16-1 in NZB.
[score:1]
Computational folding of pre-miR-16-1 with the NZB mutation gave rise to a potential altered structure when compared to the wild-type sequence predicted structure.
[score:1]
B) The level of mature miR-16 in DBA (non-NZB) versus NZB (CLL) spleen cells in sorted B-1 (IgM+CD5dull, B220dull) and B-2 (IgM+, CD5-, B220+) subpopulations.
[score:1]
However, the amount of pre-miR-16-1 and mature miR16-1 was significantly reduced in the NZB cell line (Fig 2B).
[score:1]
In addition, NZB mice have a significant decrease in the levels of mature miR-15a and miR-16 (Fig 1B).
[score:1]
C) Predicted pre-miR-16-1 structure using the stem loop ± 11 nt sequence of wild type (left) and NZB (right) sequence using RNA mFold software.
[score:1]
[1 to 20 of 16 sentences]
|
63 |
![]()
Other miRNAs from this paper: hsa-mir-29a, hsa-mir-93, hsa-mir-101-1, hsa-mir-29b-1, hsa-mir-29b-2, hsa-mir-16-2, mmu-mir-29b-1, mmu-mir-101a, mmu-mir-125a, mmu-mir-125b-2, mmu-mir-144, mmu-mir-155, mmu-mir-143, hsa-mir-34a, hsa-mir-214, hsa-mir-217, hsa-mir-221, mmu-mir-34c, mmu-mir-34b, hsa-mir-125b-1, hsa-mir-143, hsa-mir-144, hsa-mir-125a, hsa-mir-125b-2, mmu-mir-16-1, mmu-mir-16-2, mmu-mir-29a, mmu-mir-29c, mmu-mir-93, mmu-mir-34a, mmu-mir-101b, hsa-mir-155, mmu-mir-214, mmu-mir-221, mmu-mir-29b-2, mmu-mir-125b-1, mmu-mir-217, hsa-mir-29c, hsa-mir-101-2, hsa-mir-34b, hsa-mir-34c, ssc-mir-125b-2, ssc-mir-217-1, ssc-mir-29b-1, ssc-mir-214, ssc-mir-29c, bta-mir-29a, bta-mir-101-2, bta-mir-16b, bta-mir-221, bta-mir-125a, bta-mir-125b-1, bta-mir-34b, bta-mir-214, bta-mir-29b-2, bta-mir-29c, bta-mir-93, bta-mir-34c, bta-mir-125b-2, bta-mir-34a, ssc-mir-16-2, ssc-mir-16-1, ssc-mir-34a, ssc-mir-221, bta-mir-101-1, bta-mir-143, bta-mir-144, bta-mir-155, bta-mir-16a, bta-mir-217, bta-mir-29d, bta-mir-29e, bta-mir-29b-1, ssc-mir-101-1, ssc-mir-101-2, ssc-mir-29a, ssc-mir-143, ssc-mir-125a, ssc-mir-34c-1, ssc-mir-125b-1, ssc-mir-155, mmu-mir-101c, ssc-mir-29b-2, ssc-mir-34c-2, ssc-mir-144, ssc-mir-217-2
Similarly, expressions of miR-16 and miR-143 inhibit cell proliferation and suppress tumorigenesis, and miR-143 has been observed to be down-regulated in cervical cancer [36].
[score:10]
For bats, 3 out of 4 up-regulated miRNA (miR-101-3p, miR-16-5p, miR-143-3p) likely function as tumor suppressors against various kinds of cancers, while one down-regulated miRNA (miR-221-5p) acts as a tumorigenesis promoter in human breast and pancreatic cancers.
[score:9]
The summary of the six DE miRNA common to all species is described in Fig. 5. Briefly, all DE candidates were single copy miRNA across all libraries, and 4 DE miRNA (miR-101-3p, miR-16-5p, miR-143-3p and miR-155-5p) were up-regulated in bats while 2 (miR-125-5p and miR-221-5p) were down-regulated.
[score:7]
[1 to 20 of 3 sentences]
|
64 |
![]()
Other miRNAs from this paper: hsa-mir-21, hsa-mir-16-2, hsa-mir-126, hsa-mir-424, hsa-mir-486-1, hsa-mir-503, hsa-mir-486-2
In our case, the suppressive role of miR-16 on VEGF expression could be overruled by the up-regulation of miR-126 leading to an enhanced VEGF production.
[score:8]
MicroRNA-16 and microRNA-424 regulate cell-autonomous angiogenic functions in endothelial cells via targeting vascular endothelial growth factor receptor-2 and fibroblast growth factor receptor-1. Arterioscler.
[score:4]
miR-16 has been shown to be produced by human endothelial cells and is implicated in suppressing vascular endothelial growth factor (VEGF), VEGF receptor 2 (VEGFR2), basic fibroblast growth factor (bFGF) and fibroblast growth factor receptor 1 (FGF-R1) (Chamorro-Jorganes et al., 2011; Triozzi et al., 2012).
[score:3]
The baseline expression levels varied as follows: 0.76 ± 0.35 for miR-16, 0.94 ± 0.42 for miR-21; 0.94 ± 0.68 for miR-126.
[score:3]
MicroRNA-503 and the extended microRNA-16 family in angiogenesis.
[score:1]
Among the miRNAs involved in the survival, maintenance, and formation of new capillaries, miR-16, -21, and -126 play well-known roles in the control of angiogenesis and vascular integrity (Urbich et al., 2008; Wang et al., 2008; Suárez and Sessa, 2009).
[score:1]
Aoi et al. (2013) reported that miR-16 is neither affected by acute exercise nor by chronic exercise.
[score:1]
miR-21 and miR-126 have been suggested to be pro-angiogenic, whereas miR-16 has been suggested to induce anti-angiogenic processes (Fernandes et al., 2012).
[score:1]
c-miR-16.
[score:1]
miR-16 reduces proliferation, migration, and angiogenic capacity of ECs in vitro (Caporali and Emanueli, 2011).
[score:1]
Figure 1 Changes in circulating miR-16 (A), miR-21 (B), and miR-126 (C) levels before (pre) and after (0′, 30′, 60′, 180′) each intervention.
[score:1]
[1 to 20 of 11 sentences]
|
65 |
![]()
Other miRNAs from this paper: hsa-let-7a-1, hsa-let-7a-2, hsa-let-7a-3, hsa-let-7f-1, hsa-let-7f-2, hsa-mir-17, hsa-mir-19a, hsa-mir-19b-1, hsa-mir-19b-2, hsa-mir-23a, hsa-mir-26a-1, hsa-mir-26b, hsa-mir-27a, hsa-mir-29a, hsa-mir-30a, hsa-mir-31, hsa-mir-100, hsa-mir-29b-1, hsa-mir-29b-2, hsa-mir-16-2, mmu-mir-23b, mmu-mir-27b, mmu-mir-29b-1, mmu-mir-30a, mmu-mir-30b, mmu-mir-127, mmu-mir-128-1, mmu-mir-132, mmu-mir-133a-1, mmu-mir-188, mmu-mir-194-1, mmu-mir-195a, mmu-mir-199a-1, hsa-mir-199a-1, mmu-mir-200b, mmu-mir-205, mmu-mir-206, hsa-mir-30c-2, hsa-mir-30d, mmu-mir-122, mmu-mir-30e, hsa-mir-199a-2, hsa-mir-199b, hsa-mir-205, hsa-mir-211, hsa-mir-212, hsa-mir-214, hsa-mir-217, hsa-mir-200b, hsa-mir-23b, hsa-mir-27b, hsa-mir-30b, hsa-mir-122, hsa-mir-128-1, hsa-mir-132, hsa-mir-133a-1, hsa-mir-133a-2, hsa-mir-127, hsa-mir-138-1, hsa-mir-188, hsa-mir-194-1, hsa-mir-195, hsa-mir-206, mmu-mir-19b-2, mmu-mir-30c-1, mmu-mir-30c-2, mmu-mir-30d, mmu-mir-200a, mmu-let-7a-1, mmu-let-7a-2, mmu-let-7f-1, mmu-let-7f-2, mmu-mir-16-1, mmu-mir-16-2, mmu-mir-23a, mmu-mir-26a-1, mmu-mir-26b, mmu-mir-29a, mmu-mir-29c, mmu-mir-27a, mmu-mir-31, mmu-mir-351, hsa-mir-200c, mmu-mir-17, mmu-mir-19a, mmu-mir-100, mmu-mir-200c, mmu-mir-212, mmu-mir-214, mmu-mir-26a-2, mmu-mir-211, mmu-mir-29b-2, mmu-mir-199a-2, mmu-mir-199b, mmu-mir-19b-1, mmu-mir-138-1, mmu-mir-128-2, hsa-mir-128-2, mmu-mir-217, hsa-mir-194-2, mmu-mir-194-2, hsa-mir-29c, hsa-mir-30c-1, hsa-mir-200a, hsa-mir-30e, hsa-mir-26a-2, hsa-mir-379, mmu-mir-379, mmu-mir-133a-2, mmu-mir-133b, hsa-mir-133b, mmu-mir-412, mmu-mir-431, hsa-mir-431, hsa-mir-451a, mmu-mir-451a, mmu-mir-467a-1, hsa-mir-412, hsa-mir-485, hsa-mir-487a, hsa-mir-491, hsa-mir-503, hsa-mir-504, mmu-mir-485, hsa-mir-487b, mmu-mir-487b, mmu-mir-503, hsa-mir-556, hsa-mir-584, mmu-mir-665, mmu-mir-669a-1, mmu-mir-674, mmu-mir-690, mmu-mir-669a-2, mmu-mir-669a-3, mmu-mir-669c, mmu-mir-696, mmu-mir-491, mmu-mir-504, hsa-mir-665, mmu-mir-467e, mmu-mir-669k, mmu-mir-669f, hsa-mir-664a, mmu-mir-1896, mmu-mir-1894, mmu-mir-1943, mmu-mir-1983, mmu-mir-1839, mmu-mir-3064, mmu-mir-3072, mmu-mir-467a-2, mmu-mir-669a-4, mmu-mir-669a-5, mmu-mir-467a-3, mmu-mir-669a-6, mmu-mir-467a-4, mmu-mir-669a-7, mmu-mir-467a-5, mmu-mir-467a-6, mmu-mir-669a-8, mmu-mir-669a-9, mmu-mir-467a-7, mmu-mir-467a-8, mmu-mir-669a-10, mmu-mir-467a-9, mmu-mir-669a-11, mmu-mir-467a-10, mmu-mir-669a-12, mmu-mir-3473a, hsa-mir-23c, hsa-mir-4436a, hsa-mir-4454, mmu-mir-3473b, hsa-mir-4681, hsa-mir-3064, hsa-mir-4436b-1, hsa-mir-4790, hsa-mir-4804, hsa-mir-548ap, mmu-mir-3473c, mmu-mir-5110, mmu-mir-3473d, mmu-mir-5128, hsa-mir-4436b-2, mmu-mir-195b, mmu-mir-133c, mmu-mir-30f, mmu-mir-3473e, hsa-mir-6825, hsa-mir-6888, mmu-mir-6967-1, mmu-mir-3473f, mmu-mir-3473g, mmu-mir-6967-2, mmu-mir-3473h
Out of these 25 miRNAs, 18 miRNAs were differentially expressed in a consistent manner between the 2 groups (Figure 4A, highlighted); 8 miRNAs were downregulated in both groups (miR-16, miR-200, miR-205, miR-3064, miR-379, miR-431, miR-485 and miR-491) and 10 miRNAs were upregulated in both groups (miR-194, miR-1894, miR-211, miR-3072, miR- 3077, miR-4436, miR-5128, miR-669a, miR-669c and miR-6967).
[score:9]
In the microarray data, 12 miRNAs were consistent in their change either with HHcy or diabetes; of which 4 miRNAs were downregulated in both groups (miR-16, miR-1983, miR-412 and miR-487) and 8 miRNAs (miR-194, miR-188, miR-1896, miR-467e, miR-504, miR-5110, miR-669k and miR-696) were upregulated in both groups.
[score:7]
A triple comparison was also done that included cbs [–/–], cbs [+/–] and STZ retinas, which revealed 6 miRNAs (miR-194, miR-16, miR-212, miR-30c, miR-5128 and miR-669c) that were commonly changed among cbs [–/–], cbs [+/–] and diabetes; 2 of these miRNAs were consistently changed among the three groups (miR-194 was upregulated and miR-16 was downregulated).
[score:7]
Interestingly, miR-16-5p has been reported to be tissue protective and to be decreased in a diabetic rat's kidney [92].
[score:1]
Among those miRNAs, 2 miRNAs (miR-16-5p and miR-194) were consistently changing among the three different groups.
[score:1]
[1 to 20 of 5 sentences]
|
66 |
![]()
Other miRNAs from this paper: hsa-let-7a-1, hsa-let-7a-2, hsa-let-7a-3, hsa-let-7b, hsa-let-7c, hsa-let-7d, hsa-let-7e, hsa-let-7f-1, hsa-let-7f-2, hsa-mir-15a, hsa-mir-17, hsa-mir-21, hsa-mir-24-1, hsa-mir-24-2, hsa-mir-25, hsa-mir-26a-1, hsa-mir-26b, hsa-mir-29a, hsa-mir-30a, hsa-mir-29b-1, hsa-mir-29b-2, hsa-mir-107, hsa-mir-192, hsa-mir-148a, hsa-mir-30c-2, hsa-mir-30d, hsa-mir-10b, hsa-mir-34a, hsa-mir-203a, hsa-mir-204, hsa-mir-210, hsa-mir-212, hsa-mir-215, hsa-mir-221, hsa-mir-223, hsa-mir-200b, hsa-let-7g, hsa-let-7i, hsa-mir-15b, hsa-mir-30b, hsa-mir-122, hsa-mir-143, hsa-mir-145, hsa-mir-9-1, hsa-mir-9-2, hsa-mir-9-3, hsa-mir-127, hsa-mir-194-1, hsa-mir-200c, hsa-mir-155, hsa-mir-194-2, hsa-mir-29c, hsa-mir-30c-1, hsa-mir-200a, hsa-mir-302a, hsa-mir-34b, hsa-mir-34c, hsa-mir-30e, hsa-mir-26a-2, hsa-mir-363, hsa-mir-365a, hsa-mir-365b, hsa-mir-302b, hsa-mir-302c, hsa-mir-302d, hsa-mir-135b, hsa-mir-424, hsa-mir-20b, hsa-mir-486-1, hsa-mir-491, hsa-mir-519c, hsa-mir-545, hsa-mir-590, hsa-mir-605, hsa-mir-663a, hsa-mir-663b, hsa-mir-1246, hsa-mir-302e, hsa-mir-302f, hsa-mir-203b, hsa-mir-486-2
As discussed above, miR-15a and miR-16-1 are significantly downregulated in chronic lymphocytic leukemia and their expression inversely correlates with Bcl-2 expression.
[score:8]
Further study revealed that miR-15 and miR-16-1 acts as tumor suppressors to induce apoptosis by repressing Bcl-2, an anti-apoptotic protein overexpressed in malignant nondividing B cells and many solid malignancies.
[score:5]
[6] They found this region, frequently deleted in B-cell chronic lymphocytic leukemia, actually contains two miRNA genes, miR-15a and miR-16-1. Both genes are deleted or downregulated in the majority of clinical chronic lymphocytic leukemia cases.
[score:4]
[121] Since the discovery of miR-15a and miR-16-1 deletions in chronic lymphocytic leukemia, many laboratories around the world have demonstrated the expression of miRNAs is dysregulated in different tumors.
[score:4]
7, 8 Most importantly, the deletion of miR-15 and miR-16-1 cluster in mice recapitulated chronic lymphocytic leukemia -associated phenotypes observed in humans, which convincingly demonstrated the critical role of these two miRNAs in tumor suppression.
[score:3]
[1 to 20 of 5 sentences]
|
67 |
![]()
Other miRNAs from this paper: hsa-let-7a-1, hsa-let-7a-2, hsa-let-7a-3, hsa-let-7b, hsa-let-7c, hsa-let-7d, hsa-let-7e, hsa-let-7f-1, hsa-let-7f-2, hsa-mir-15a, hsa-mir-20a, hsa-mir-21, hsa-mir-26b, hsa-mir-31, hsa-mir-101-1, hsa-mir-16-2, hsa-mir-208a, hsa-mir-10b, hsa-mir-34a, hsa-mir-182, hsa-mir-199b, hsa-mir-205, hsa-mir-221, hsa-mir-200b, hsa-let-7g, hsa-let-7i, hsa-mir-15b, hsa-mir-130a, hsa-mir-141, hsa-mir-143, hsa-mir-145, hsa-mir-9-1, hsa-mir-9-2, hsa-mir-9-3, hsa-mir-195, hsa-mir-200c, hsa-mir-155, hsa-mir-200a, hsa-mir-101-2, hsa-mir-34b, hsa-mir-34c, hsa-mir-375, hsa-mir-342, hsa-mir-148b, hsa-mir-133b, hsa-mir-448, hsa-mir-409, hsa-mir-483, hsa-mir-146b, hsa-mir-520d, hsa-mir-519a-1, hsa-mir-519a-2, hsa-mir-621, hsa-mir-208b, hsa-mir-4689
As previously described, miR-16 inhibits TGF-β -induced EMT by silencing p-FAK and p-Akt expression, disrupting NF-κB and Slug transcriptional activity (Wang et al. 2014 b).
[score:5]
0084188) 24392114 Wang Q Li X Zhu Y Yang P 2014b MicroRNA-16 suppresses epithelial-mesenchymal transitionrelated gene expression in human glioma.
[score:4]
miR-15 and miR-16 are downregulated in prostate cancer CAF in the majority of 23 patients (Musumeci et al. 2011).
[score:4]
As previously mentioned, miR-16 is implicated as a tumor suppressor for many cancers.
[score:3]
TargomiRs are EGF receptor -targeted antibody conjugated to minicells containing a miR-16 mimic.
[score:3]
In these phase I studies, miR mimetics have been used to restore miR-34 (MRX34) and miR-16 (TargomiRs) activity.
[score:1]
The study demonstrated that in vivo nano-liposomal delivery of miR-15a and miR-16 decrease tumor growth in preclinical chemo-resistant orthotopic ovarian cancer mouse mo del in support of combination therapies.
[score:1]
However, there are compelling preclinical reports in which the ovarian cancer mo dels were treated with cisplatin alone or in combination with miR-15a and miR-16 mimetics (Dwivedi et al. 2016).
[score:1]
M110.121012) 20444703 Musumeci M Coppola V Addario A Patrizii M Maugeri-Sacca M Memeo L Colarossi C Francescangeli F Biffoni M Collura D 2011 Control of tumor and microenvironment cross-talk by miR-15a and miR-16 in prostate cancer.
[score:1]
Importantly, miR-16 and miR-200 family members silences TGF-β signaling and blocks EMT (Brabletz & Brabletz 2010, Wang et al. 2014 b, Tang et al. 2016).
[score:1]
[1 to 20 of 10 sentences]
|
68 |
![]()
Other miRNAs from this paper: hsa-mir-15a, hsa-mir-16-2, mmu-mir-15b, mmu-mir-155, hsa-mir-15b, mmu-mir-15a, mmu-mir-16-1, mmu-mir-16-2, hsa-mir-155
1 + p53 Conditional knockout in hematopoietic cells Aggressive AML Nras:Bcl-2 Conditional transgenic Myelodysplastic syndrome Bcl-2 inhibitors TERC Conditional knockout Leukemia stem cell maintenance AML-ETO Inducible transgenic APL RARα fusion Transgenic, variable AML Transretinoic acid CML BCR-ABL1 Humanized mice transplanted with retroviral vector Chronic myeloproliferative syndrome Conditional transgenic in hematopoietic cells CML Tyrosine kinase inhibitors Transposon -based insertional mutagenesis Acute blast crisis Acute lymphoblastic leukemia (ALL) ETV6–RUNX1 Transgenic using Ig heavy chain enhancer Block in B-cell differentiation E2A–PBX1 Conditional transgenic using Lck enhancer, TCR Vβ promoter B-cell ALL NOTCH1 Tumor-derived engraftment of NOD/SCID Xenograft T-ALL Monoclonal antibody against Notch1 PRDM14 Inducible transgenic Rapid onset T-ALL Monoclonal antibody against Notch1 Chronic lymphocytic leukemia (CLL) miR-16 Spontaneous in New Zealand Black Clonal CD5+ B cell disease T-cell leukemia 1 Serial transfer transgenic Rapid progression CLL PD-1 immune checkpoint inhibitor BCR NSG™ with orthotopic splenic engraftment CLL Ibrutinib efficacy Homozygous deletion of the upstream regulatory element of PU.
[score:12]
A common genomic aberration in CLL leads to increased expression of anti-apoptotic protein BCL-2, which is negatively regulated by miR-15a and miR-16-1. The expression of these miRs is lost via deletion of a region on chromosome 13, 13q14.3 (59, 60).
[score:6]
To mo del a common genetic alteration in the human disease, a transgenic mouse lacking the chromosomal region 13q14 encoding for DLEU-2, miR-15, and miR-16 were developed (67).
[score:3]
These mice also have reduced expression of miR-16-1 (62).
[score:3]
[1 to 20 of 4 sentences]
|
69 |
![]()
Other miRNAs from this paper: hsa-let-7a-1, hsa-let-7a-2, hsa-let-7a-3, hsa-let-7b, hsa-let-7c, hsa-let-7d, hsa-let-7e, hsa-let-7f-1, hsa-let-7f-2, hsa-mir-15a, hsa-mir-17, hsa-mir-18a, hsa-mir-20a, hsa-mir-21, hsa-mir-25, hsa-mir-26a-1, hsa-mir-26b, hsa-mir-29a, hsa-mir-30a, hsa-mir-31, hsa-mir-92a-1, hsa-mir-92a-2, hsa-mir-93, hsa-mir-99a, hsa-mir-100, hsa-mir-101-1, hsa-mir-29b-1, hsa-mir-29b-2, hsa-mir-106a, hsa-mir-16-2, hsa-mir-192, hsa-mir-196a-1, hsa-mir-199a-1, hsa-mir-30c-2, hsa-mir-30d, hsa-mir-10a, hsa-mir-10b, hsa-mir-34a, hsa-mir-181b-1, hsa-mir-183, hsa-mir-196a-2, hsa-mir-199a-2, hsa-mir-203a, hsa-mir-215, hsa-mir-221, hsa-mir-222, hsa-mir-224, hsa-mir-200b, hsa-let-7g, hsa-let-7i, hsa-mir-15b, hsa-mir-30b, hsa-mir-125b-1, hsa-mir-135a-1, hsa-mir-135a-2, hsa-mir-140, hsa-mir-141, hsa-mir-143, hsa-mir-145, hsa-mir-125a, hsa-mir-125b-2, hsa-mir-146a, hsa-mir-195, hsa-mir-200c, hsa-mir-155, hsa-mir-106b, hsa-mir-29c, hsa-mir-30c-1, hsa-mir-200a, hsa-mir-101-2, hsa-mir-34b, hsa-mir-34c, hsa-mir-99b, hsa-mir-30e, hsa-mir-26a-2, hsa-mir-363, hsa-mir-302b, hsa-mir-371a, hsa-mir-375, hsa-mir-378a, hsa-mir-328, hsa-mir-135b, hsa-mir-196b, hsa-mir-424, hsa-mir-20b, hsa-mir-429, hsa-mir-451a, hsa-mir-483, hsa-mir-146b, hsa-mir-497, hsa-mir-92b, hsa-mir-378d-2, hsa-mir-378b, hsa-mir-378c, hsa-mir-378d-1, hsa-mir-378e, hsa-mir-378f, hsa-mir-378g, hsa-mir-378h, hsa-mir-378i, hsa-mir-203b, hsa-mir-451b, hsa-mir-371b, hsa-mir-378j
High blood sugar levels significantly impact the prognosis of colorectal cancer patients through down-regulation of microRNA-16 by targeting Myb and VEGFR2.
[score:6]
The mRNA stability factor HuR inhibits microRNA-16 targeting of COX-2. Mol.
[score:5]
Prognostic significance of microRNA-16 expression in human colorectal cancer.
[score:3]
Aberrant expression of microRNA-15a and microRNA-16 synergistically associates with tumor progression and prognosis in patients with colorectal cancer.
[score:3]
Mechanistically, the miR-15a/miR-16-1 locus is induced by TP53 in response to DNA damage and is responsible for directly repressing the pro-metastatic bHLH transcription factor AP-4 (TFAP4) in CRC cells (Shi et al., 2014).
[score:2]
As is frequently observed for miRNAs, the authors also uncovered a negative feedback loop, whereby TFAP4 directly represses the transcription of the miR-15a/miR-16-1 locus.
[score:2]
MiR-16 and miR-195 are depleted in CRC tumors relative to normal tissue (Wang et al., 2012; Qian et al., 2013; Xiao et al., 2014).
[score:1]
The miR-15 family (miR-15, miR-16, miR-195) can also include miR-424 and miR-497.
[score:1]
[1 to 20 of 8 sentences]
|
70 |
![]()
We found one candidate for a regulatory relationship between miRNA and mRNA expression, namely, heat shock protein A1B (HSPA1B), which is possibly regulated by miR-15b-5p and miR-16-5p.
[score:5]
We confirmed the increased expression of this anti-apoptotic gene under the hypoglycemic condition, but the levels of the anticipated regulatory miRNAs, miR-15b and miR-16, did not change, and other miRNA regulatory factors were not found.
[score:5]
Linkage between the expression of HSPA1B and the expression of miR-15b-5p and miR-16-5p.
[score:5]
On the other hand, in normal hepatocytes, HSPA1B expression was not significantly changed, although the expression of miR-15b-5p and miR-16-5p decreased under hypoglycemic conditions (Table 2).
[score:5]
b Expression levels of miR-15b-5p and miR-16-5p.
[score:3]
[1 to 20 of 5 sentences]
|
71 |
![]()
Other miRNAs from this paper: hsa-mir-16-2
In this study, because of high abundant viral microRNA in BKV cases and relatively stable expression of miR-16, normalization with miR-16 did not affect the correlation with viral DNA of plasma and urine, or the sensitivity and specificity for BKVN diagnosis.
[score:3]
We found a significant difference between patient groups in the levels of bkv-miR-B1-5p and bkv-miR-B1-5p/miR-16, as well as in BK viral load in plasma and urine samples.
[score:1]
In contrary, miR-16 in urine supernatant was detected only in 36.4% of patients (4/11).
[score:1]
There was no case of false negative case in both miR-B1-5p and bkv-miR-B1-5p/miR-16.
[score:1]
Plasma BK viral load, urinary BK viral load, and the levels of bkv-miR-B1-5p and bkv-miR-B1-5p/miR-16 are shown in Fig 2, according to different groups.
[score:1]
However, miR-16, a surrogate marker of bulk exosome release [12], was not significantly different between the groups.
[score:1]
Correlation analyses between urinary exosomal bkv-miR-B1-5p, bkv-miR-B1-5p/miR-16 and BK viral load.
[score:1]
The levels of bkv-miR-B1-5p and bkv-miR-B1-5p/miR-16 showed a significant positive correlation with urinary BK viral load (r = 0.886 and 0.854, respectively) (Fig 3).
[score:1]
A slightly lesser, but significant degree of correlation was also found between bkv-miR-B1-5p, bkv-miR-B1-5p/miR-16 and plasma BK viral load (r = 0.809 and 0.808, respectively).
[score:1]
Dotted lines signify the cut-off values for each test in this study (5.9 log [10] copies/mL for bkv-miR-B1-5p, 1.2 log [10] copies/mL for bkv-miR-B1-5p/miR-16, 4.0 log [10] copies/mL for plasma BK viral load, and 7.0 log [10] copies/mL for urinary BK viral load).
[score:1]
This study suggests that urinary exosomal bkv-miR-B1-5p and bkv-miR-B1-5p/miR-16 could be surrogate markers for the diagnosis of BKVN.
[score:1]
Plasma BK viral load, urinary BK viral load, urinary exosomal bkv-miR-B1-5p, and bkv-miR-B1-5p/miR-16 levels according to renal allograft status.
[score:1]
The cut-off values for bkv-miR-B1-5p and bkv-miR-B1-5p/miR-16 were 5.9 log [10] copies/mL (sensitivity, 100%; specificity, 98.5%) and 1.2 log [10] copies/mL (sensitivity, 100%; specificity, 98.5%), respectively.
[score:1]
On the other hand, the levels of miR-16 were not significantly different between the patients with BKVN and those with normal pathology.
[score:1]
The diagnostic power of bkv-miR-B1-5p and bkv-miR-B1-5p/miR-16 were comparable to those of plasma and urinary BK viral load.
[score:1]
However, two patients with BKVN showed negative plasma BK viral load, and one patient showed negative urinary BK viral load (C) and (D) Patients with BKVN also showed highest levels of bkv-miR-B1-5p and bkv-miR-B1-5p/miR-16 (p<0.001).
[score:1]
Furthermore, miR-16, a known surrogate marker for vesicular microRNAs [12], was detectable in urinary exosomal fraction of all patients and the levels of miR-16 were not different between the patients with BKVN and those without BKVN (Fig 1D).
[score:1]
Pigati et al. suggested miR-16 could be a surrogate marker of exosomal contents [12], but miR-16 is also known to be an abundant microRNA in extravesicular plasma [29, 30].
[score:1]
The AUC for bkv-miR-B1-5p, bkv-miR-B1-5p/miR-16, plasma BK viral load, and urinary BK viral load are 0.989, 0.985, 0.914, and 0.932, respectively.
[score:1]
Sensitivity and specificity were 100% and 98.5% for bkv-miR-B1-5p and 100% and 98.5% for bkv-miR-B1-5p/miR-16 using our cut-off values (5.9 and 1.2 log [10] copies/mL, respectively).
[score:1]
The AUC from ROC curve analysis using data from the 80 subjects showed excellent results; the AUC was 0.989 for bkv-miR-B1-5p (95% confidence interval [CI] 0.934–1.000), 0.985 for bkv-miR-B1-5p/miR-16 (95% CI 0.928–0.999), 0.914 for plasma BK viral load (95% CI 0.830–0.965) and 0.932 for urinary BK viral load (95% CI 0.853–0.976) (Fig 4).
[score:1]
[1 to 20 of 21 sentences]
|
72 |
![]()
Other miRNAs from this paper: hsa-let-7a-1, hsa-let-7a-2, hsa-let-7a-3, hsa-let-7b, hsa-let-7c, hsa-let-7d, hsa-let-7e, hsa-let-7f-1, hsa-let-7f-2, hsa-mir-15a, hsa-mir-17, hsa-mir-18a, hsa-mir-19a, hsa-mir-19b-1, hsa-mir-19b-2, hsa-mir-20a, hsa-mir-21, hsa-mir-23a, hsa-mir-25, hsa-mir-26a-1, hsa-mir-27a, hsa-mir-29a, hsa-mir-30a, hsa-mir-31, hsa-mir-33a, hsa-mir-92a-1, hsa-mir-92a-2, hsa-mir-93, hsa-mir-96, hsa-mir-99a, hsa-mir-100, hsa-mir-29b-1, hsa-mir-29b-2, hsa-mir-16-2, hsa-mir-198, hsa-mir-199a-1, hsa-mir-148a, hsa-mir-7-1, hsa-mir-7-2, hsa-mir-7-3, hsa-mir-10a, hsa-mir-10b, hsa-mir-34a, hsa-mir-181a-2, hsa-mir-181b-1, hsa-mir-181c, hsa-mir-182, hsa-mir-199a-2, hsa-mir-199b, hsa-mir-203a, hsa-mir-204, hsa-mir-210, hsa-mir-212, hsa-mir-181a-1, hsa-mir-214, hsa-mir-215, hsa-mir-216a, hsa-mir-217, hsa-mir-218-1, hsa-mir-218-2, hsa-mir-219a-1, hsa-mir-221, hsa-mir-222, hsa-mir-223, hsa-mir-224, hsa-let-7g, hsa-let-7i, hsa-mir-15b, hsa-mir-27b, hsa-mir-124-1, hsa-mir-124-2, hsa-mir-124-3, hsa-mir-125b-1, hsa-mir-128-1, hsa-mir-130a, hsa-mir-132, hsa-mir-135a-1, hsa-mir-135a-2, hsa-mir-142, hsa-mir-145, hsa-mir-191, hsa-mir-9-1, hsa-mir-9-2, hsa-mir-9-3, hsa-mir-125a, hsa-mir-125b-2, hsa-mir-126, hsa-mir-134, hsa-mir-146a, hsa-mir-150, hsa-mir-186, hsa-mir-188, hsa-mir-193a, hsa-mir-194-1, hsa-mir-320a, hsa-mir-155, hsa-mir-181b-2, hsa-mir-128-2, hsa-mir-194-2, hsa-mir-106b, hsa-mir-29c, hsa-mir-219a-2, hsa-mir-34b, hsa-mir-34c, hsa-mir-99b, hsa-mir-130b, hsa-mir-30e, hsa-mir-26a-2, hsa-mir-362, hsa-mir-369, hsa-mir-375, hsa-mir-378a, hsa-mir-382, hsa-mir-340, hsa-mir-328, hsa-mir-342, hsa-mir-151a, hsa-mir-148b, hsa-mir-331, hsa-mir-339, hsa-mir-335, hsa-mir-345, hsa-mir-196b, hsa-mir-424, hsa-mir-425, hsa-mir-20b, hsa-mir-451a, hsa-mir-409, hsa-mir-484, hsa-mir-486-1, hsa-mir-487a, hsa-mir-511, hsa-mir-146b, hsa-mir-496, hsa-mir-181d, hsa-mir-523, hsa-mir-518d, hsa-mir-499a, hsa-mir-501, hsa-mir-532, hsa-mir-487b, hsa-mir-551a, hsa-mir-92b, hsa-mir-572, hsa-mir-580, hsa-mir-550a-1, hsa-mir-550a-2, hsa-mir-590, hsa-mir-599, hsa-mir-612, hsa-mir-624, hsa-mir-625, hsa-mir-627, hsa-mir-629, hsa-mir-33b, hsa-mir-633, hsa-mir-638, hsa-mir-644a, hsa-mir-650, hsa-mir-548d-1, hsa-mir-449b, hsa-mir-550a-3, hsa-mir-151b, hsa-mir-320b-1, hsa-mir-320c-1, hsa-mir-454, hsa-mir-320b-2, hsa-mir-378d-2, hsa-mir-708, hsa-mir-216b, hsa-mir-1290, hsa-mir-320d-1, hsa-mir-320c-2, hsa-mir-320d-2, hsa-mir-378b, hsa-mir-3151, hsa-mir-320e, hsa-mir-378c, hsa-mir-550b-1, hsa-mir-550b-2, hsa-mir-378d-1, hsa-mir-378e, hsa-mir-378f, hsa-mir-378g, hsa-mir-378h, hsa-mir-378i, hsa-mir-219b, hsa-mir-203b, hsa-mir-451b, hsa-mir-499b, hsa-mir-378j, hsa-mir-486-2
However, additional mechanisms, such as overexpression of histone deacetylases (HDACs), also down-regulateed expression of miR-15 and miR-16 [3].
[score:8]
It should be noted that the tyrosine kinase inhibitor (TKI) Dasatinib affected miR-let-7d, miR-let-7e, miR-15a, miR-16, miR-21, miR-130a and miR-142-3p expressions, while Imitanib affected miR-15a and miR-130a levels [47].
[score:5]
Down-regulated miR-15a and miR-16-1 in CLL patients has been associated with a good prognosis, consistent with previous reports that correlated 13q14.3 deletions with a favorable course of CLL [7].
[score:4]
While miR-16 was lower in ALL patients with low leukocytes and good cytogenetic characteristics [79], higher expression of miR-16 was found in patients with corticosteroid resistance [79] and correlated with shorter disease-free survival and overall survival, possibly by modulating BCL-2 [80].
[score:3]
Han J, Chen Q. MiR-16 modulate temozolomide resistance by regulating BCL-2 in human glioma cells.
[score:1]
In fact, miR-15a and miR-16-1 are located in the locus 13q14.3, a genomic region frequently deleted in CLL patient samples [2].
[score:1]
Analyses of over 430 miRNAs in 50 clinical T-ALL samples revealed a common signature: miR-223, miR-19b, miR-20a, miR-92, miR-142-3p, miR-150, miR-93, miR-26a, miR-16 and miR-342 [59].
[score:1]
[1 to 20 of 7 sentences]
|
73 |
![]()
Other miRNAs from this paper: hsa-mir-17, hsa-mir-19a, hsa-mir-20a, hsa-mir-29a, hsa-mir-16-2, mmu-mir-125b-2, mmu-mir-186, hsa-mir-139, hsa-mir-212, mmu-mir-106b, hsa-mir-125b-1, hsa-mir-125b-2, hsa-mir-186, mmu-mir-16-1, mmu-mir-16-2, mmu-mir-20a, mmu-mir-29a, mmu-mir-337, mmu-mir-17, mmu-mir-19a, mmu-mir-139, mmu-mir-212, mmu-mir-125b-1, hsa-mir-106b, hsa-mir-337, hsa-mir-620, mmu-mir-216b, mmu-mir-760, hsa-mir-760, hsa-mir-216b
Even by considering the common predicted targets from four existing miRNA target prediction databases (i. e. setting the database filter equal to four), PPM1D is still hidden in 883 predicted targets of miR-16-5p, suggesting that applying the database filter alone is not an efficient way to reduce the non-functional miRNA targets.
[score:9]
On the contrary, if using existing miRNA target prediction databases (e. g. miRecords [16], miRWalk [22], miRSystem [19] and starBase [23]), researchers will have difficulty to pick out PPM1D among hundreds or even thousands of predicted targets of miR-16-5p (see Table 3).
[score:5]
CSmiRTar was run with the settings shown in Table 2. - [a]151 (6) means that in miRecords, miR-16-5p has 151 target genes (including PPM1D) predicted by at least 6 different algorithms.
[score:3]
Note that in miRecords, 6 is the most stringent setting of the algorithm filter for still reporting PPM1D as a predicted target gene of miR-16-5p.
[score:3]
For example, human miR-16-5p is known to regulate the gene PPM1D in breast cancer cells [32].
[score:2]
Researchers then have a high chance to pick out the functional targets (e. g. PPM1D) of miR-16-5p for further experimental investigation.
[score:1]
[1 to 20 of 6 sentences]
|
74 |
![]()
Other miRNAs from this paper: hsa-let-7a-1, hsa-let-7a-2, hsa-let-7a-3, hsa-let-7b, hsa-let-7c, hsa-let-7d, hsa-let-7e, hsa-let-7f-1, hsa-let-7f-2, hsa-mir-15a, hsa-mir-25, hsa-mir-27a, hsa-mir-29a, hsa-mir-30a, hsa-mir-98, hsa-mir-29b-1, hsa-mir-29b-2, hsa-mir-103a-2, hsa-mir-103a-1, hsa-mir-105-1, hsa-mir-105-2, hsa-mir-16-2, hsa-mir-196a-1, hsa-mir-198, hsa-mir-208a, hsa-mir-129-1, hsa-mir-30c-2, hsa-mir-30d, hsa-mir-7-1, hsa-mir-7-2, hsa-mir-7-3, hsa-mir-10a, hsa-mir-10b, hsa-mir-34a, hsa-mir-181a-2, hsa-mir-196a-2, hsa-mir-211, hsa-mir-181a-1, hsa-mir-218-1, hsa-mir-218-2, hsa-let-7g, hsa-let-7i, hsa-mir-15b, hsa-mir-27b, hsa-mir-30b, hsa-mir-125b-1, hsa-mir-130a, hsa-mir-135a-1, hsa-mir-135a-2, hsa-mir-138-2, hsa-mir-142, hsa-mir-143, hsa-mir-145, hsa-mir-152, hsa-mir-153-1, hsa-mir-153-2, hsa-mir-9-1, hsa-mir-9-2, hsa-mir-9-3, hsa-mir-125a, hsa-mir-125b-2, hsa-mir-127, hsa-mir-129-2, hsa-mir-138-1, hsa-mir-188, hsa-mir-206, hsa-mir-320a, hsa-mir-155, hsa-mir-29c, hsa-mir-30c-1, hsa-mir-130b, hsa-mir-30e, hsa-mir-340, hsa-mir-328, hsa-mir-337, hsa-mir-323a, hsa-mir-326, hsa-mir-135b, hsa-mir-196b, hsa-mir-320b-1, hsa-mir-320c-1, hsa-mir-320b-2, hsa-mir-298, hsa-mir-208b, hsa-mir-103b-1, hsa-mir-103b-2, hsa-mir-320d-1, hsa-mir-320c-2, hsa-mir-320d-2, hsa-mir-323b, hsa-mir-320e
The top two single-site targets for miR-16 are an Activin type II receptor gene (TGFbeta signaling) and Hox-A5, both known to be dysregulated at the level of protein expression in colon cancers (Wang et al. 2001).
[score:6]
Furthermore, miR-15 and miR-16 are down-regulated, or their loci lost, in 68% of B cell chronic lymphocytic leukemias (Calin et al. 2002).
[score:4]
Both of these sites show near perfect complementary matching between miR-16 and the target genes (indicating possible cleavage).
[score:3]
Our method predicted cancer-specific (by annotation) gene targets of miR-15a, miR-15b, miR-16, miR-143, miR-145, and miR-155.
[score:3]
miR-16 has a tantalizing number of high-ranking targets that are cancer associated and specifically involved in the Sumo pathway There is increasing evidence that Sumo controls pathways important for the surveillance of genome integrity (Muller et al. 2004).
[score:3]
The first- and fifth -highest-ranked targets of miR-16 are Sumo-1 activating and conjugating enzymes, respectively.
[score:3]
The miRNAs miR-15 and miR-16 are located within a 30-kb region at Chromosome 13q14, a region deleted in 50% of B cell chronic lymphocytic leukemias, 50% of mantle cell lymphomas, 16%–40% of multiple myelomas, and 60% of prostate cancers (Calin et al. 2002).
[score:1]
[1 to 20 of 7 sentences]
|
75 |
![]()
Other miRNAs from this paper: hsa-let-7a-1, hsa-let-7a-2, hsa-let-7a-3, hsa-let-7b, hsa-let-7c, hsa-let-7d, hsa-let-7e, hsa-let-7f-1, hsa-let-7f-2, hsa-mir-15a, hsa-mir-17, hsa-mir-20a, hsa-mir-21, hsa-mir-29a, hsa-mir-31, hsa-mir-96, hsa-mir-98, hsa-mir-29b-1, hsa-mir-29b-2, hsa-mir-103a-2, hsa-mir-103a-1, hsa-mir-107, hsa-mir-16-2, hsa-mir-10b, hsa-mir-34a, hsa-mir-181a-2, hsa-mir-181b-1, hsa-mir-181c, hsa-mir-183, hsa-mir-196a-2, hsa-mir-181a-1, hsa-mir-221, hsa-mir-222, hsa-mir-223, hsa-let-7g, hsa-let-7i, hsa-mir-15b, hsa-mir-125b-1, hsa-mir-128-1, hsa-mir-143, hsa-mir-145, hsa-mir-9-1, hsa-mir-9-2, hsa-mir-9-3, hsa-mir-125a, hsa-mir-125b-2, hsa-mir-146a, hsa-mir-184, hsa-mir-155, hsa-mir-181b-2, hsa-mir-128-2, hsa-mir-29c, hsa-mir-301a, hsa-mir-376a-1, hsa-mir-135b, hsa-mir-133b, hsa-mir-146b, hsa-mir-181d, hsa-mir-376a-2, hsa-mir-301b, hsa-mir-103b-1, hsa-mir-103b-2
Cimmino et al. then demonstrated that miR-15a and miR-16-1 expressions were inversely correlated to Bcl2 expression in CLL and that both miRNAs negatively regulated Bcl2 at a posttranscriptional level.
[score:6]
Detailed deletion and expression analysis showed that miR-15 and miR-16 are located within a 30 kb region of loss in CLL, and that both genes were deleted or downregulated in approximately 68% of CLL cases [8].
[score:6]
Recently, Garzon et al. showed that all-trans retinoic acid (ATRA) downregulation of Bcl2 and Ras was correlated with the activation of miR-15a/miR-16-1 [12].
[score:4]
Therefore miR-15 and miR-16 were natural antisense Bcl2 interactors that could be used for therapy of Bcl2 -overexpressing tumors [11].
[score:3]
Bottoni et al. found that miR-15a and miR-16-1 were expressed at lower levels in pituitary adenomas as compared to normal pituitary tissue.
[score:2]
Calin et al. first made the connection between microRNAs and cancer by showing that miR-15 and miR-16 are located at chromosome 13q14, a region deleted in more than half of B-cell chronic lymphocytic leukemia (CLL).
[score:1]
[1 to 20 of 6 sentences]
|
76 |
![]()
Other miRNAs from this paper: hsa-let-7a-1, hsa-let-7a-2, hsa-let-7a-3, hsa-let-7d, hsa-mir-21, hsa-mir-24-1, hsa-mir-24-2, hsa-mir-26a-1, hsa-mir-27a, hsa-mir-93, hsa-mir-103a-2, hsa-mir-103a-1, hsa-mir-16-2, hsa-mir-192, hsa-mir-196a-1, hsa-mir-199a-1, hsa-mir-10b, hsa-mir-196a-2, hsa-mir-199a-2, hsa-mir-210, hsa-mir-223, hsa-let-7g, hsa-mir-122, hsa-mir-191, hsa-mir-126, hsa-mir-146a, hsa-mir-155, hsa-mir-26a-2, hsa-mir-373, hsa-mir-335, hsa-mir-425, hsa-mir-451a, hsa-mir-484, hsa-mir-486-1, hsa-mir-520d, hsa-mir-103b-1, hsa-mir-103b-2, hsa-mir-451b, hsa-mir-486-2
Like miRNA panels, a panel of miR-16 and miR-425 was suggested as an internal control panel because of its more stable expressions in different cancers and controls that may lead to more accurate detection of altered target miRNA expression [56].
[score:7]
Recently, Xiang et al. compared the expressions of U6, miR-16 and miR-24 in serum following several freeze-thaw cycles, knowing that U6 expression gradually decreased after several cycles of freezing and thawing.
[score:4]
In contrast, the expression of miR-16 and miR-24 remained relatively stable.
[score:3]
In a pancreatic cancer study, the combination of miR-16, miR-196a and CA19-9 was even more effective in diagnosing the disease, with AUC, sensitivity, and specificity up to 0.98, 92% and 96%, respectively [50].
[score:3]
Conversely, miR-16 is frequently used as a control because it is highly expressive and relatively invariant across large numbers of samples and tissues [54]; however, elevated levels of miR-16 were found in serum correlating with bone metastasis in breast cancer patients [55].
[score:3]
Additionally, in a pancreatic cancer study we discussed above, the combination of miR-16 and miR-24 was even used to diagnose this cancer [47].
[score:1]
In the pooled studies, internal controls included miR-16, U6 and miR-451, of which U6 and miR-16 seemed more popular.
[score:1]
[1 to 20 of 7 sentences]
|
77 |
![]()
Other miRNAs from this paper: hsa-let-7a-1, hsa-let-7a-2, hsa-let-7a-3, hsa-let-7b, hsa-let-7c, hsa-let-7d, hsa-let-7e, hsa-let-7f-1, hsa-let-7f-2, hsa-mir-17, hsa-mir-19b-1, hsa-mir-19b-2, hsa-mir-21, hsa-mir-22, hsa-mir-29a, hsa-mir-33a, hsa-mir-96, hsa-mir-29b-1, hsa-mir-29b-2, hsa-mir-103a-2, hsa-mir-103a-1, hsa-mir-107, hsa-mir-16-2, hsa-mir-196a-1, hsa-mir-199a-1, hsa-mir-208a, hsa-mir-34a, hsa-mir-181a-2, hsa-mir-182, hsa-mir-196a-2, hsa-mir-199a-2, hsa-mir-199b, hsa-mir-181a-1, hsa-mir-217, hsa-mir-221, hsa-mir-222, hsa-mir-223, hsa-mir-200b, hsa-let-7g, hsa-let-7i, hsa-mir-1-2, hsa-mir-124-1, hsa-mir-124-2, hsa-mir-124-3, hsa-mir-133a-1, hsa-mir-133a-2, hsa-mir-138-2, hsa-mir-142, hsa-mir-144, hsa-mir-145, hsa-mir-9-1, hsa-mir-9-2, hsa-mir-9-3, hsa-mir-125a, hsa-mir-138-1, hsa-mir-146a, hsa-mir-150, hsa-mir-200c, hsa-mir-1-1, hsa-mir-155, hsa-mir-29c, hsa-mir-200a, hsa-mir-34b, hsa-mir-34c, hsa-mir-130b, hsa-mir-383, hsa-mir-133b, hsa-mir-196b, hsa-mir-423, hsa-mir-425, hsa-mir-451a, hsa-mir-146b, hsa-mir-432, hsa-mir-455, hsa-mir-613, hsa-mir-33b, hsa-mir-103b-1, hsa-mir-103b-2, hsa-mir-4458, hsa-mir-451b
Chen L. Wang Q. Wang G. D. Wang H. S. Huang Y. Liu X. M. Cai X. H. miR-16 inhibits cell proliferation by targeting IGF1R and theRraf1-MEK1/2-ERK1/2 pathway in osteosarcomaFEBS Lett.
[score:5]
Finally, in vitro and in vivo mo dels show that miR-16 inhibits cell proliferation by targeting IGF1R [154].
[score:5]
Interestingly, some microRNAs that are differentially expressed by CR, have been described as regulators of nutrient sensing pathways (let-7, miR-34, miR-425, miR-16, miR-155, miR-144, miR-451).
[score:4]
In murine mo dels, a group of miRNAs (miR-425, miR-196, miR-155, miR-150, miR-351, miR-16, let-7, miR-34, and miR-138) were differentially expressed between the control and CR groups [164].
[score:3]
Moreover, miR-155 and miR-16 were found to be upregulated in B-cells of elderly subjects compared to young subjects [110].
[score:3]
Frasca D. Diaz A. Romero M. Ferracci F. Blomberg B. B. MicroRNAs miR-155 and miR-16 decrease AID and E47 in B cells from elderly individualsJ.
[score:1]
[1 to 20 of 6 sentences]
|
78 |
![]()
Other miRNAs from this paper: hsa-let-7b, hsa-mir-22, hsa-mir-16-2, hsa-mir-30d, hsa-mir-140, hsa-mir-191, hsa-mir-150, hsa-mir-195, hsa-mir-320a, hsa-mir-451a, hsa-mir-484
Let-7b also had lower expression in circulating blood from the breast cancer cohort, an observation that was not statistically supported by sequencing results, and no evidence of differential expression was observed using either method for miR-195 or miR-16.
[score:5]
The standard curve for the miRNA target miR-195 and miR-16 ranged from 10 [8] to 10 [3] copies.
[score:3]
No differences in expression levels were found for the miR-195 or miR-16 (Table 5, Fig 3B).
[score:3]
MiR-16 expression levels were analysed with RT-qPCR as a stable endogenous control [18].
[score:2]
0137389.g002 Fig 2 Real-time PCR amplification curves detecting the mature miR16 standard curve 10*8–10*4 (circles- decreasing in concentration from left to right) with detection of precursor miR-16 sequence from 10*8–10*6 (triangles- decreasing in concentration from left to right) with the no template control, highlighted with diamonds in the FAM channel (465 to 510 nm).
[score:1]
Analysis of precursor and mature miR-16 sequence using real-time PCR.
[score:1]
Log 10 box-plots indicating changes in expression of miR-195, miR-16 and Let-7b from healthy to cancer state measured in total RNA using RT-qPCR.
[score:1]
Log 10 box-plots indicating changes in expression of miR-195, miR-16 and Let-7b from healthy to cancer state measured in enriched small RNA using RT-qPCR.
[score:1]
MiR-195 and miR-16 showed no notable differences between groups (Table 5, Fig 3A).
[score:1]
This finding is consistent with the use of miR-16 as a stable endogenous control [78].
[score:1]
MiR-320a, let-7b, miR-195 and miR-16 were analysed and quantified using RT-qPCR in samples from both the healthy controls and breast cancer patients using both total RNA and enriched small RNA.
[score:1]
As such, for the purposes of this study miR-320a, let-7b, miR-16 and miR-195 were examined by RT-qPCR using both total RNA and also by developing a pre-RT-qPCR enrichment process for RNA <30 bases.
[score:1]
[1 to 20 of 12 sentences]
|
79 |
![]()
Other miRNAs from this paper: hsa-let-7a-1, hsa-let-7a-2, hsa-let-7a-3, hsa-let-7b, hsa-let-7c, hsa-let-7d, hsa-let-7e, hsa-let-7f-1, hsa-let-7f-2, hsa-mir-17, hsa-mir-20a, hsa-mir-21, hsa-mir-93, hsa-mir-29b-1, hsa-mir-29b-2, hsa-mir-16-2, hsa-mir-34a, hsa-mir-182, hsa-mir-210, hsa-let-7g, hsa-let-7i, hsa-mir-125b-1, hsa-mir-132, hsa-mir-141, hsa-mir-125b-2, hsa-mir-146a, hsa-mir-195, hsa-mir-155, hsa-mir-376c, hsa-mir-378a, hsa-mir-424, hsa-mir-20b, hsa-mir-515-1, hsa-mir-515-2, hsa-mir-526b, hsa-mir-518b, hsa-mir-518c, hsa-mir-519d, hsa-mir-517b, hsa-mir-516b-2, hsa-mir-516b-1, hsa-mir-520h, hsa-mir-516a-1, hsa-mir-516a-2, hsa-mir-1323, hsa-mir-675
Similarly, miR-16 also targets VEGFA and the expression level of VEGFA is negatively correlated with the level of miR-16 expression in patients with severe PE [118].
[score:7]
In addition, overexpression of miR-16 in decidua-derived mesenchymal stem cells inhibits the ability of HTR8 cells to migrate and human umbilical vein endothelial cells (HUVEC) to form tube-like structures [118], suggesting that miR-16 is a negative regulator of angiogenesis.
[score:6]
For example, several up-regulated miRNAs in preeclamptic placenta, including miR-210 [83, 105], miR-20b [136], miR-29b [23], miR-16 [25], miR-155 [117] and miR-675 [115], have been demonstrated or suggested to inhibit angiogenesis and/or trophoblast proliferation, migration and invasion.
[score:6]
In addition, miR-16, miR-21 and miR-146a levels are also significantly lower in placentas obtained from women who smoked during pregnancy than in placentas from non-smoking women [111].
[score:1]
Low levels of miR-21 and miR-16 in the placenta are associated with fetal growth and reduced levels of these miRNAs have both shown to be predictive of SGA status [116].
[score:1]
[1 to 20 of 5 sentences]
|
80 |
![]()
Other miRNAs from this paper: hsa-let-7a-1, hsa-let-7a-2, hsa-let-7a-3, hsa-let-7b, hsa-let-7c, hsa-let-7d, hsa-let-7e, hsa-let-7f-1, hsa-let-7f-2, hsa-mir-19b-1, hsa-mir-19b-2, hsa-mir-20a, hsa-mir-22, hsa-mir-23a, hsa-mir-26b, hsa-mir-98, hsa-mir-99a, hsa-mir-100, hsa-mir-101-1, hsa-mir-103a-2, hsa-mir-103a-1, hsa-mir-16-2, hsa-mir-192, hsa-mir-148a, hsa-mir-30c-2, hsa-mir-139, hsa-mir-10b, hsa-mir-181b-1, hsa-mir-182, hsa-mir-221, hsa-mir-200b, hsa-let-7g, hsa-let-7i, hsa-mir-122, hsa-mir-141, hsa-mir-142, hsa-mir-150, hsa-mir-185, hsa-mir-320a, hsa-mir-181b-2, hsa-mir-30c-1, hsa-mir-200a, hsa-mir-101-2, hsa-mir-130b, hsa-mir-361, hsa-mir-375, hsa-mir-451a, hsa-mir-486-1, hsa-mir-202, hsa-mir-532, hsa-mir-769, hsa-mir-3120, hsa-mir-378c, hsa-mir-486-2, hsa-mir-7704
The top five differentially upregulated miRNAs in LGDN (Table 2) were: miR-141 (625-fold), miR-101 (208-fold), miR-22 (111-fold), miR-16 (61-fold), and miR-486 (35-fold); whereas, the top five downregulated were: miR-451a (513-fold), miR-378c (104-fold), miR-361 (95-fold), miR-122 (81-fold), and miR-30c (78-fold).
[score:7]
The top five differentially upregulated miRNAs in HGDN (Table 3) were: miR-101 (266-fold), miR-22 (170-fold), miR-16 (54-fold), miR-192 (45-fold), and miR-19b (34-fold).
[score:4]
Our data correlates with recent studies that have shown miR-16 upregulation in HCC.
[score:4]
GEMOX (Gemcitabine and oxaliplatin) is one of the chemotherapeutic options in HCC treatment, which specifically targets VEGF and miR-16 [51].
[score:3]
Vascular endothelial growth factor (VEGF) plays a major role in tumor development, and is partly regulated by miR-16.
[score:3]
[1 to 20 of 5 sentences]
|
81 |
![]()
Other miRNAs from this paper: hsa-let-7a-1, hsa-let-7a-2, hsa-let-7a-3, hsa-let-7b, hsa-let-7c, hsa-let-7d, hsa-let-7e, hsa-let-7f-1, hsa-let-7f-2, hsa-mir-17, hsa-mir-22, hsa-mir-25, hsa-mir-32, hsa-mir-92a-1, hsa-mir-92a-2, hsa-mir-103a-2, hsa-mir-103a-1, hsa-mir-16-2, hsa-mir-181a-2, hsa-mir-181b-1, hsa-mir-181c, hsa-mir-181a-1, hsa-let-7g, hsa-let-7i, hsa-mir-142, hsa-mir-146a, hsa-mir-186, hsa-mir-181b-2, hsa-mir-451a, hsa-mir-486-1, hsa-mir-181d, hsa-mir-147b, hsa-mir-103b-1, hsa-mir-103b-2, hsa-mir-451b, hsa-mir-486-2
Two miRNAs significantly upregulated in infected horses, as identified by DESeq2 (miR-16 and miR-32), were also upregulated when expression levels were measured by qRT-PCR and normalized against relative levels of miR-103 (Fig. 6).
[score:7]
The four highest-expressed miRNAs (miR-486-5p, miR-451, miR-16 and miR-92a) are known to be highly expressed in erythrocytes 32, 33.
[score:5]
miR-16, validated in the present study as up-regulated by HeV, also shows a pro-viral phenotype [35].
[score:4]
Graphs show relative expression levels of miR-16 and miR-32 in infected and uninfected samples.
[score:3]
Approximately 13% of the total reads corresponded to the second most abundant miRNA, miR-451, while miR-16 and miR-92a each took up about 1.5% of reads.
[score:1]
Two of these candidates included miR-16 and miR-32.
[score:1]
[1 to 20 of 6 sentences]
|
82 |
![]()
Other miRNAs from this paper: hsa-let-7a-1, hsa-let-7a-2, hsa-let-7a-3, hsa-let-7d, hsa-mir-17, hsa-mir-21, hsa-mir-27a, hsa-mir-93, hsa-mir-106a, hsa-mir-16-2, hsa-mir-199a-1, hsa-mir-7-1, hsa-mir-7-2, hsa-mir-7-3, hsa-mir-181b-1, hsa-mir-199a-2, hsa-mir-218-1, hsa-mir-218-2, hsa-mir-221, hsa-mir-223, hsa-mir-15b, hsa-mir-27b, hsa-mir-191, hsa-mir-200c, hsa-mir-181b-2, hsa-mir-106b, hsa-mir-376c, hsa-mir-378a, hsa-mir-151a, hsa-mir-425, hsa-mir-151b, hsa-mir-378d-2, hsa-mir-744, hsa-mir-378b, hsa-mir-378c, hsa-mir-378d-1, hsa-mir-378e, hsa-mir-378f, hsa-mir-378g, hsa-mir-378h, hsa-mir-378i, hsa-mir-378j
Lastly, miR-15b and miR-16 are able to modulate the sensitivity of GC cells to certain anticancer drugs, at least in part by regulating BCL2 expression [14].
[score:4]
Another study focusing on suitable reference genes for qRT-PCR analysis of serum miRNAs indicated that miR-16 and miR-93 were the most stably expressed reference miRNA genes across patients and healthy controls [28].
[score:3]
Xia L. Zhang D. Du R. Pan Y. Zhao L. Sun S. Hong L. Liu J. Fan D. miR-15b and miR-16 modulate multidrug resistance by targeting BCL2 in human gastric cancer cellsInt.
[score:3]
This difference was significant (Figure 2a), suggesting a lower background in non-tumor serum for miR-191/425 expression relative to miR-16 and miR-21.
[score:3]
In the normal serum, the mean Cq of both miR-191 (Cq = 33) and miR-425 (Cq = 35) was higher than the mean Cq of both miR-16 (Cq = 26) and miR-21 (Cq = 28) (Figure 2a).
[score:1]
Justification of number and choice of reference genes E Yes Materials and Methods: U6snRNA and miR-16 were used as the endogenous control for data normalization, respectively.
[score:1]
However, when using miR-16 as an endogenous control, the relative levels of miR-106, let-7d and miR-21 before and after H. pylori eradication were significantly higher in the high-risk group than in the control group [31].
[score:1]
miR-16, the serum level of which has been shown to have no significant difference between GC samples and normal controls [28], was used as a negative control.
[score:1]
The difference between miR-191 levels in the patient and healthy groups varied depending on whether U6 snRNA (p = 0.036) or miR-16 (p = 0.007) was used as a reference gene in our experiments.
[score:1]
Here, we also used different reference genes (U6 snRNA and miR-16) in miR-191 data analysis.
[score:1]
The cycle passing threshold (Cq) was recorded for each candidate miRNA, and U6 snRNA and miR-16 were used as endogenous controls for data normalization.
[score:1]
In contrast, when using miR-16 as an endogenous control, the relative level of miR-191 in GC serum was significantly higher than those in the controls (p < 0.01) (Figure 2b).
[score:1]
[1 to 20 of 12 sentences]
|
83 |
![]()
Other miRNAs from this paper: hsa-let-7a-1, hsa-let-7a-2, hsa-let-7a-3, hsa-let-7b, hsa-let-7c, hsa-let-7d, hsa-let-7e, hsa-let-7f-1, hsa-let-7f-2, hsa-mir-15a, hsa-mir-21, hsa-mir-22, hsa-mir-24-2, hsa-mir-16-2, hsa-mir-10b, hsa-mir-222, hsa-let-7g, hsa-let-7i, hsa-mir-15b, hsa-mir-132, hsa-mir-146b, hsa-mir-202, hsa-mir-193b, hsa-mir-503, hsa-mir-577, hsa-mir-890, hsa-mir-877
In particular, elevated expression of E2F1 and E2F3 in response to mitogenic stimuli have been shown to enhance the expression of its transcriptional targets: hsa-let-7 and hsa-miR-16 family members [22].
[score:7]
Asterisks mark statistical significance (p < 0.05)Among several cell cycle regulator miRNAs, members of the hsa-miR-16 family were found to display dynamic changes in expression between serum-starved G0 and actively proliferating state [23].
[score:4]
Asterisks mark statistical significance (p < 0.05) Among several cell cycle regulator miRNAs, members of the hsa-miR-16 family were found to display dynamic changes in expression between serum-starved G0 and actively proliferating state [23].
[score:4]
Therefore, we analyzed expression changes of the hsa-miR-16 family members: hsa-miR-16, hsa-miR-15a and hsa-miR-503 in our high-throughput data (Fig. 4, Panel a-d and Additional file 2: Figure S5, Panel a) and performed qRT-PCR analysis as well (Fig. 4, Panel e-g).
[score:3]
Colored circles represent some members of the hsa-miR-16 family, if available.
[score:1]
Such accelerated turnover has been confirmed in the case of the hsa-miR-16 family [23].
[score:1]
In particular, mitogenic stimuli enhances cell cycle progression by stimulating key transcriptional factors of the E2F family, which in turn enhances members of the hsa-let-7 and hsa-miR-16 families [17, 22, 23].
[score:1]
[1 to 20 of 7 sentences]
|
84 |
![]()
Other miRNAs from this paper: hsa-mir-15a, hsa-mir-16-2, mmu-mir-15b, hsa-mir-214, hsa-mir-15b, mmu-mir-15a, mmu-mir-16-1, mmu-mir-16-2, mmu-mir-214, hsa-mir-761, mmu-mir-761
We demonstrate that HMGA1P7 overexpression increases H19 and Igf2 levels inhibiting their mRNA suppression by miRNAs that target HMGA1P7 gene, namely, miR-15, miR-16, miR-214, and miR-761.
[score:9]
As proposed by our mo del, siRNA- Igf2 transfection induces a significant H19 downregulation, that is reverted by the transfection with the Anti miR-16 oligonucleotide, suggesting that both H19 and Igf2 transcripts can talk each-other through miRNAs mediation (Fig. 4D).
[score:4]
For transfection of Anti miR-16 oligonucleotides, cells were transfected with 50 nmol/ml of Anti miR-16 or with a control no -targeting scrambled oligonucleotides (Thermo Fisher Scientific Inc).
[score:3]
To this aim, we transfected miR-15, miR-16, miR-214 and miR-761 (already reported to target HMGA1P7) 17 into NIH3T3 cells, and analyzed H19 and Igf2 mRNA levels by qRT-PCR.
[score:3]
The luciferase signal was considerably lower after transfection with miR-15, miR-16, miR-214 and miR-761 in comparison with the cells transfected with the scrambled oligonucleotide (Fig. 4B).
[score:1]
Relative luciferase activity in HEK293 cells transiently transfected with miR-15, miR-16, miR-214, miR-761 and a control scrambled oligonucleotide.
[score:1]
[1 to 20 of 6 sentences]
|
85 |
![]()
Other miRNAs from this paper: hsa-let-7a-1, hsa-let-7a-2, hsa-let-7a-3, hsa-let-7b, hsa-let-7c, hsa-let-7d, hsa-let-7e, hsa-let-7f-1, hsa-let-7f-2, hsa-mir-25, hsa-mir-16-2, hsa-let-7g, hsa-let-7i, hsa-mir-302a, hsa-mir-302b, hsa-mir-302c, hsa-mir-302d, hsa-mir-375, hsa-mir-378a, hsa-mir-570, hsa-mir-574, hsa-mir-579, hsa-mir-631, hsa-mir-378d-2, hsa-mir-302e, hsa-mir-302f, hsa-mir-378b, hsa-mir-378c, hsa-mir-378d-1, hsa-mir-378e, hsa-mir-378f, hsa-mir-378g, hsa-mir-378h, hsa-mir-378i, hsa-mir-378j
Six of these miRNAs miR-16, miR-302d-3p, miR-378e, miR-570–3p, miR-574-5p, miR-579; were down-regulated and one was up-regulated miR-25-3p in T1DM plasma-derived exosome samples compared to the control (p value < 0.05) (Figs 2B and 3).
[score:6]
We identified and confirmed that of the seven miRNAs whose levels change in plasma exosomes from T1DM subjects, 6 which were lower in T1DM patients (miR-16, miR-302d-3p, miR-378e, miR-570-3p, miR-574-5p, and miR-579) and 1 upregulated (miR-25-3p) several appear to play important roles in diabetes.
[score:4]
miRNA miRBase ID sequence hsa-miR-16-5p MIMAT0000069 uagcagcacguaaauauuggcg hsa-miR-25-3p MIMAT0000081 cauugcacuugucucggucuga hsa-miR-302d-3p MIMAT0000718 uaagugcuuccauguuugagugu hsa-miR-378e MIMAT0018927 acuggacuuggagucagga hsa-miR-570-3p MIMAT0003235 cgaaaacagcaauuaccuuugc hsa -miRNA- 574-5p MIMAT0004795 ugagugugugugugugagugugu hsa -miRNA-579 MIMAT0003244 uucauuugguauaaaccgcgauu hsa -miRNA- 631 MIMAT0003300 agaccuggcccagaccucagc hsa -miRNA-let-7 MIMAT0000062 ugagguaguagguuguauaguu hsa-RNU6-2 — acgcaaattcgtgaagcgtt Because of the absence of a validated reference genes in the plasma exosome samples for the normalization of exosome microRNA expression data, it was critical to choose an appropriate housekeeping microRNA.
[score:3]
MiR-16-5p was down-regulated after long-term exposure to elevated insulin and glucose levels in myoblasts [24].
[score:3]
Interestingly, when examining the level of the miRNA in plasma exosomes in T1DM and control subjects, only miR-16-5p, miR-574-5p and miR-302d-3p were significantly higher in plasma exosomes from controls than those from T1DM (p-value < 0.05 and p-value < 0.01) (Fig. 4).
[score:1]
Furthermore, miR-16, miR-570, miR-574 and miR-579 have been found in extracellular vesicles released from human pancreatic islets [18].
[score:1]
To validate the RNA sequencing data, we performed a qRT-PCR analysis of hsa-let-7, hsa-miR-631, RNU6, hsa-miR-16-5p, hsa-miR-25-3p, hsa-miR-302d-3p, hsa-miR-378e, hsa-miR-570-3p, hsa-miR-574-5p, and hsa-miR-579.
[score:1]
From those, all followed the same tendency in both techniques but only 3 microRNAS, miR-16-5p, miRNA-302d-3p, miR-574-5p, shown to be significant by qRT-PCR.
[score:1]
[1 to 20 of 8 sentences]
|
86 |
![]()
Other miRNAs from this paper: hsa-let-7a-1, hsa-let-7a-2, hsa-let-7a-3, hsa-let-7b, hsa-let-7c, hsa-let-7d, hsa-let-7e, hsa-let-7f-1, hsa-let-7f-2, hsa-mir-17, hsa-mir-18a, hsa-mir-19a, hsa-mir-21, hsa-mir-22, hsa-mir-24-1, hsa-mir-24-2, hsa-mir-25, hsa-mir-26a-1, hsa-mir-26b, hsa-mir-27a, hsa-mir-30a, hsa-mir-31, hsa-mir-98, hsa-mir-99a, hsa-mir-101-1, hsa-mir-16-2, hsa-mir-192, hsa-mir-197, hsa-mir-199a-1, hsa-mir-208a, hsa-mir-30c-2, hsa-mir-30d, hsa-mir-10a, hsa-mir-10b, hsa-mir-34a, hsa-mir-187, hsa-mir-199a-2, hsa-mir-199b, hsa-mir-203a, hsa-mir-211, hsa-mir-219a-1, hsa-mir-221, hsa-mir-222, hsa-mir-223, hsa-mir-224, hsa-mir-200b, hsa-let-7g, hsa-let-7i, hsa-mir-27b, hsa-mir-30b, hsa-mir-122, hsa-mir-124-1, hsa-mir-124-2, hsa-mir-124-3, hsa-mir-125b-1, hsa-mir-128-1, hsa-mir-132, hsa-mir-133a-1, hsa-mir-133a-2, hsa-mir-138-2, hsa-mir-140, hsa-mir-142, hsa-mir-143, hsa-mir-144, hsa-mir-145, hsa-mir-191, hsa-mir-9-1, hsa-mir-9-2, hsa-mir-9-3, hsa-mir-125a, hsa-mir-125b-2, hsa-mir-126, hsa-mir-138-1, hsa-mir-146a, hsa-mir-200c, hsa-mir-155, hsa-mir-128-2, hsa-mir-29c, hsa-mir-30c-1, hsa-mir-200a, hsa-mir-101-2, hsa-mir-219a-2, hsa-mir-34b, hsa-mir-34c, hsa-mir-99b, hsa-mir-30e, hsa-mir-26a-2, hsa-mir-375, hsa-mir-328, hsa-mir-337, hsa-mir-338, hsa-mir-339, hsa-mir-384, hsa-mir-424, hsa-mir-429, hsa-mir-449a, hsa-mir-485, hsa-mir-146b, hsa-mir-494, hsa-mir-497, hsa-mir-498, hsa-mir-520a, hsa-mir-518f, hsa-mir-499a, hsa-mir-509-1, hsa-mir-574, hsa-mir-582, hsa-mir-606, hsa-mir-629, hsa-mir-449b, hsa-mir-449c, hsa-mir-509-2, hsa-mir-874, hsa-mir-744, hsa-mir-208b, hsa-mir-509-3, hsa-mir-1246, hsa-mir-1248, hsa-mir-219b, hsa-mir-203b, hsa-mir-499b
Microarray analysis of nasal mucosa identified several miRNAs with altered expression in acute RSV -positive infants (down-regulated miR-34b, miR-34c, miR-125b, miR-29c, mir125a, miR-429 and miR-27b and up-regulated miR-155, miR-31, miR-203a, miR-16 and let-7d) as compared to healthy infants [86].
[score:8]
Functional studies revealed that let-7f inhibits hMPV replication and that the M2-2 hMPV protein blocking mitochondrial antiviral signaling inhibits the expression of miR-16 and miR-30a.
[score:7]
Moreover, miR-16 was discovered to restore the deltaF508 CFTR protein function by regulating the cAMP-activated chloride conductance and by reducing the IL-8 expression [65].
[score:4]
Kumar P. Bhattacharyya S. Peters K. W. Glover M. L. Sen A. Cox R. T. Kundu S. Caohuy H. Frizzell R. A. Pollard H. B. miR-16 rescues F508 del-CFTR function in native cystic fibrosis epithelial cellsGene Ther.
[score:1]
[1 to 20 of 4 sentences]
|
87 |
![]()
Other miRNAs from this paper: hsa-let-7a-1, hsa-let-7a-2, hsa-let-7a-3, hsa-let-7b, hsa-let-7c, hsa-let-7d, hsa-let-7e, hsa-let-7f-1, hsa-let-7f-2, hsa-mir-15a, hsa-mir-17, hsa-mir-18a, hsa-mir-20a, hsa-mir-21, hsa-mir-26a-1, hsa-mir-26b, hsa-mir-31, hsa-mir-33a, hsa-mir-92a-1, hsa-mir-92a-2, hsa-mir-93, hsa-mir-100, hsa-mir-101-1, hsa-mir-106a, hsa-mir-16-2, hsa-mir-192, hsa-mir-197, hsa-mir-34a, hsa-mir-181b-1, hsa-mir-203a, hsa-mir-222, hsa-mir-200b, hsa-let-7g, hsa-let-7i, hsa-mir-15b, hsa-mir-125b-1, hsa-mir-135a-1, hsa-mir-135a-2, hsa-mir-137, hsa-mir-141, hsa-mir-143, hsa-mir-145, hsa-mir-191, hsa-mir-125b-2, hsa-mir-126, hsa-mir-320a, hsa-mir-200c, hsa-mir-181b-2, hsa-mir-200a, hsa-mir-101-2, hsa-mir-34b, hsa-mir-34c, hsa-mir-26a-2, hsa-mir-135b, hsa-mir-429, hsa-mir-451a, hsa-mir-486-1, hsa-mir-146b, hsa-mir-498, hsa-mir-33b, hsa-mir-320b-1, hsa-mir-320c-1, hsa-mir-320b-2, hsa-mir-320d-1, hsa-mir-320c-2, hsa-mir-320d-2, hsa-mir-320e, hsa-mir-203b, hsa-mir-451b, hsa-mir-486-2
It was later shown that miR-15a and miR-16-1 expression silenced the anti-apoptotic factor BCL-2, suggesting that their absence in CLL inhibit apoptosis by reactivation of BCL-2 [47].
[score:5]
Further, reduced expression of cancer-related genes in miR-16 -transfected prostate cancer cells was analyzed and verified that genes associated with cell-cycle progression were mostly down regulated by synthetic miR-16.
[score:4]
Expression analysis reported by Calin et al. [46] has indicated that miR-15 and miR-16 were either absent or down regulated in the 68% of CLL patients.
[score:4]
Finally, three microRNAs known as oncomiRs, mir-21, let-7i, and mir-16, were transfected in three of NCI-60 cell lines and the effect of their expression on the potencies of a number of compounds with anticancer activity was tested showing a substantial role for microRNAs in anticancer drug response and suggesting a novel potential approach to the improvement of chemotherapy [84].
[score:3]
These results suggest the therapeutic potency of miR-16 in bone metastatic prostate cancer [134]; although some discrepancies between other miRNA and vector types’ influence can be implicated in growth inhibition [135].
[score:3]
Accumulating evidence supports miR-16 as a potentially ideal normalizing miRNA gene.
[score:1]
[1 to 20 of 6 sentences]
|
88 |
![]()
Other miRNAs from this paper: hsa-let-7a-1, hsa-let-7a-2, hsa-let-7a-3, hsa-let-7b, hsa-let-7c, hsa-let-7d, hsa-let-7e, hsa-let-7f-1, hsa-let-7f-2, hsa-mir-21, hsa-mir-24-1, hsa-mir-24-2, hsa-mir-98, hsa-mir-16-2, hsa-mir-30c-2, hsa-mir-30d, hsa-let-7g, hsa-let-7i, hsa-mir-15b, hsa-mir-23b, hsa-mir-27b, hsa-mir-30b, hsa-mir-125b-1, hsa-mir-132, hsa-mir-9-1, hsa-mir-9-2, hsa-mir-9-3, hsa-mir-125b-2, hsa-mir-146a, hsa-mir-320a, hsa-mir-155, hsa-mir-30c-1, hsa-mir-326, hsa-mir-424, hsa-mir-146b, hsa-mir-320b-1, hsa-mir-320c-1, hsa-mir-320b-2, hsa-mir-320d-1, hsa-mir-320c-2, hsa-mir-320d-2, hsa-mir-320e
Increased expression of miR-125b, miR-16, miR-23b, miR-21 and miR-30b, as well as decreased expression of miR-98, was further confirmed in cells following C. parvum infection for 12 h by (Figure 2B).
[score:5]
Several miRNAs upregulated in H69 following C. parvum infection are cluster miRNAs; e. g., miR-23b, miR-27b and miR-24 are from the mir-23b-27b-24-1 gene cluster and miR-15b and miR-16 from the mir-15b-16-2 cluster [31], [32].
[score:4]
An increased expression of the precursors for miR-125b, miR-16, miR-21 and miR-23b was also detected in cells following C. parvum infection by (Figure 2B).
[score:3]
Figure S7p65-independent expression of miR-30c and miR-16 in cholangiocytes in response to C. parvum infection.
[score:3]
Increased expression of miR-125b, miR-21, miR-23b, miR-30b and miR-16 was detected in H69 cells following C. parvum infection for 12 h to 24 h, but not in the early time points (2 h to 8 h) (Figure 2A).
[score:3]
Five additional miRNAs (miR-15b, miR-16, miR-27b, miR-24, and miR-21) showed a tendency to increase (0.05
[score:1]
Transfection of cells with anti-miRs to miR-125b, miR-23b or miR-30b, but not anti-miRs to miR-16 or miR-21, significantly increased parasite burden in cholangiocytes.
[score:1]
[1 to 20 of 7 sentences]
|
89 |
![]()
Other miRNAs from this paper: hsa-let-7a-1, hsa-let-7a-2, hsa-let-7a-3, hsa-let-7b, hsa-let-7c, hsa-let-7d, hsa-let-7e, hsa-let-7f-1, hsa-let-7f-2, hsa-mir-15a, hsa-mir-21, hsa-mir-23a, hsa-mir-24-1, hsa-mir-24-2, hsa-mir-26a-1, hsa-mir-29a, hsa-mir-103a-2, hsa-mir-103a-1, hsa-mir-16-2, hsa-mir-199a-1, hsa-mir-34a, hsa-mir-199a-2, hsa-mir-203a, hsa-mir-214, hsa-let-7g, hsa-let-7i, hsa-mir-143, hsa-mir-145, hsa-mir-125a, hsa-mir-195, hsa-mir-155, hsa-mir-26a-2, hsa-mir-103b-1, hsa-mir-103b-2, hsa-mir-203b
Due to its negative regulation on some of these tumor suppressor-like miRNAs, including miR-16 and miR-26a, ERα can amplify the tumorigenic signals from VEGF [71], EZH2 [72] and some oncogenes that are targeted by miR-16 or miR-26a in breast epithelial cells.
[score:6]
Conversely, such an upregulation was reversed by estrogen (E2) treatment, suggesting that estrogen and its receptor signaling are negative regulators for certain miRNAs, including miR-16, miR-26a, miR-29a, miR-125a, miR-143, miR-145, miR-195, etc.
[score:5]
Both miR-15a and miR-16-1 have been shown to target the anti-apoptotic protein, BCL2 [57, 58].
[score:3]
Interestingly, expression of miR-15a and miR-16-1 is often reduced in tumors.
[score:3]
Along with the non-transcriptional induction of miR-15a, miR-16, miR-26a, and miR-145, the observation that miR-34a was the only transcriptionally regulated miRNA in both studies is the key to linking these two studies together.
[score:2]
These miRNAs include miR-15a, miR-16-1, miR-23a, miR-26a, miR-103, miR-143, miR-145, miR-203, as well as miR-34a that had previously been determined to be induced by p53 [52].
[score:1]
[1 to 20 of 6 sentences]
|
90 |
![]() |